Executive Summary
- Across a variety of measures, investors appear to be favoring accumulation over distribution. Notably, Long-Term Holder supply continues to climb, whilst Shrimp (<1 BTC), Crabs (1–10 BTC), and Fish (10–100 BTC) continue to accumulate coins at a pace of +19.3k BTC/Month, which is significantly larger than the monthly issuance of +13.4k BTC/Month.
- There’s growing confluence across both on-chain and derivatives markets, with several indicators pointing toward elevated volatility expectations. This observation is similarly supported by the coiling and compression of price across multiple timeframes.
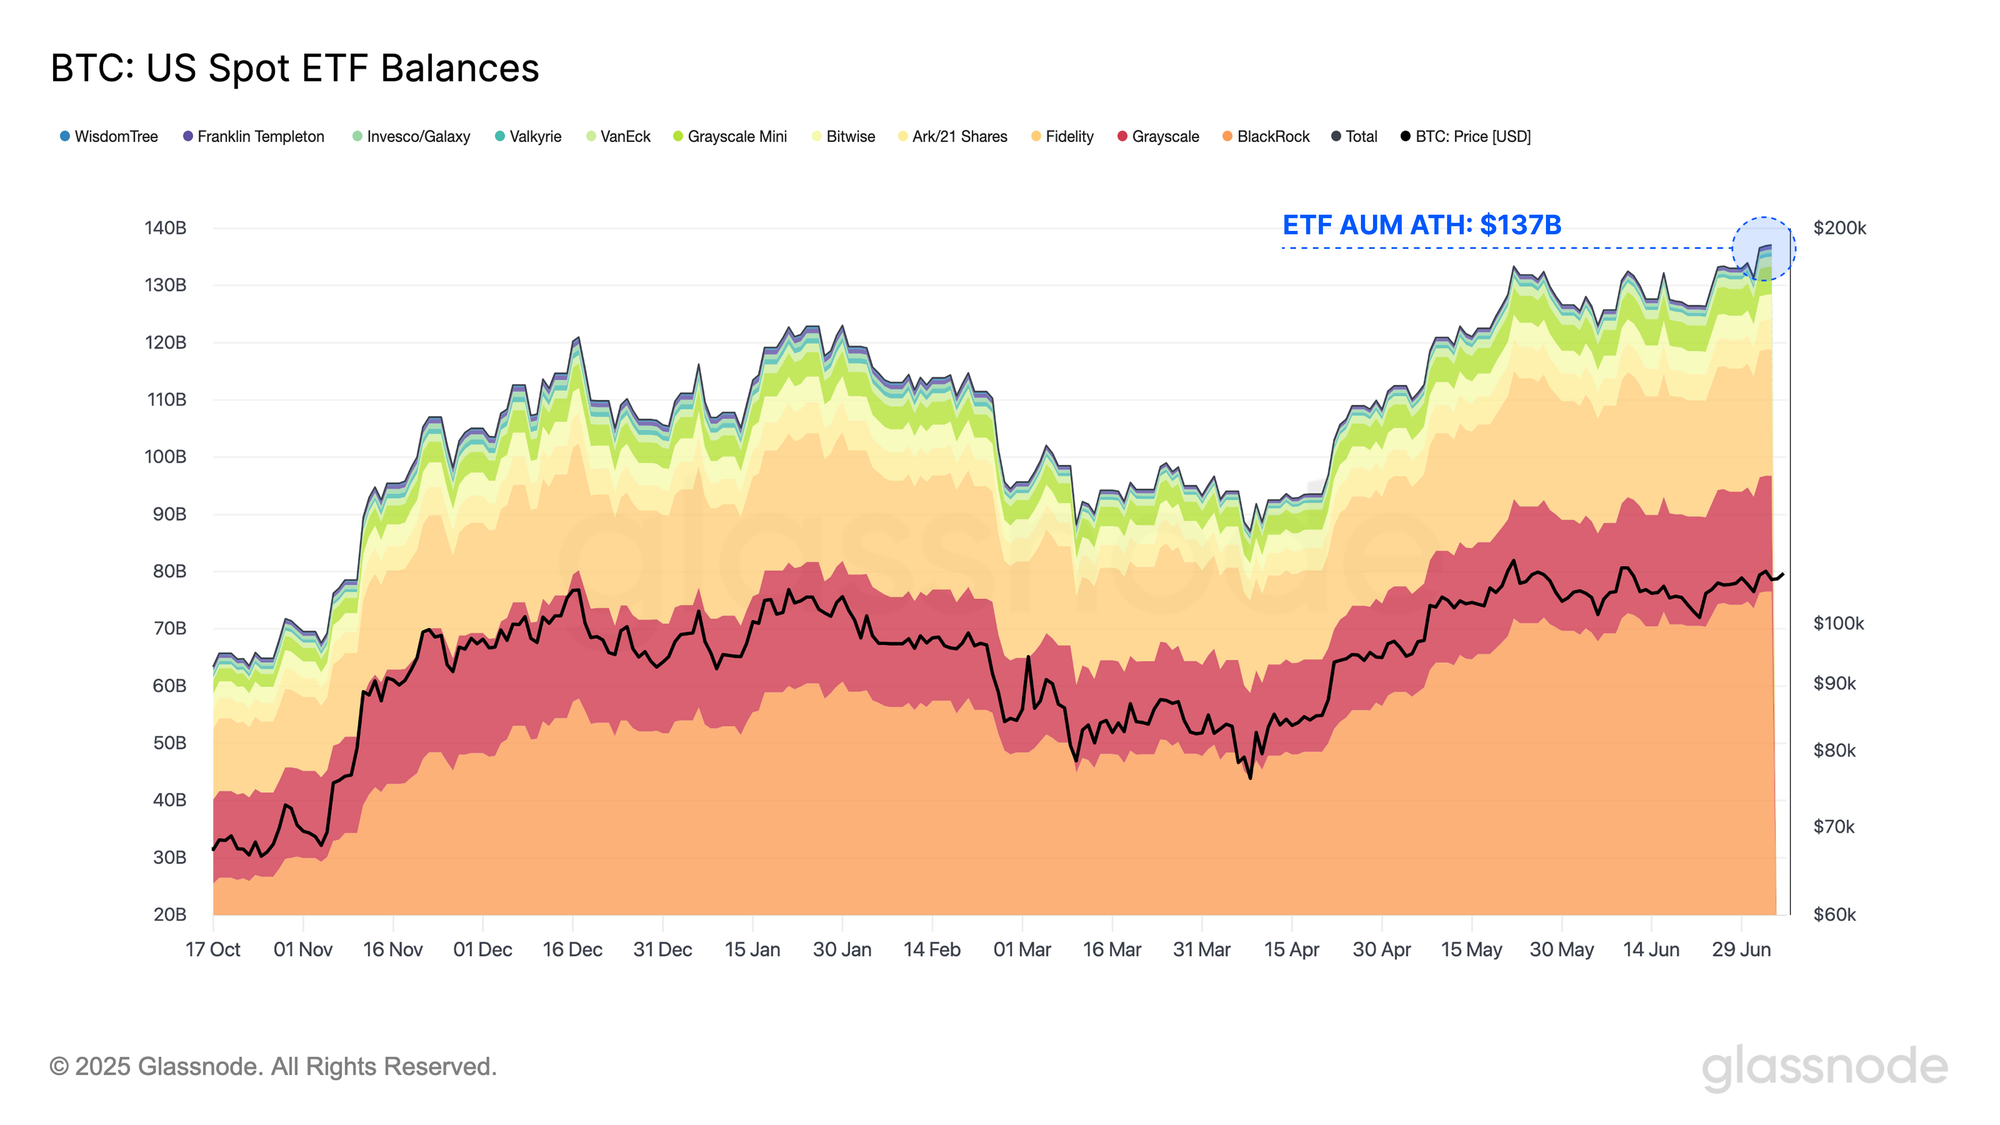
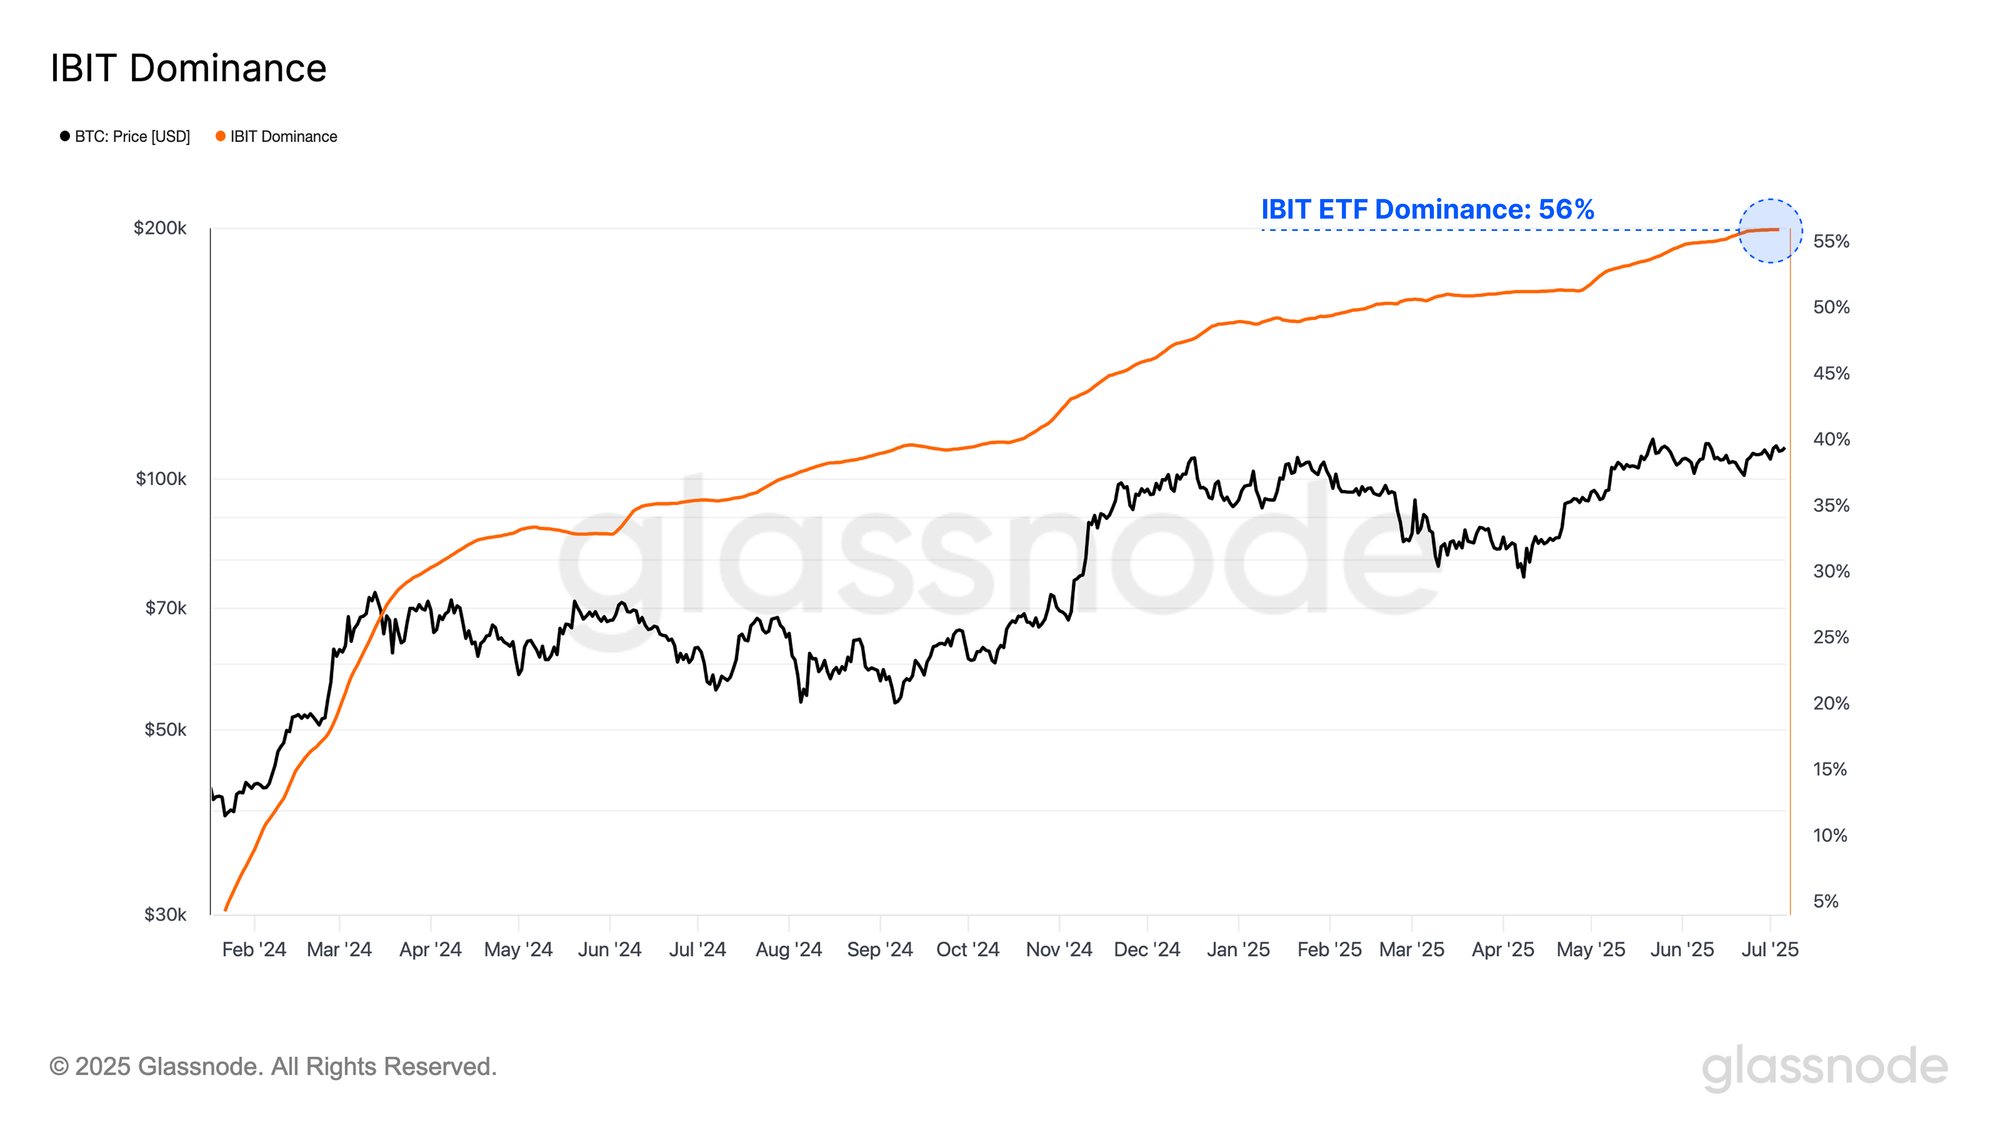
- While ETF inflows have cooled slightly, total AUM across the complex has hit a new ATH of $137B. BlackRock’s IBIT continues to dominate, now representing 55% of the total, with Fidelity and Grayscale following at 16.2% and 14.7%, respectively.
An Accumulation Dominant Regime
Since the start of the month, Bitcoin price action has remained largely flat, oscillating within an increasingly narrow price range just below the all-time high of $111.7K.
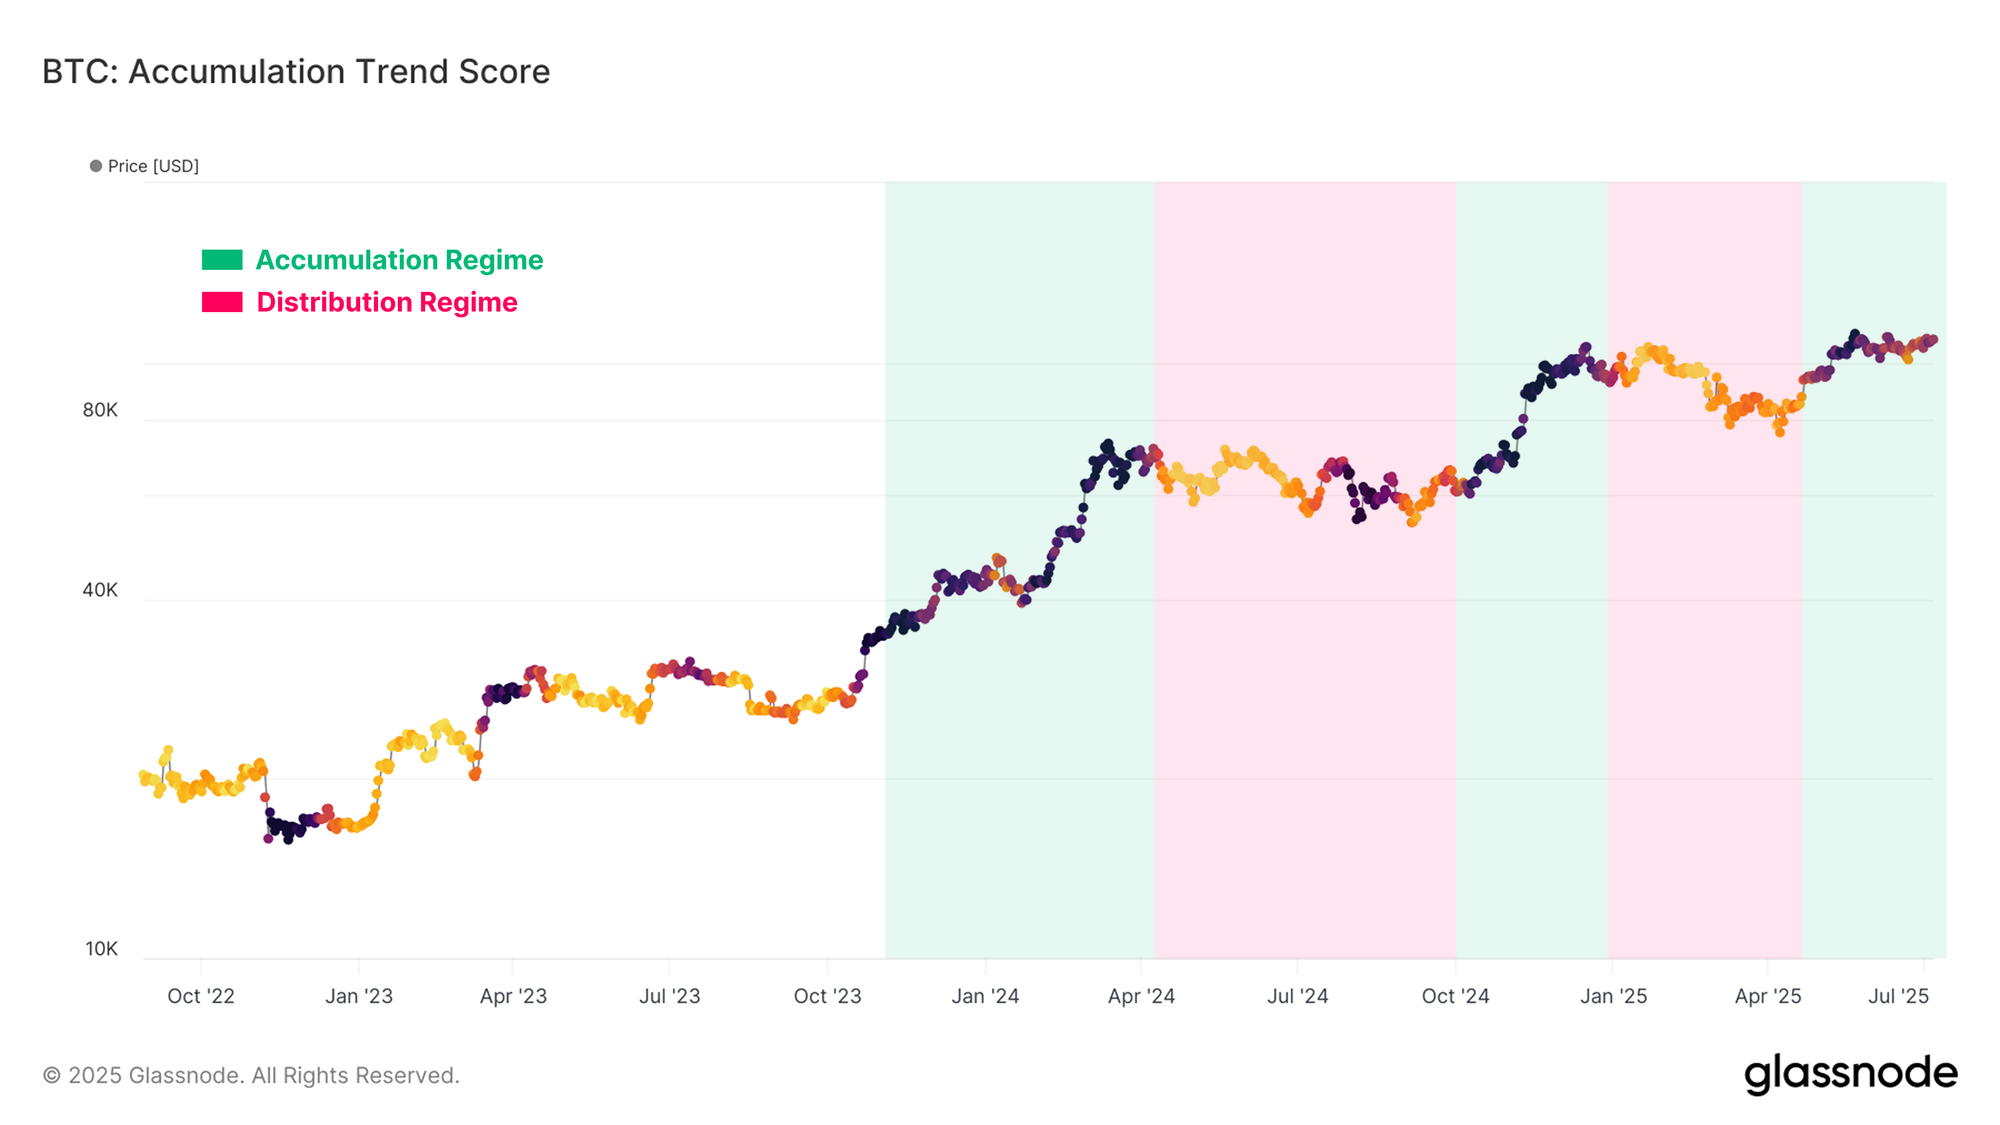
Since there is no near-term directional bias to the market, we can turn to the Accumulation Trend Score to evaluate the underlying investor behavior within the current price range. Notably, the past two months have seen Bitcoin within a moderately strong accumulation regime, suggesting that market participants view the current price as offering relatively compelling value.
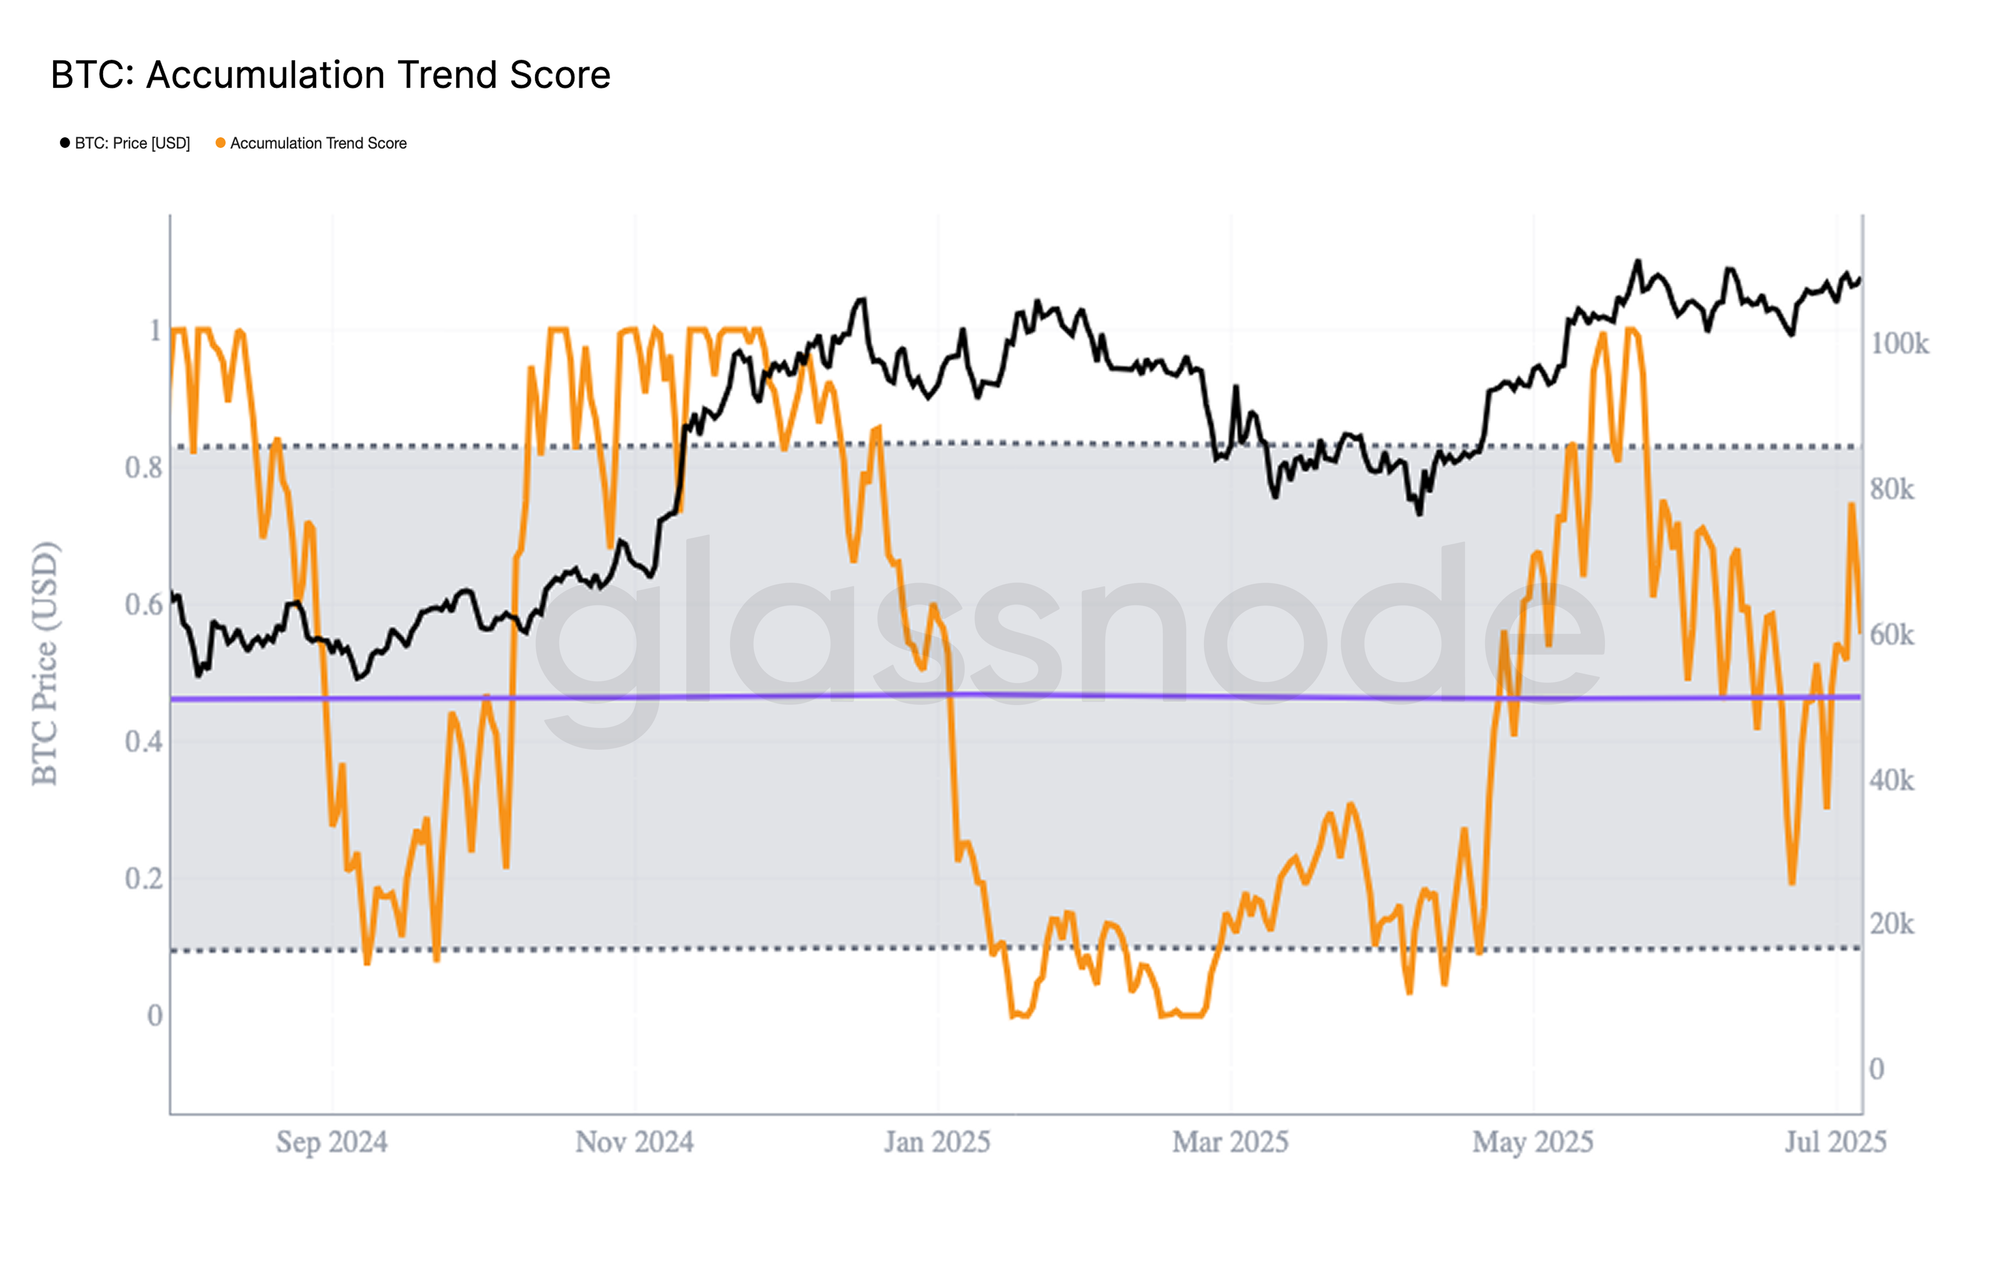
This trend is more clearly illustrated by the raw Accumulation Trend Score when plotted as a timeseries. During the initial $100K breakout, a strong wave of accumulation emerged, driving the market higher. This gradually gave way to a dominant distribution phase, and price action stalled and reversed as a result.
A comparable pattern has appeared around the most recent ATH, with renewed accumulation pressures taking hold. However, unlike the earlier cycle, accumulation has remained relatively elevated, and is trading above its historical average, even as the market trades sideways.
This suggests that investors increasingly see the current range as a more favorable environment, despite price conditions being similar to those during the previous distribution phase in late-2024.
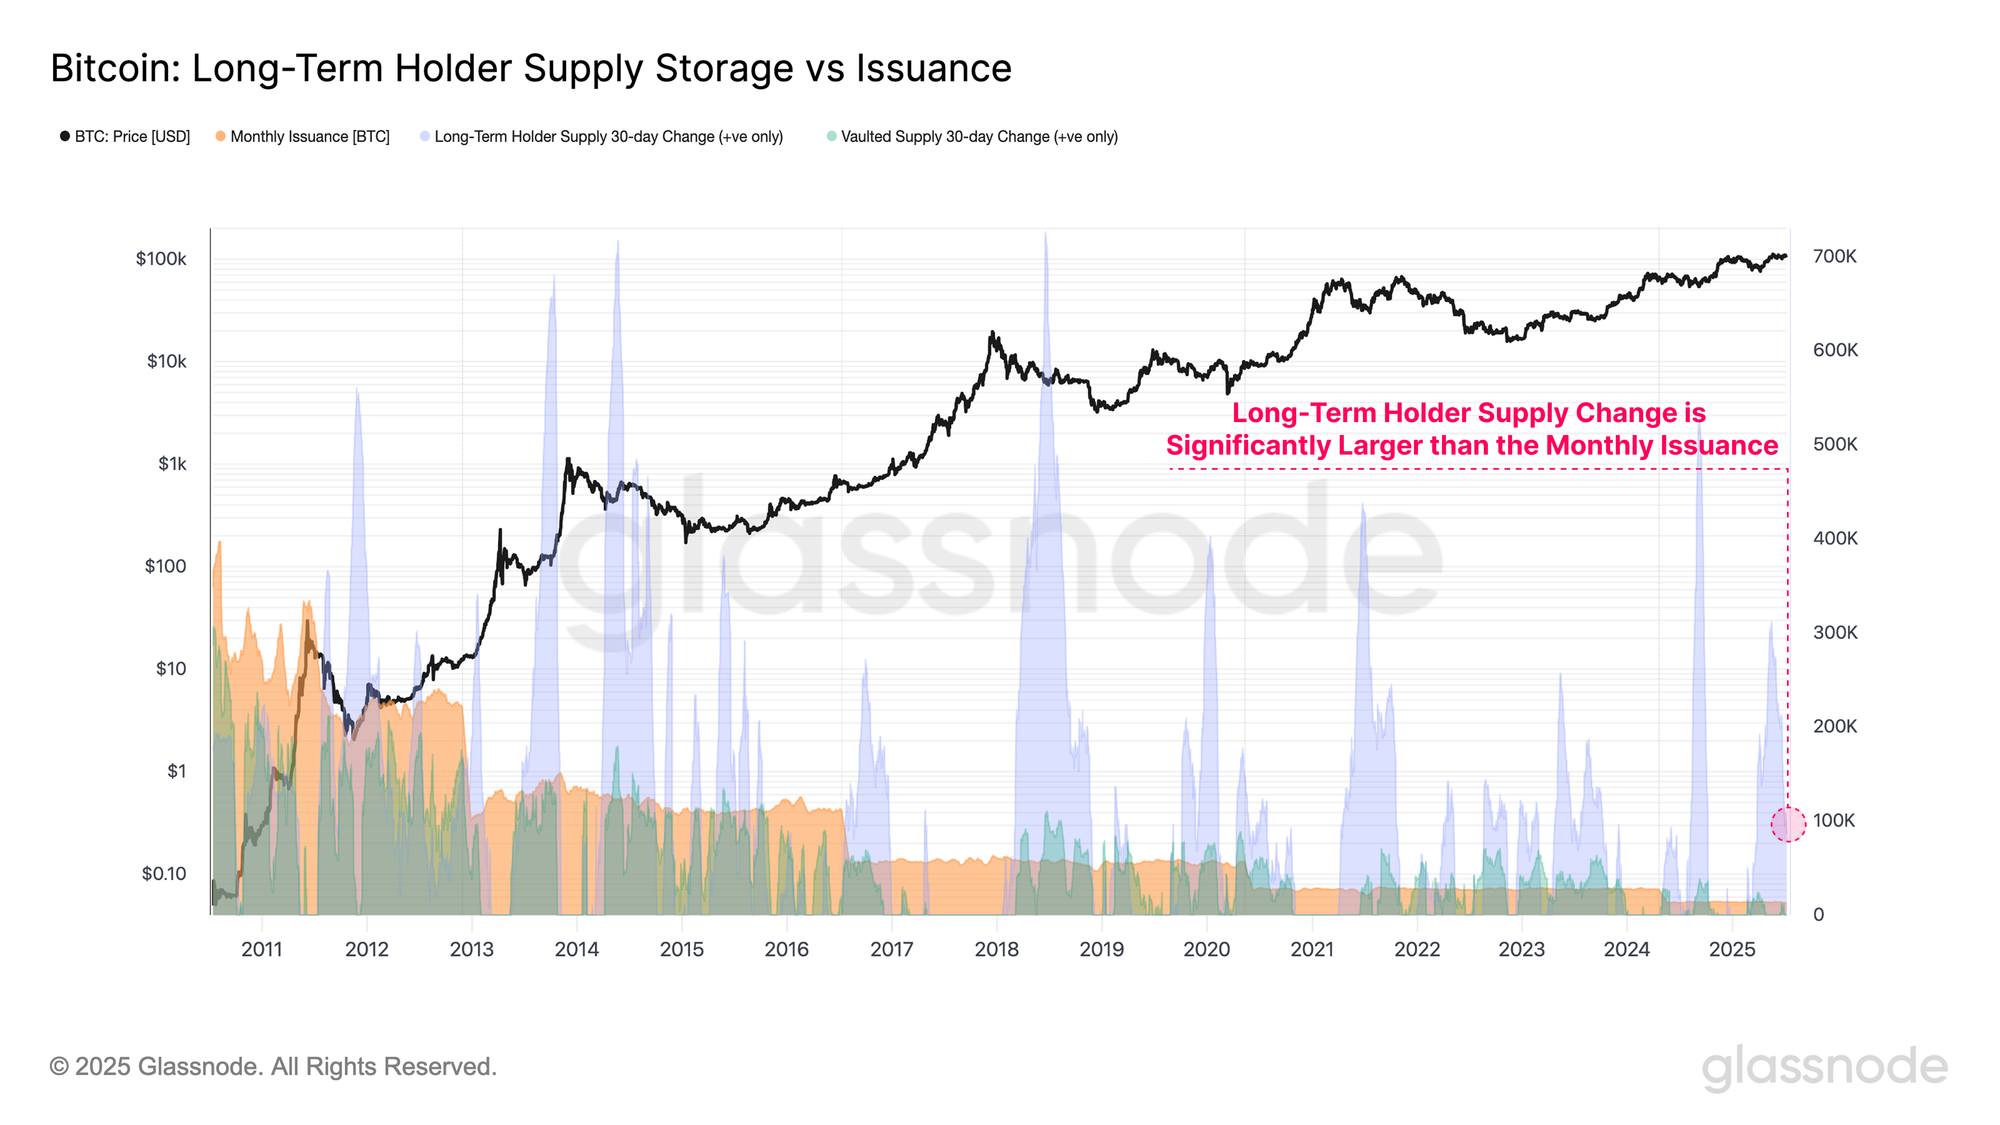
A particularly interesting example of recent accumulation behavior can be seen within the ongoing growth in Long-Term Holder (LTH) supply. When comparing the 30-day change in LTH supply to the monthly issuance rate, it becomes clear that LTH accumulation is significantly outpacing new coin issuance to miners.
This suggests a general tightening of supply, as a growing share of coins transition into LTH status, with holders displaying the characteristics of a price insensitive investor. These tenured investors appear unwilling to distribute their coins at the current spot price, and require a meaningful market move before the next wave of action unfolds.
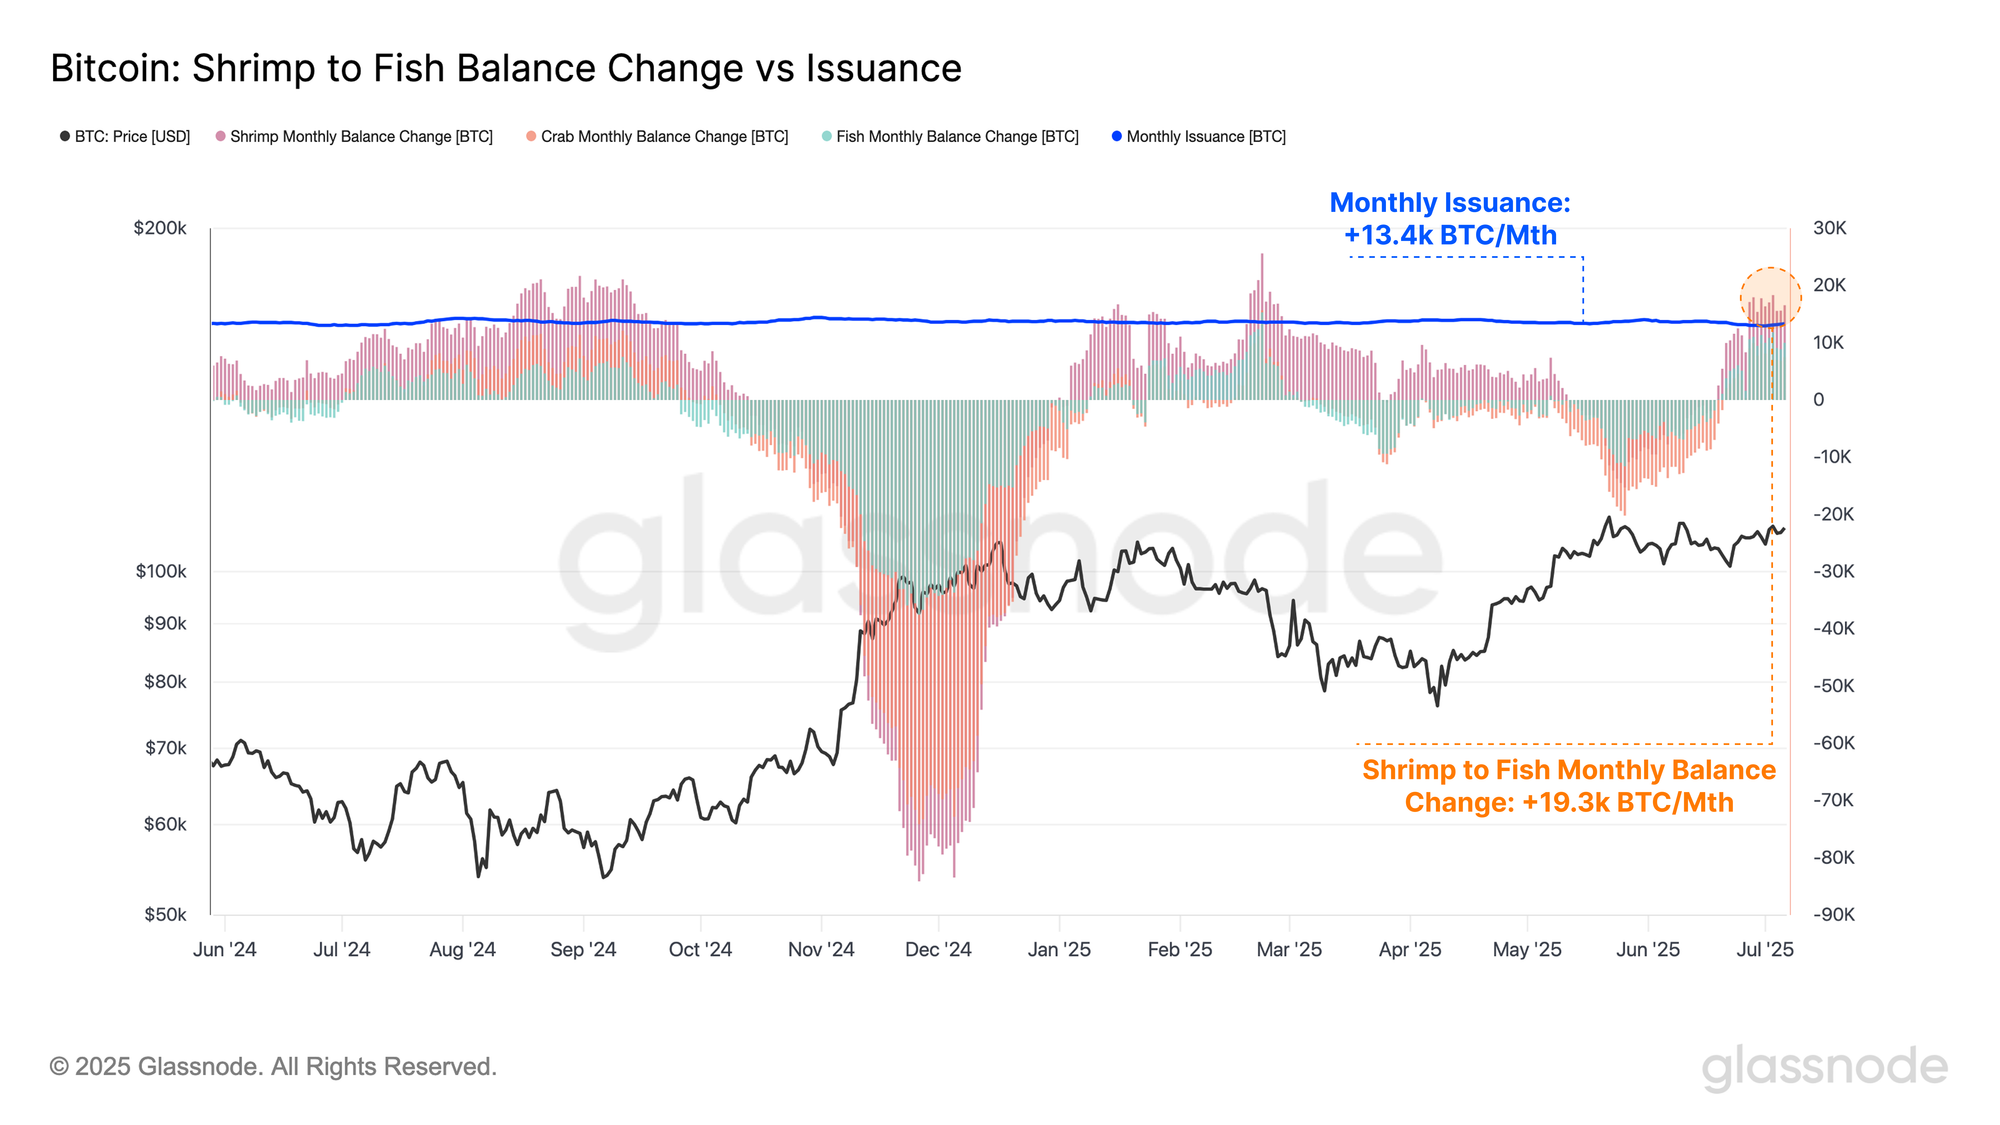
In addition, accumulation trends can also be evaluated through wallet size heuristics, with this analysis focusing on entities holding less than 100 BTC. These cohorts, commonly categorized as Shrimp (<1 BTC), Crabs (1–10 BTC), and Fish (10–100 BTC), represent a broad spectrum of investors, ranging from retail participants to high-net-worth individuals.
Currently, the combined balance growth across these groups is increasing at a pace of +19.3k BTC/month, overwhelming the current monthly issuance rate of +13.4k BTC/month. This adds another layer of evidence supporting the view that supply-side conditions are tightening, as a wide base of holders continues to absorb newly issued supply.
Volatility Expectations Continue to Compress
With a range of metrics indicating an ongoing tightening of the supply side, the market becomes increasingly susceptible to demand shocks, where even modest fluctuations can induce significant price volatility. To evaluate the potential for such volatility, we turn our attention to a suite of volatility indicators.
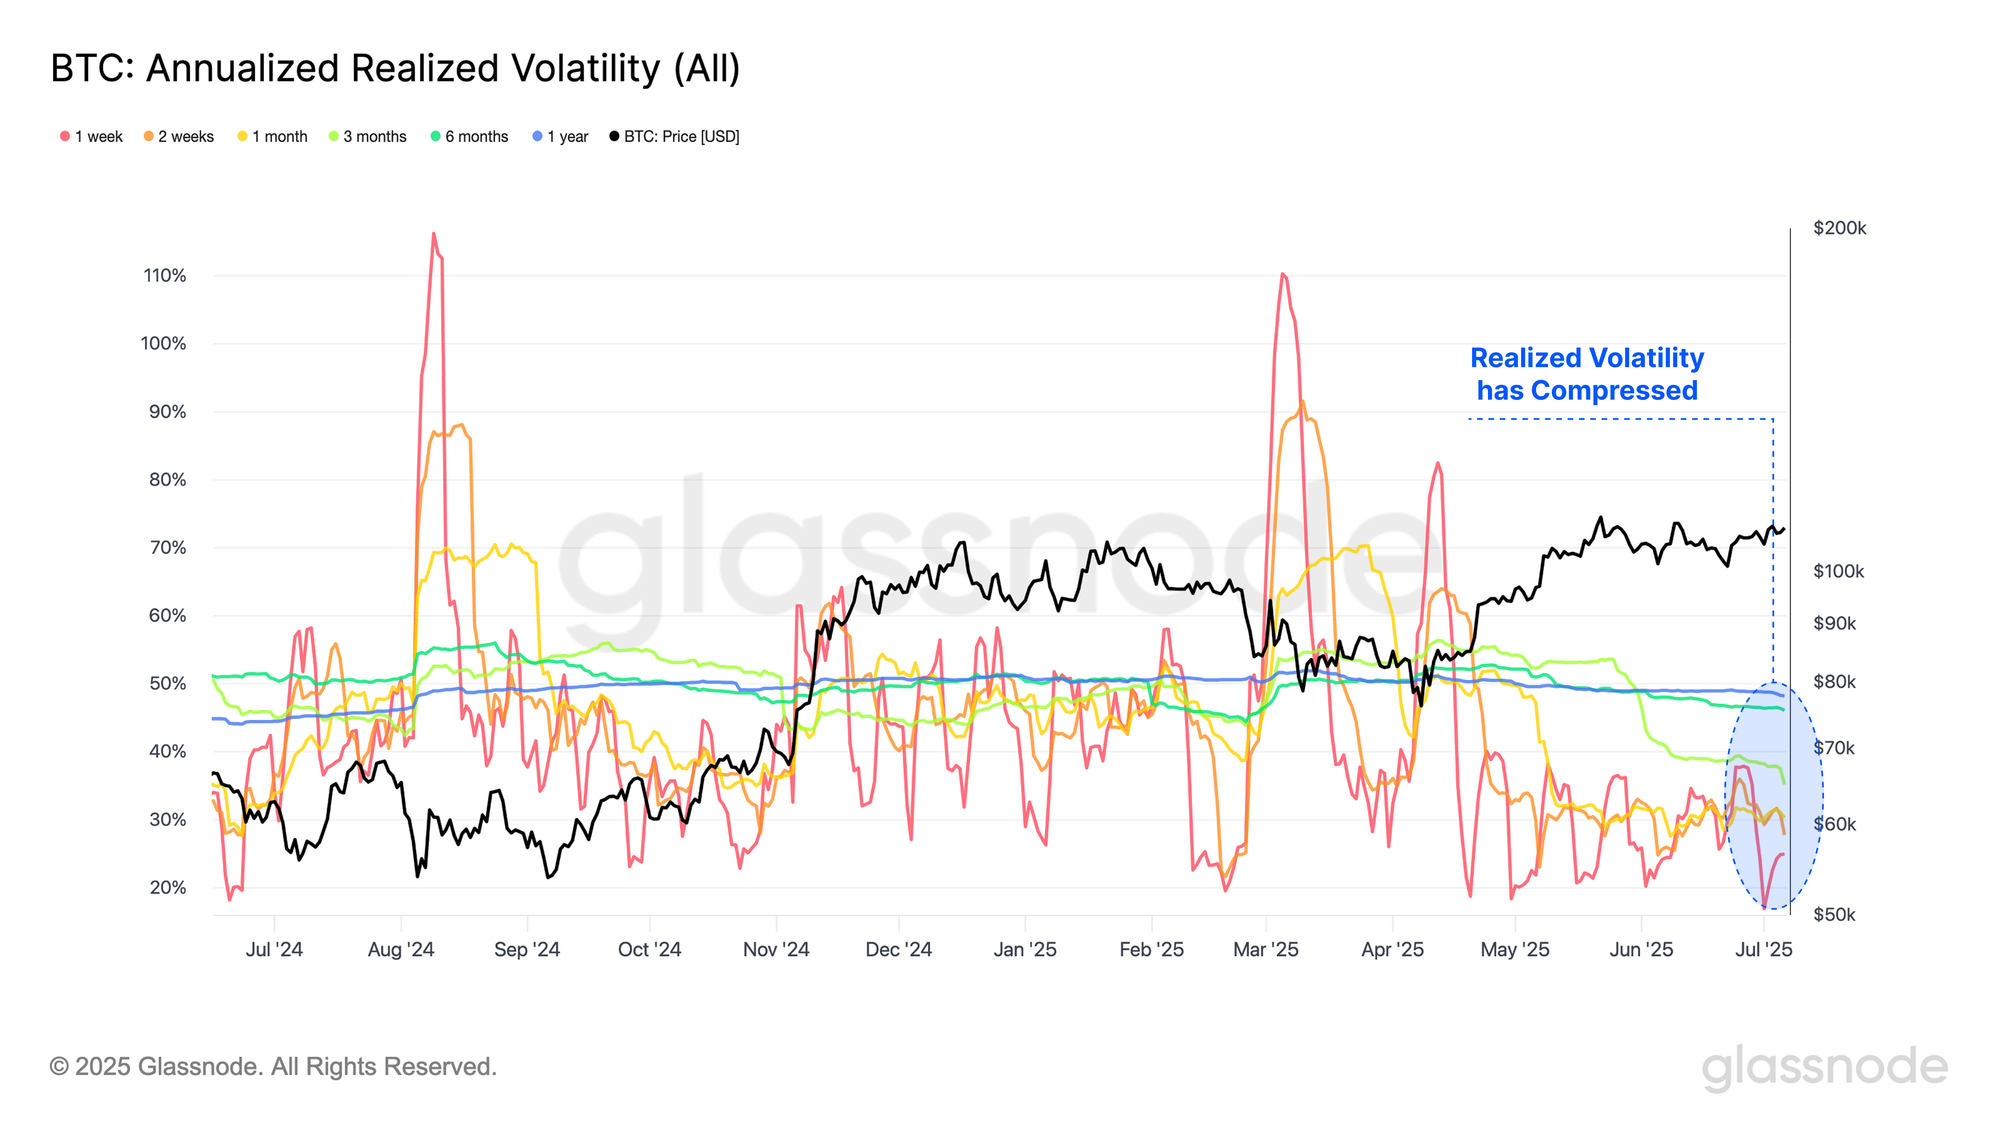
Starting with Realized Volatility measured across multiple time-frames, we observe a prolonged contraction in volatility over recent weeks, as Bitcoin continues to coil within a narrow consolidation range. Historically, such volatility compressions have preceded significant market moves, and served as early indicators of an impending phase of heightened volatility.
Below are the number of trading days since December 2022 where Realized Volatility for each respective timeframe has recorded a higher value than its current level:
- 1-Week Realized Volatility: 796/951 (84%)
- 1-Month Realized Volatility: 856/951 (89%)
- 3-Months Realized Volatility: 914/951 (96%)
- 6-Months Realized Volatility: 732/951 (77%)
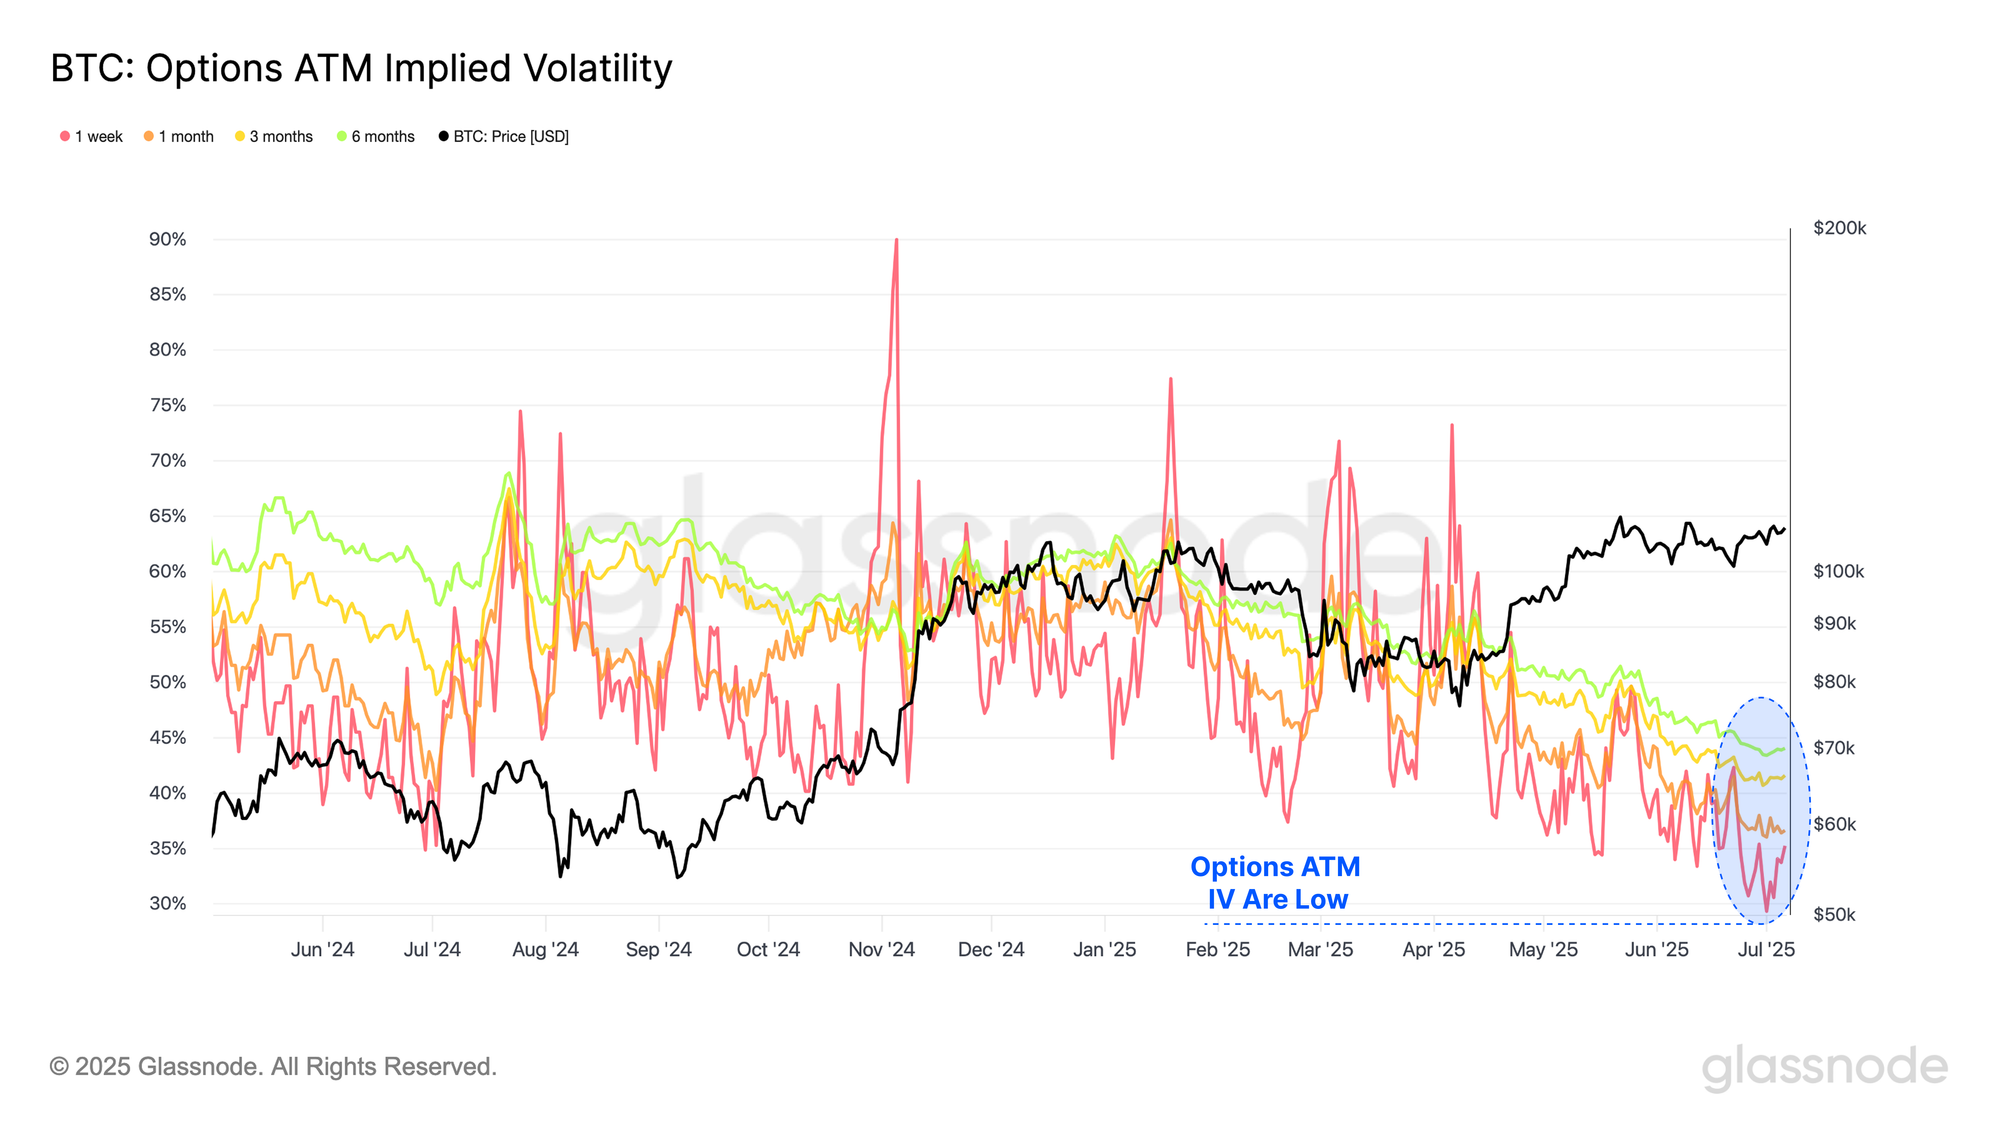
Additionally, At-the-Money Implied Volatility (ATM IV) for options markets are also declining over recent weeks, indicating that options traders are not pricing in a shift toward a high-volatility regime. Historically, subdued volatility expectations like these have often preceded sharp market moves, acting as a contrarian signal.
Below are the number of trading days since December 2022 where Implied Volatility for each respective timeframe has recorded a higher value than its current level:
- 1-Week ATM Percentile 845 / 951 (88.9%)
- 1-Month ATM Percentile 853 / 951 (89.7%)
- 3-Months ATM Percentile 837 / 951 (88%)
- 6-Months ATH Percentile 888 / 951 (93.4%)
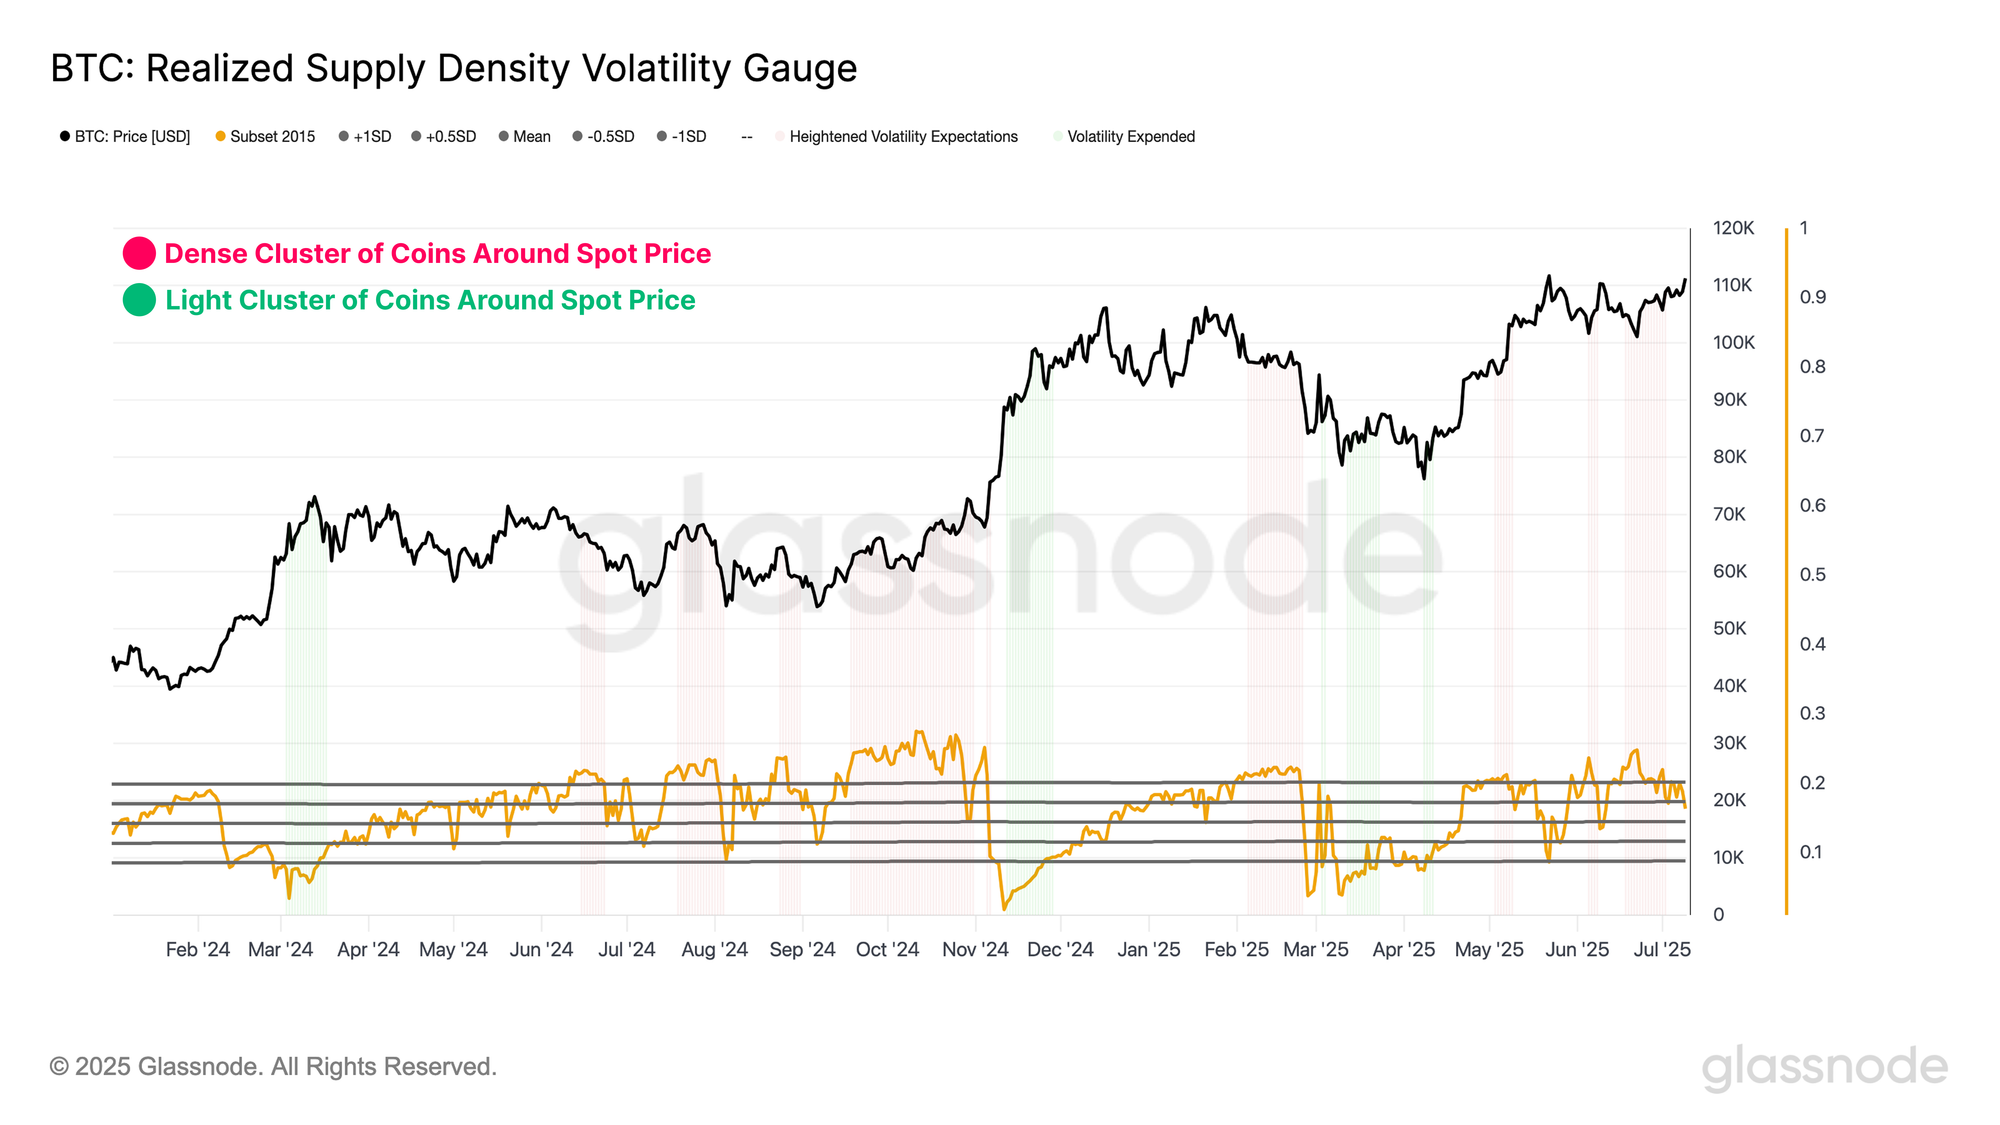
From an on-chain perspective, the Realized Supply Density metric offers insight into how much of the circulating supply is concentrated within a ±10% band of the current spot price. When supply is heavily clustered around the current price, even modest market moves can sharply shift investor profitability, thereby amplifying volatility.
At present, approximately 19% of the circulating supply is positioned within this ±10% range, indicating a substantial concentration of cost basis near the current price. This configuration implies that a large portion of the market is sensitive to short-term price fluctuations, increasing the likelihood of reactive behavior when the market finally breaks away from this price zone.
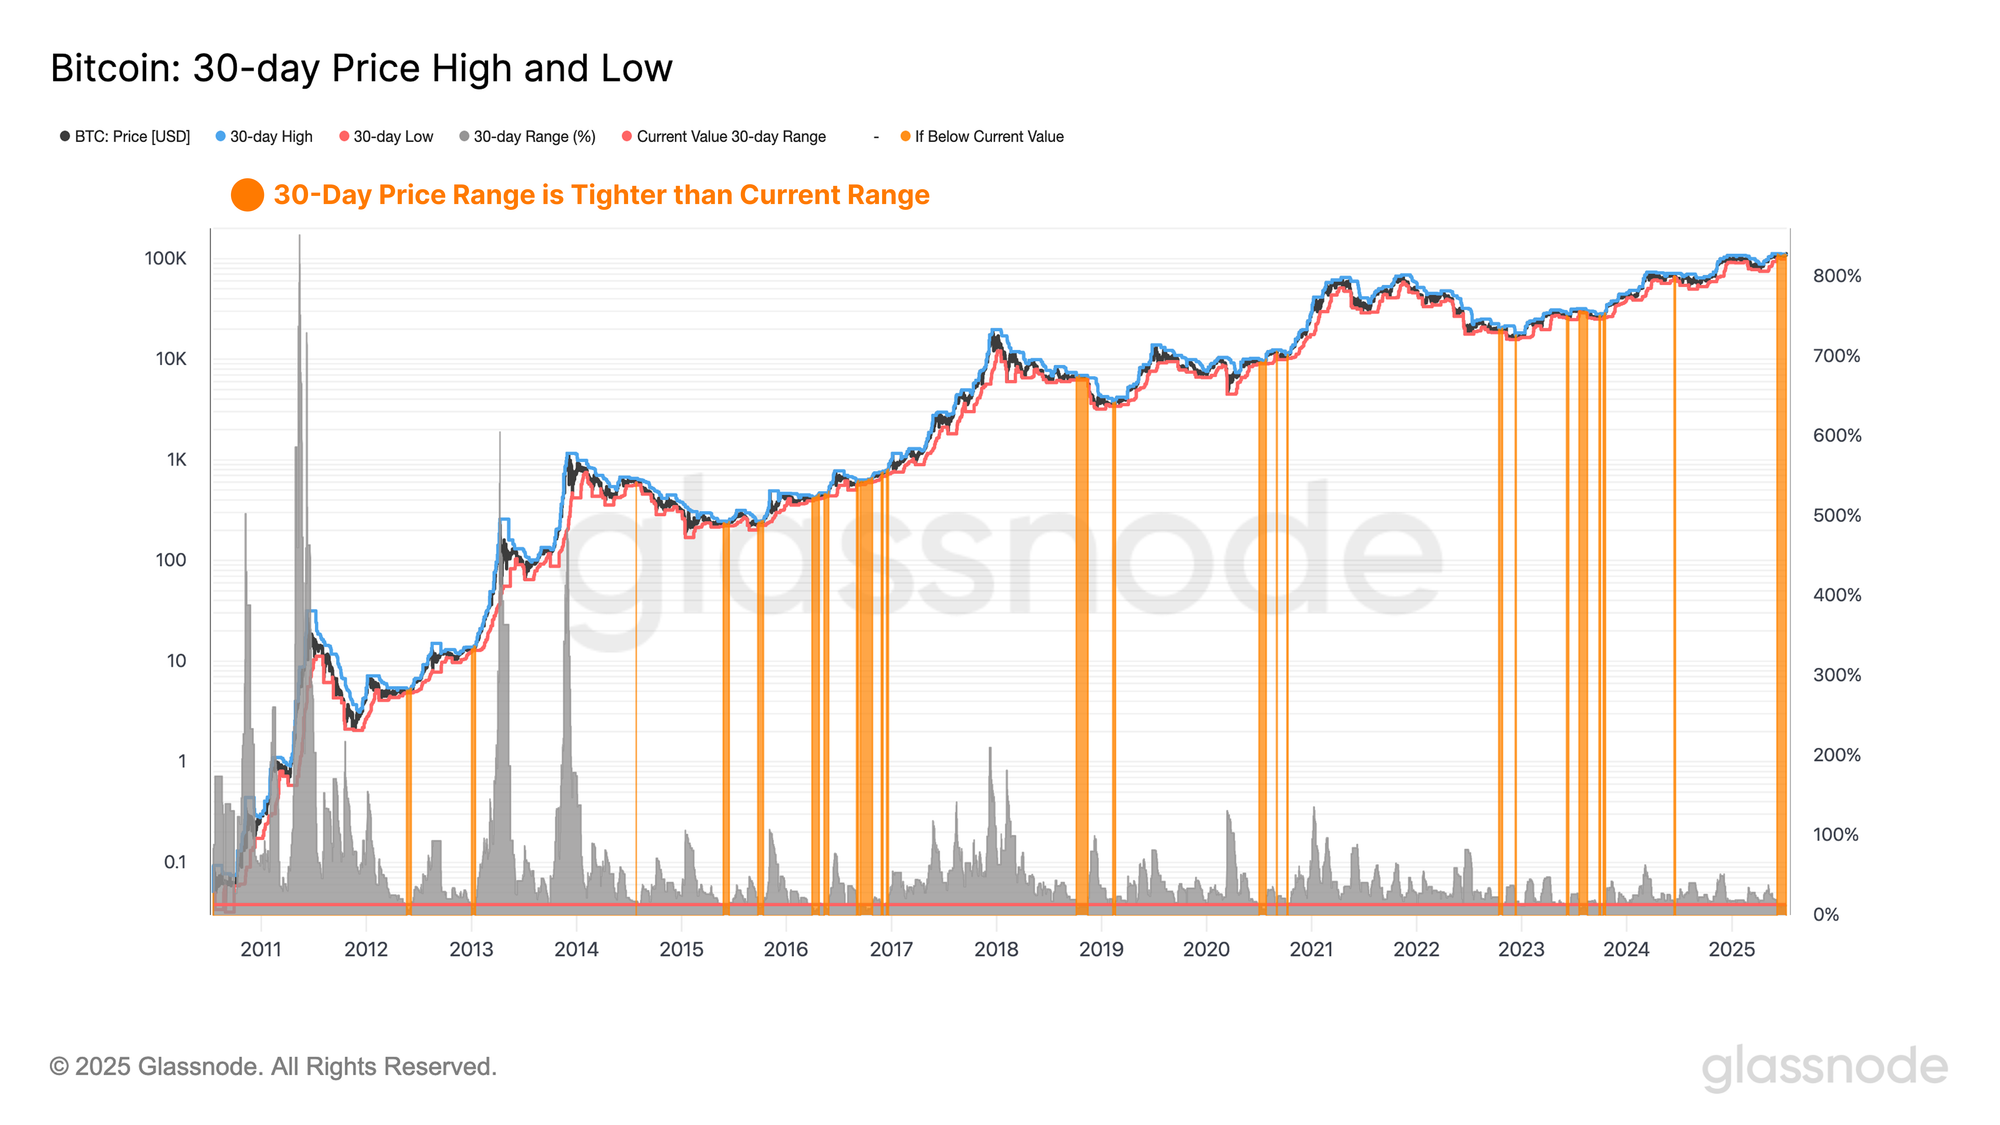
We can also assess volatility expectations through the lens of pure price action by calculating the percentage range between the highest and lowest price ticks over the last 30 days. This allows us to quantify the degree of price compression observed in the market.
Notably, only 6% of trading days have recorded a tighter 30-day range than the current one, underscoring the exceptional degree of volatility compression presently occurring in the spot market.
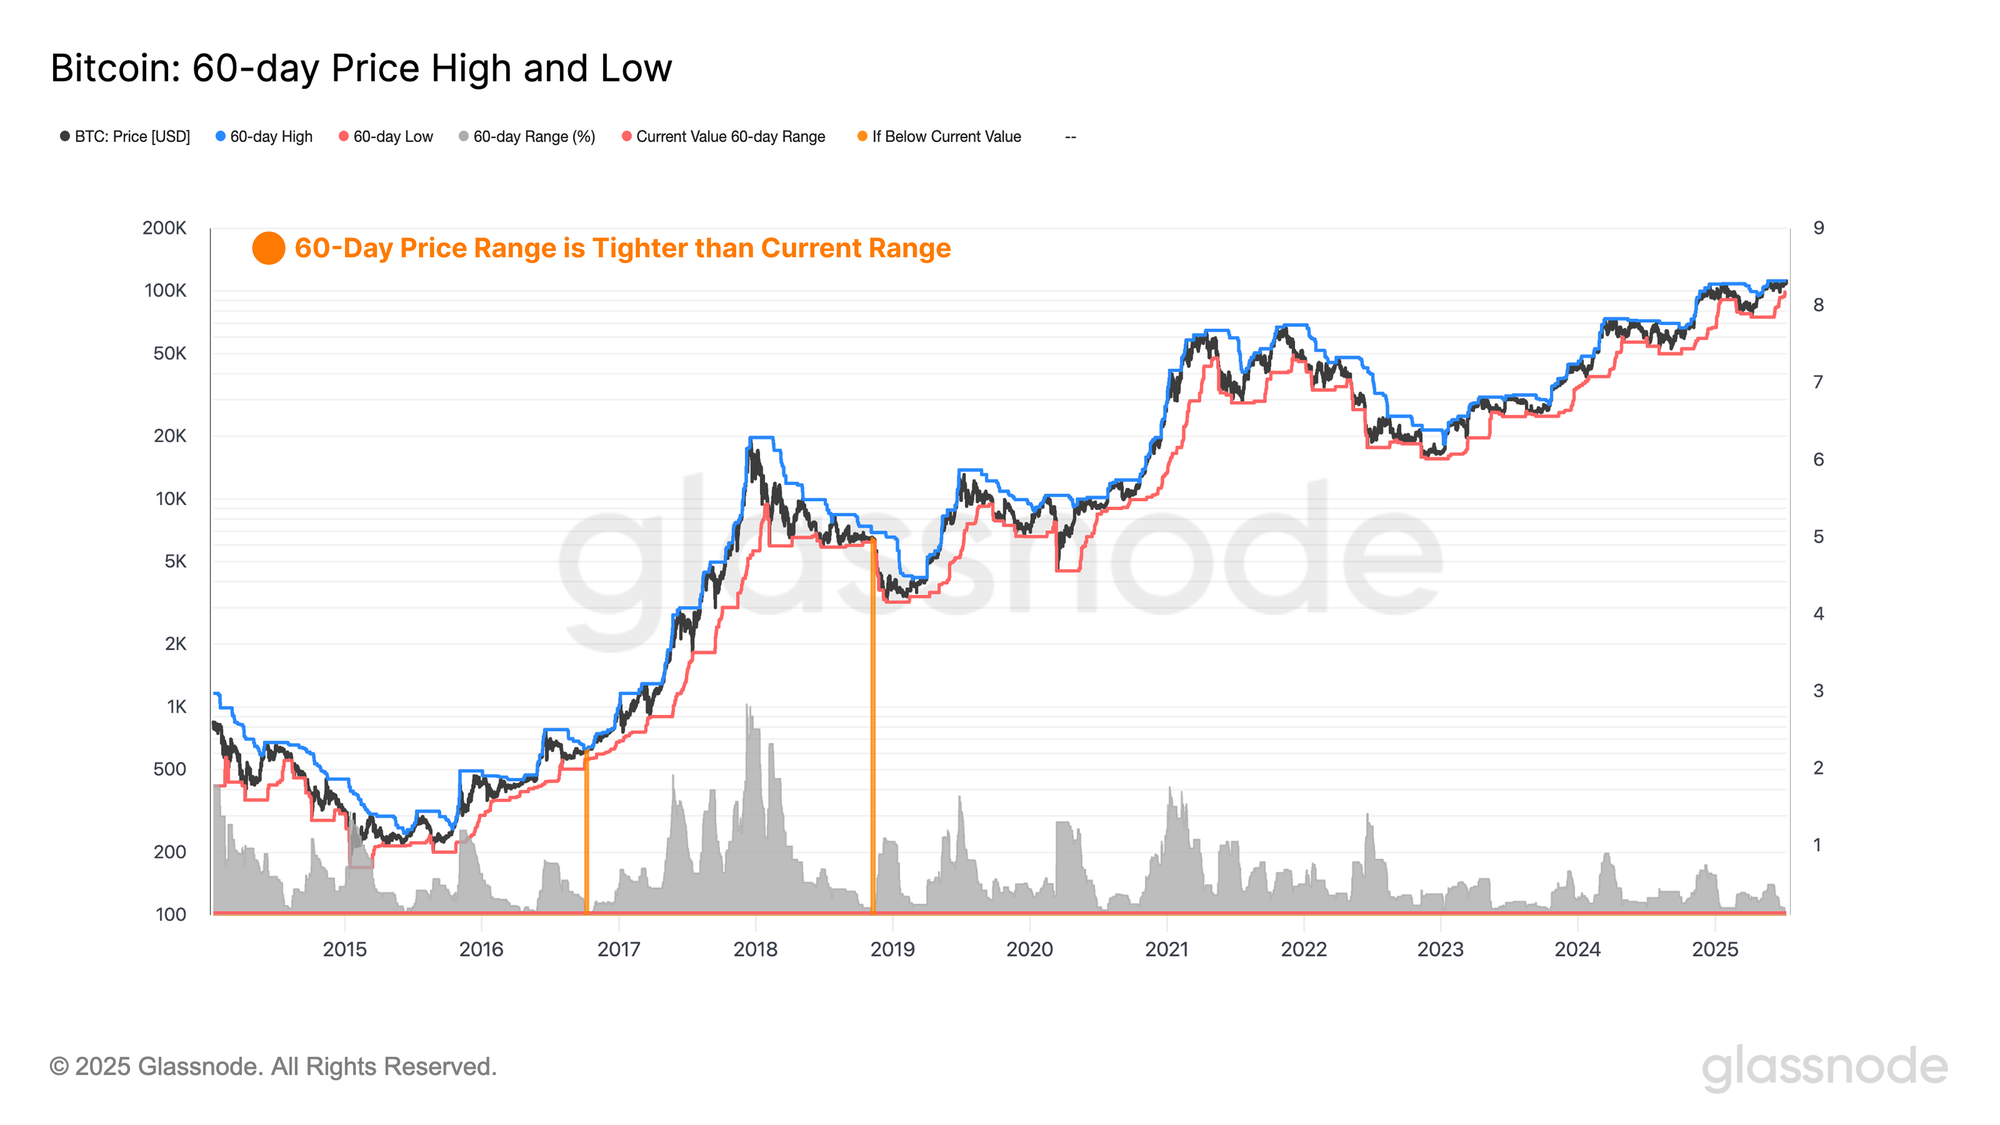
Furthermore, we can bolster the above observation by assessing price compression over a 60-day window. When analyzing this bi-monthly timeframe, we find that price consolidation is even more pronounced, with only 0.4% of trading days exhibiting a tighter range.
The confluence across both the 30-day and 60-day measures suggests that volatility is not only compressing over short-term horizons but is also tightening across broader timeframes. This multi-scale compression indicates a market coiling with increasing intensity, where the longer the period of consolidation persists, the greater the potential energy stored within the price structure.
As a result, the magnitude of the subsequent breakout (or break-down) is likely supported by a major expansion in volatility, with heightened potential for a sharp directional move.
ETF AUM Reaches ATH
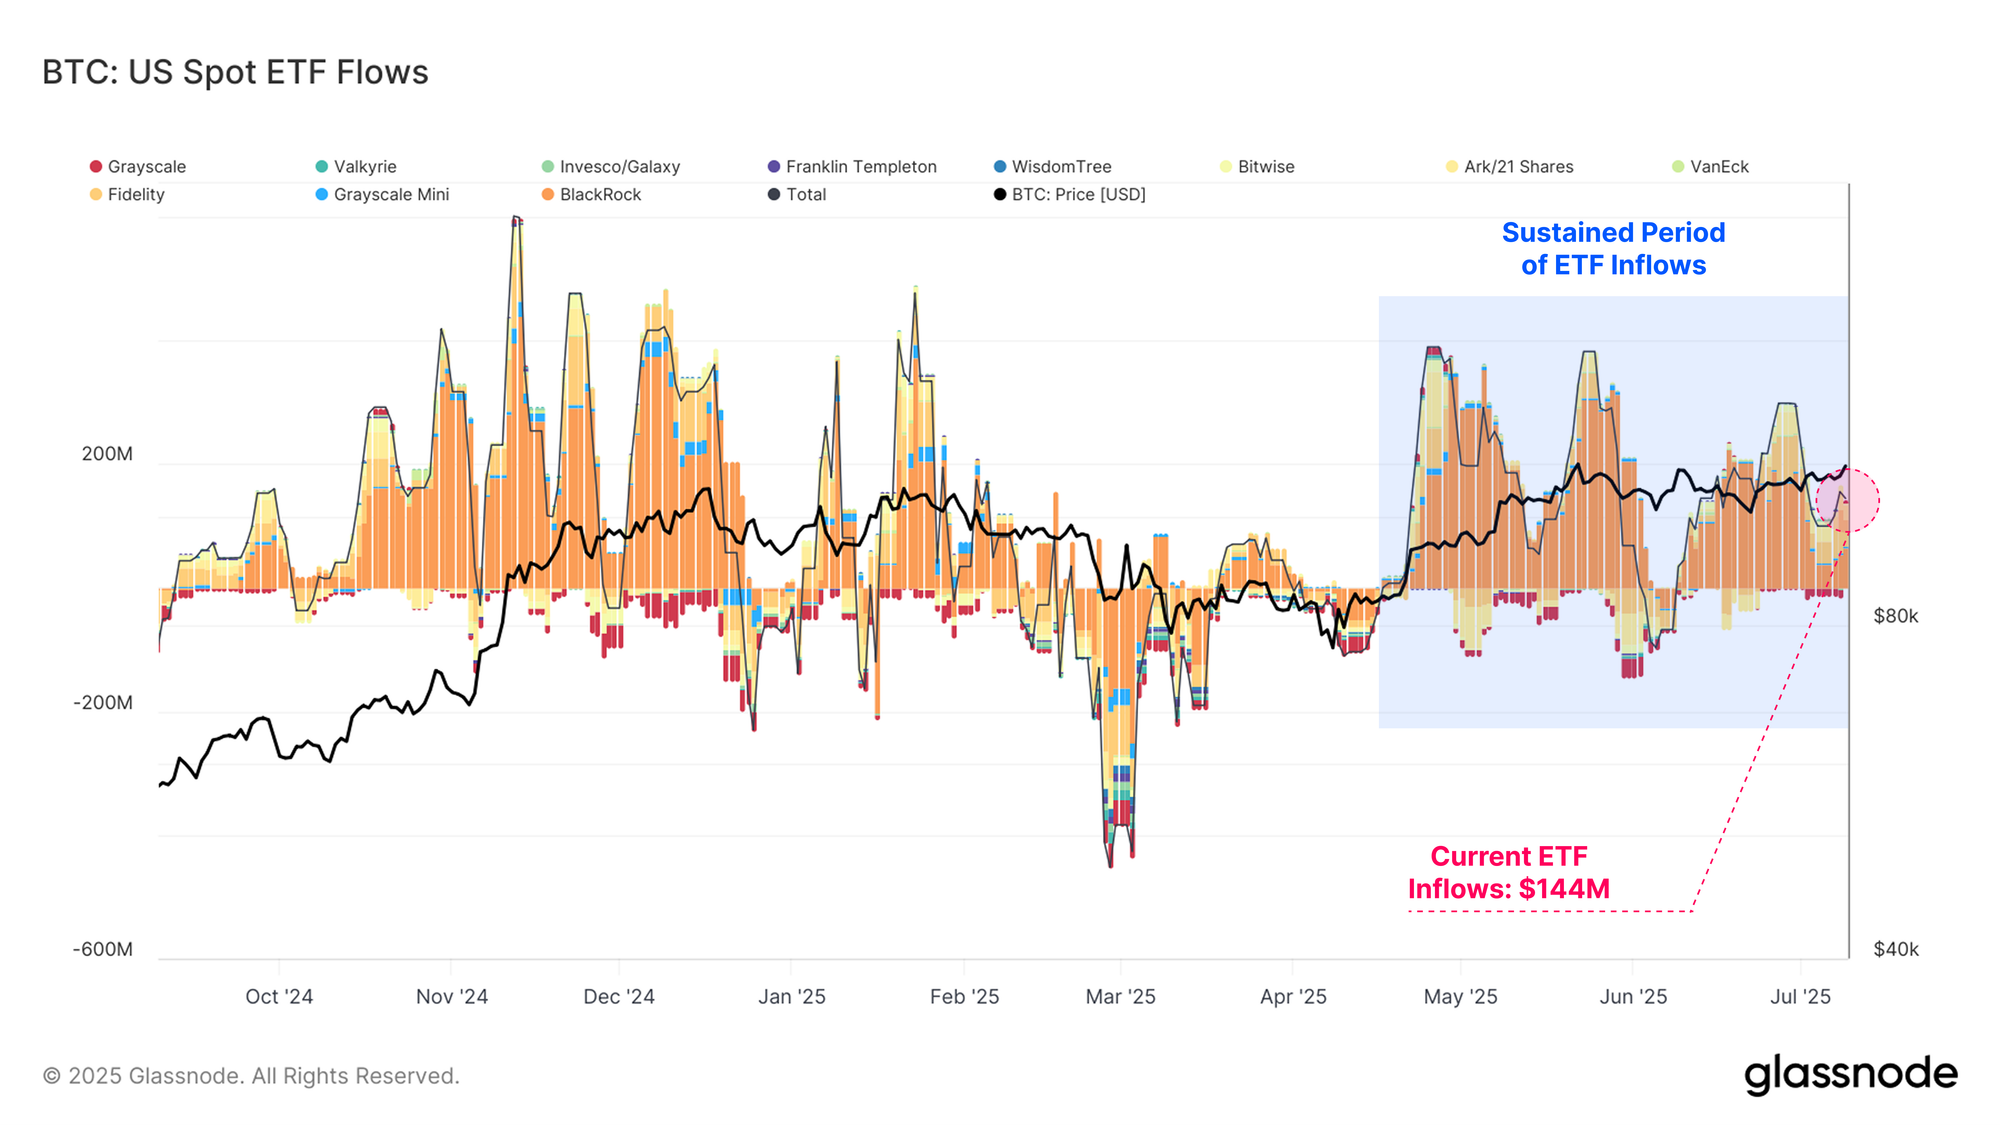
Inflows into U.S. Spot Bitcoin ETFs remain a significant source of demand for Bitcoin. However, aggregate net inflows across the ETF complex have moderated over the past week, declining to just +$144M.
Despite this near-term slowdown, the broader trend remains constructive. When viewed over a multi-month horizon, buy-side pressure has been both sustained and sizeable, underscoring the continued growth of institutional engagement.
While net inflows have cooled in recent days, the total AUM across all U.S. Spot Bitcoin ETFs has surged to a new all-time high of $137B. This milestone reflects the depth and resilience of institutional demand for regulated Bitcoin access.
In fact, the aggregate size of the ETF complex now positions it among the top 10 largest ETF categories by AUM, solidifying Bitcoin’s presence within the upper echelon of global investment vehicles.
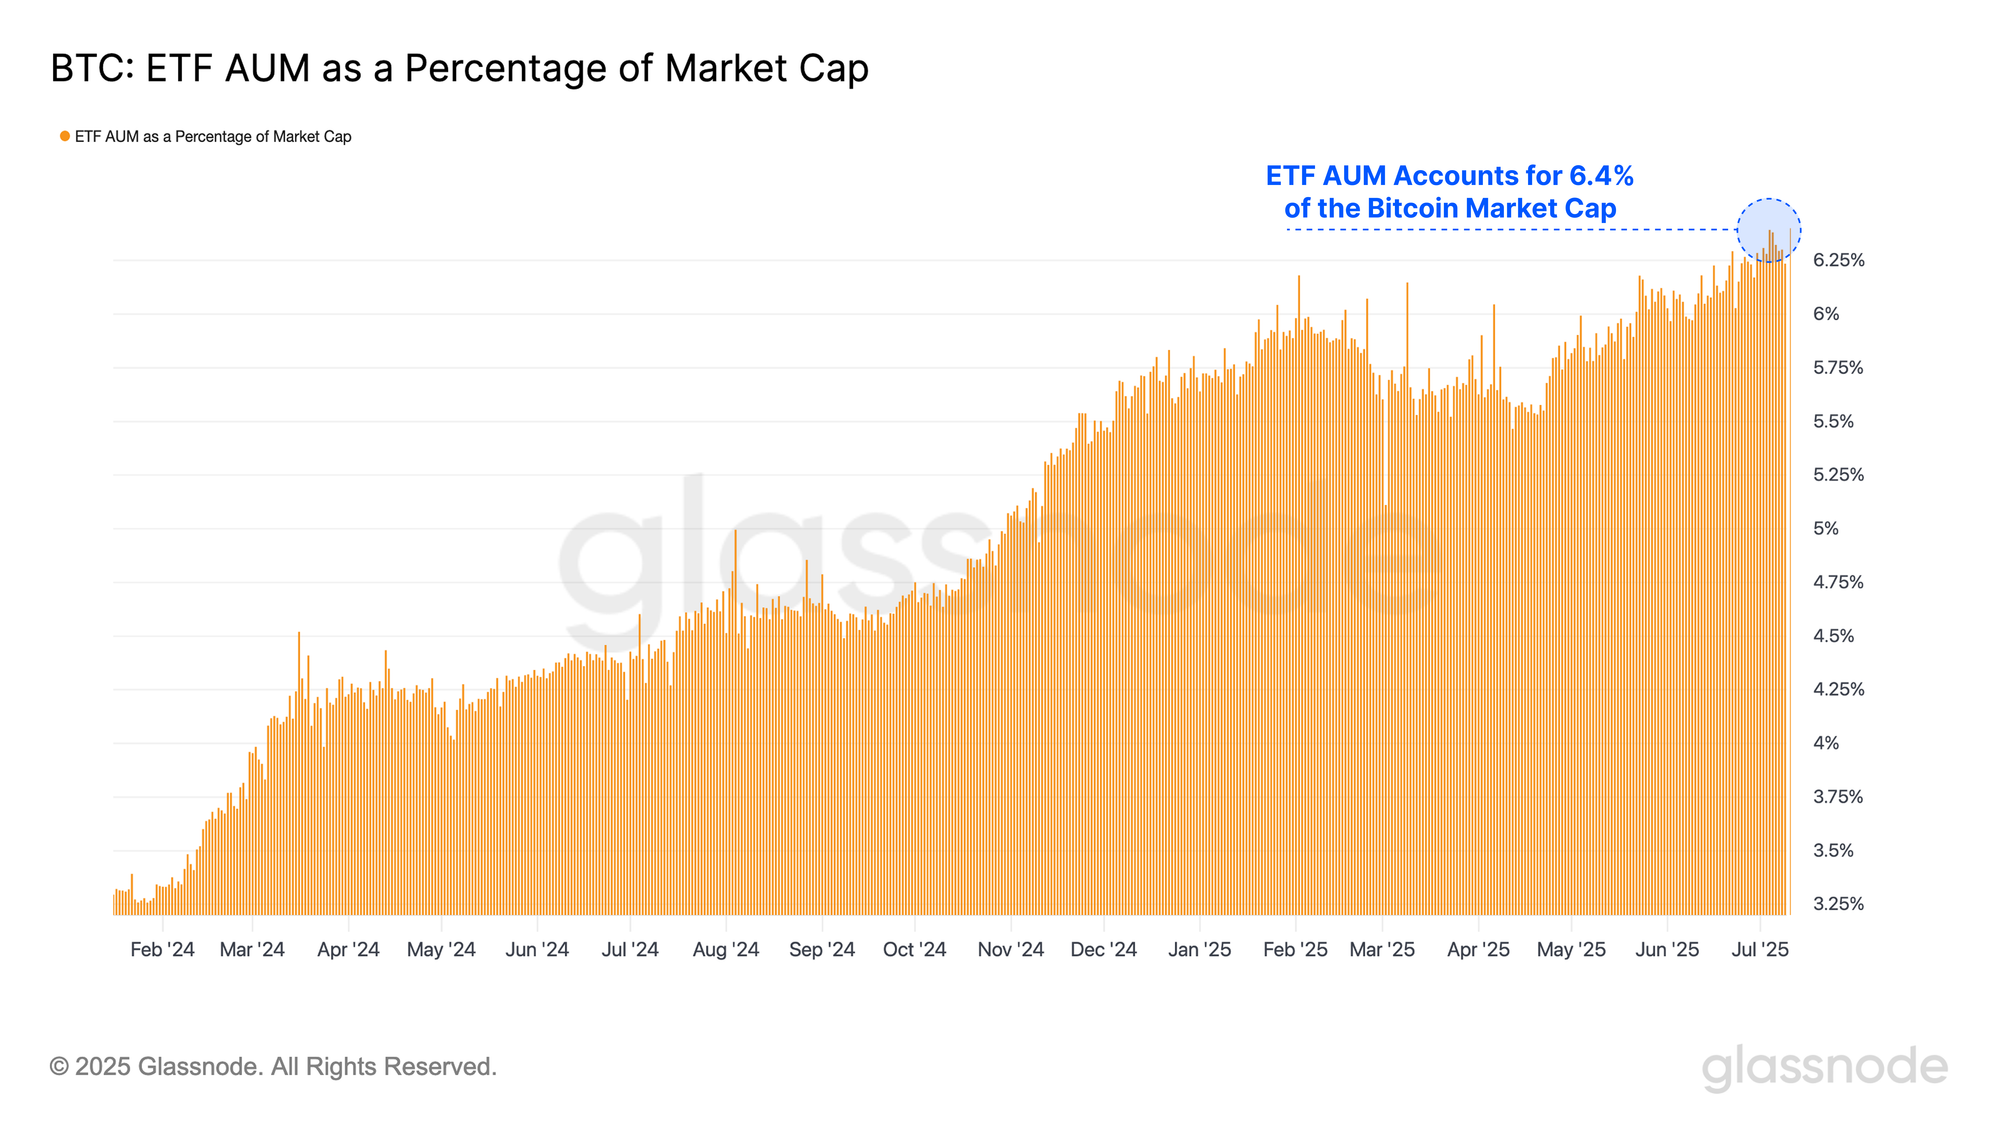
Furthermore, the total AUM of U.S. Spot Bitcoin ETFs now represents 6.4% of Bitcoin’s total market capitalization, marking a new all-time high for ETF ownership. This rising share highlights that a steadily increasing portion of the supply is being absorbed through regulated, professionally managed investment vehicles, as the asset continues to integrate with traditional financial infrastructure.
When increasing our granularity into the ETF complex, we can observe that Blackrock’s IBIT ETF continues to acquire an increasing percentage of market share, reaching an ATH of 55% of the total AUM. Following IBIT, Fidelity and Grayscale rank as the second and third largest ETFs by assets under management, holding 16.2% and 14.7% of the market share, respectively.
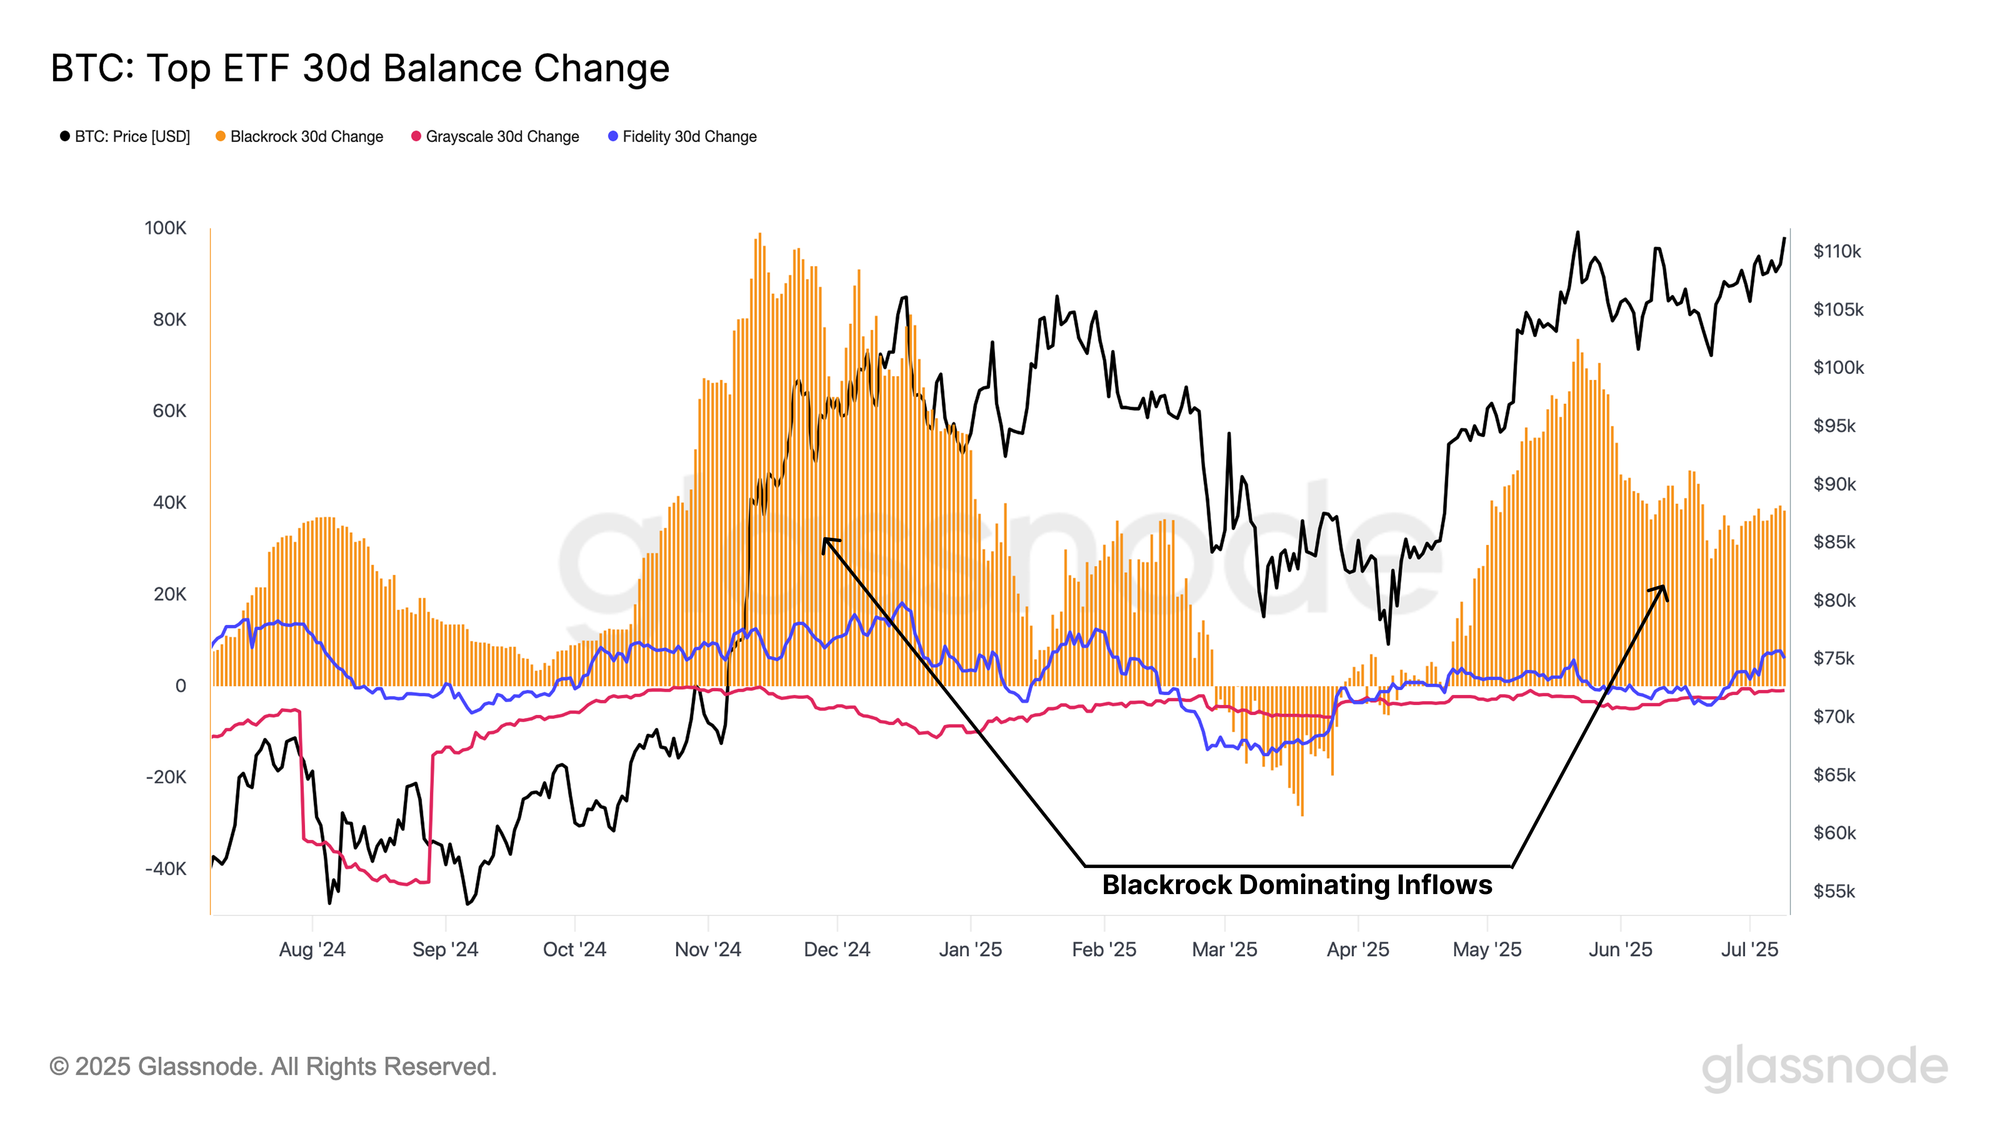
However, when evaluating the 30-day balance change across the three leading ETFs, BlackRock has consistently attracted a significant share of inflows throughout 2025, while both Fidelity and Grayscale have shown signs of stagnation in recent months.
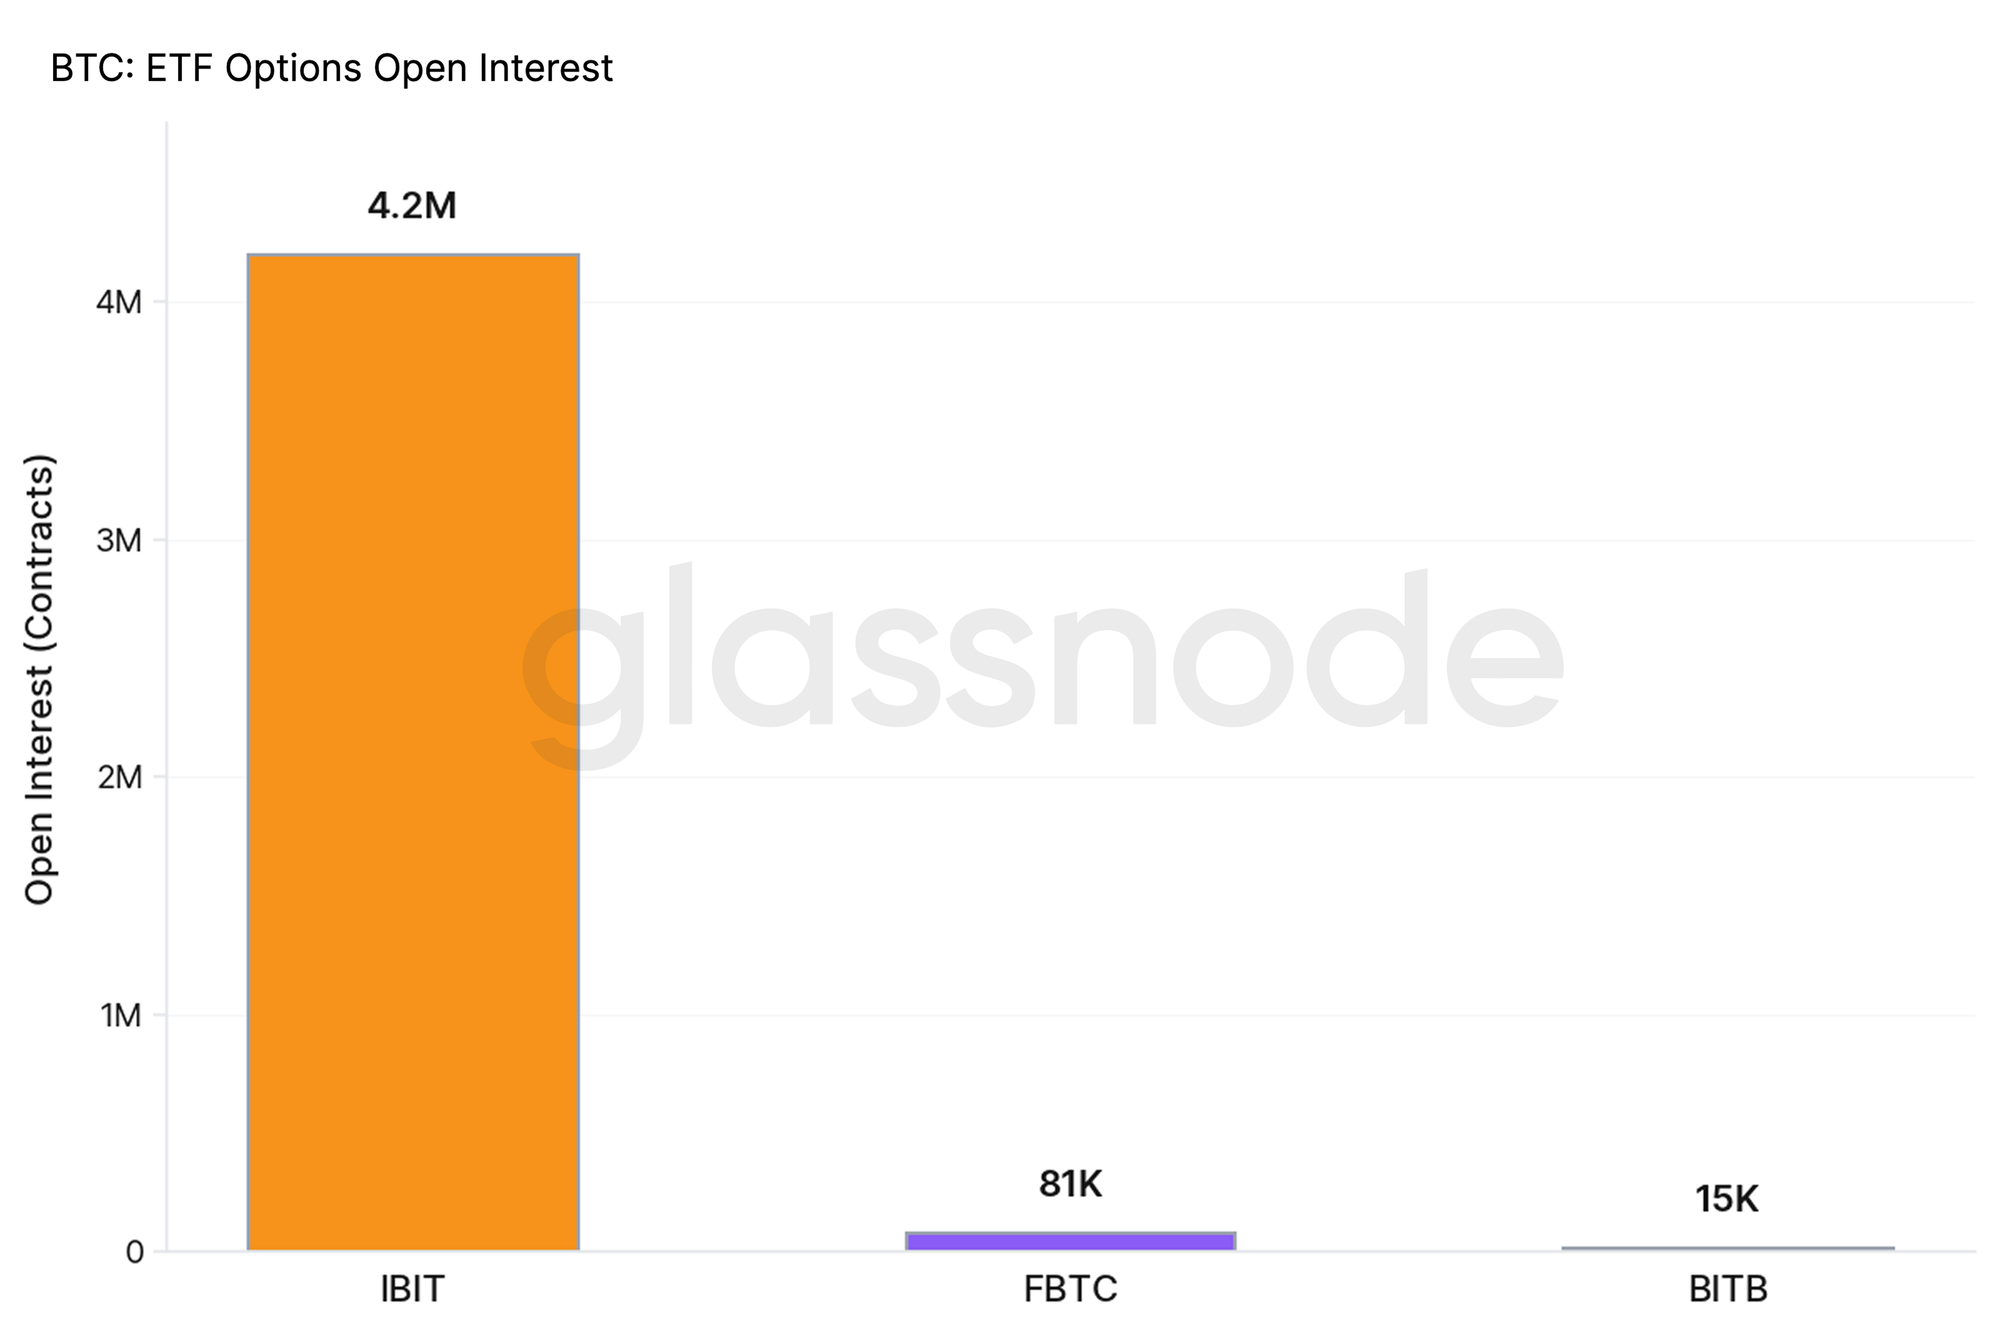
One likely reason for BlackRock’s surging dominance in 2025 is its overwhelming lead in the options market. IBIT currently accounts for ~97% of total open interest across Bitcoin ETF options, and is orders of magnitudes ahead of its peers:
- IBIT: 4.2M contracts
- FBTC: 81K contracts
- BITB: 15K contracts
IBIT’s leadership is driven by a self-reinforcing liquidity loop. Its large AUM and trading volumes attract market makers who offer tighter bid-ask spreads and lowers execution costs. This improves trading conditions and draws increased participation from both institutional and retail investors, further amplifying volume and open interest.
As a result, IBIT has become the default venue for Bitcoin options strategies, making it increasingly difficult for smaller ETFs with wider spreads and thinner liquidity to gain ground.
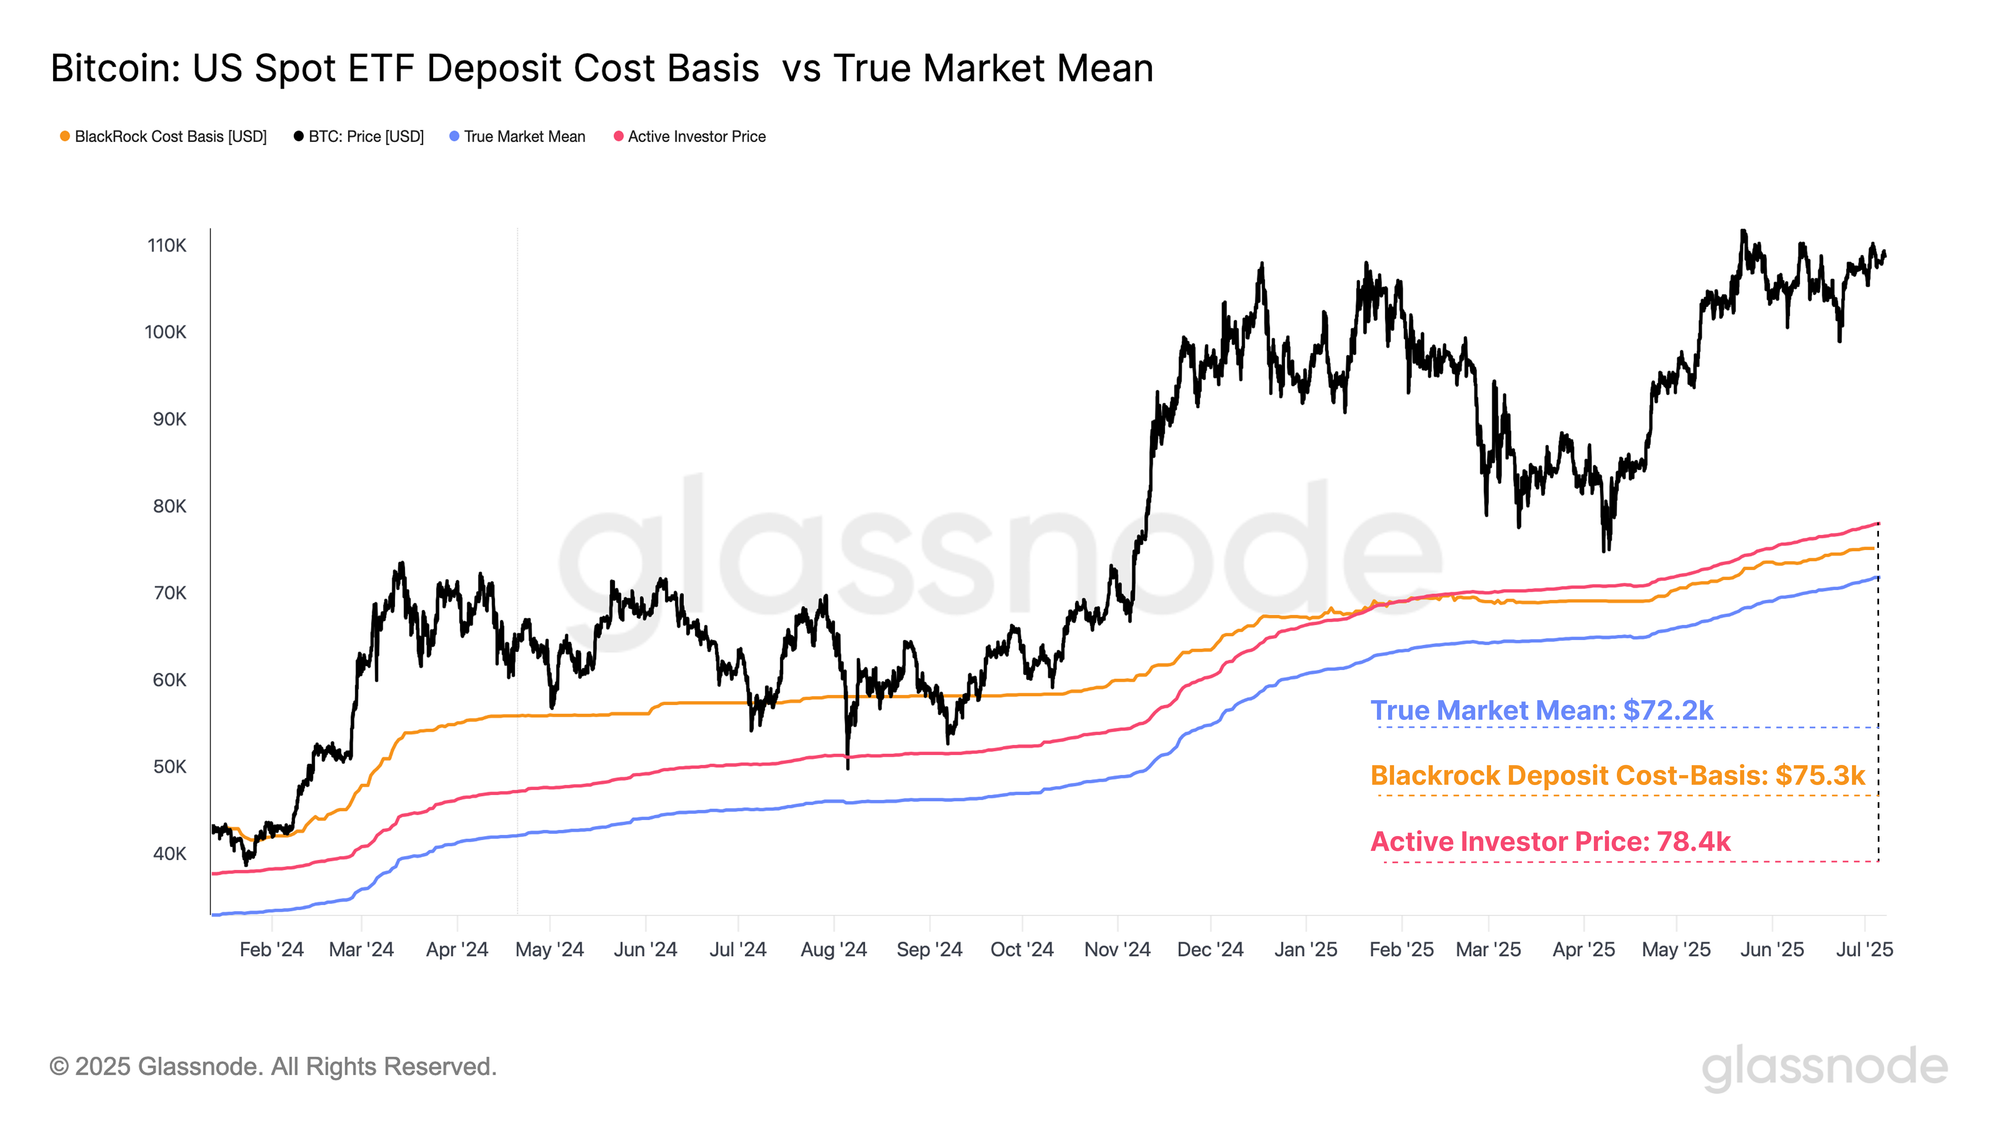
With BlackRock’s U.S Spot Bitcoin ETF gaining market share and dominating the options open interest landscape, its deposit cost basis has become the most representative of broader market positioning.
When overlaying the BlackRock Deposit Cost Basis with the True Market Mean and the Active Investor Price (both models designed to estimate the average cost basis of investors actively participating in the current cycle), we can observe a striking similarity among these cost-bases.
- Blackrock Deposit Cost-Basis: $75.3k
- True Market Mean: $72.2k
- Active Investor Cost-Basis: $78.4k
The True Market Mean and Active Investor Price are both key psychological and statistical valuation anchors, thus, the close alignment of BlackRock’s ETF Deposit Cost-Basis with these models underscores the growing influence of ETF flows within the Bitcoin market. As ETFs become more embedded in the Bitcoin ecosystem, its cost-basis is increasingly converging with that of the average investor, further reinforcing its influence on market psychology and price discovery.
Summary and Conclusions
The Bitcoin market continues to show signs of accumulation, with Long-Term Holder supply climbing to new highs. Additionally, smaller investor cohorts, ranging from Shrimps to Fish, are collectively acquiring over 19.3k BTC/Month, significantly outpacing the monthly issuance of 13.4k BTC. This dynamic points to ongoing supply-side tightening and a growing conviction among participants to hold through current price levels.
As the supply-side continues to constrict, the market becomes increasingly susceptible to demand shocks, where even modest fluctuations can induce significant price volatility. This thesis is supported by a range of indicators across both on-chain and derivatives markets, which are signalling elevated volatility expectations.
Despite a cooling down in ETF inflows, the aggregate ETF AUM has reached new highs of $137B, driven in large part by BlackRock’s IBIT, which now commands over half the market share. Furthermore, the cost basis of IBIT deposits now closely aligns with key valuation metrics such as the Active Investor Price and True Market Mean. This convergence underscores the growing structural and psychological connection between the ETF complex and the broader Bitcoin market, highlighting the increasing integration of traditional financial products into the digital asset ecosystem.
Disclaimer: This report does not provide any investment advice. All data is provided for informational, and educational purposes only. No investment decision shall be based on the information provided here and you are solely responsible for your own investment decisions.
Exchange balances presented are derived from Glassnode’s comprehensive database of address labels, which are amassed through both officially published exchange information and proprietary clustering algorithms. While we strive to ensure the utmost accuracy in representing exchange balances, it is important to note that these figures might not always encapsulate the entirety of an exchange’s reserves, particularly when exchanges refrain from disclosing their official addresses. We urge users to exercise caution and discretion when utilizing these metrics. Glassnode shall not be held responsible for any discrepancies or potential inaccuracies.
Please read our Transparency Notice when using exchange data.
- Join our Telegram channel.
- For on-chain metrics, dashboards, and alerts, visit Glassnode Studio.