原创 | Odaily星球日报(@OdailyChina)
作者|Golem(@web3_golem)

7 月 22 日,据知情人士透露,加密预测市场平台 Polymarket 正在评估推出自有稳定币的可能性,目的是掌控由 Circle 的 USDC 支撑的高额储备资金所带来的收益。虽然 Polymarket 官方并未做出最终决定,但结合近期美国司法部结束对 Polymarket 的调查及该平台完成对美国合规交易平台 QCX 的收购等一系列动作,许多用户猜测 Polymarket 发币也在路上,于是又加紧了交互的频率。
Polymarket 将要发币的传闻从 2024 年提及,以至于已经有工作室批量交互了长达一年时间。那么,如果作为此前从未交互过 Polymarket 或频率较低的用户,现在开始撸 Polymarket 还有必要并且来得及吗?
美国大选后Polymarket 平台依旧具有竞争力
在考虑现在开始交互 Polymarket 是否来得及之前,我们要先了解 Polymarket 目前平台的运营情况。Polymarket 的火爆源自于 2024 年美国总统大选,因成功预测特朗普胜选及期间高达 80 亿美元的投注资金而名声鹤起。不过自从美国大选结束后,Polymarket 在媒体上被提及的次数开始下降,因此有观点认为失去美国大选这个预测话题后,Polymarket 用户将大量流失。但事实可能会让他们失望,以下从数据角度揭示了在美国大选炒作过后及政治领域之外,Polymarket 仍是一个日处理数 10 万笔交易、每天服务数万用户的热门平台。
日钱包活跃数
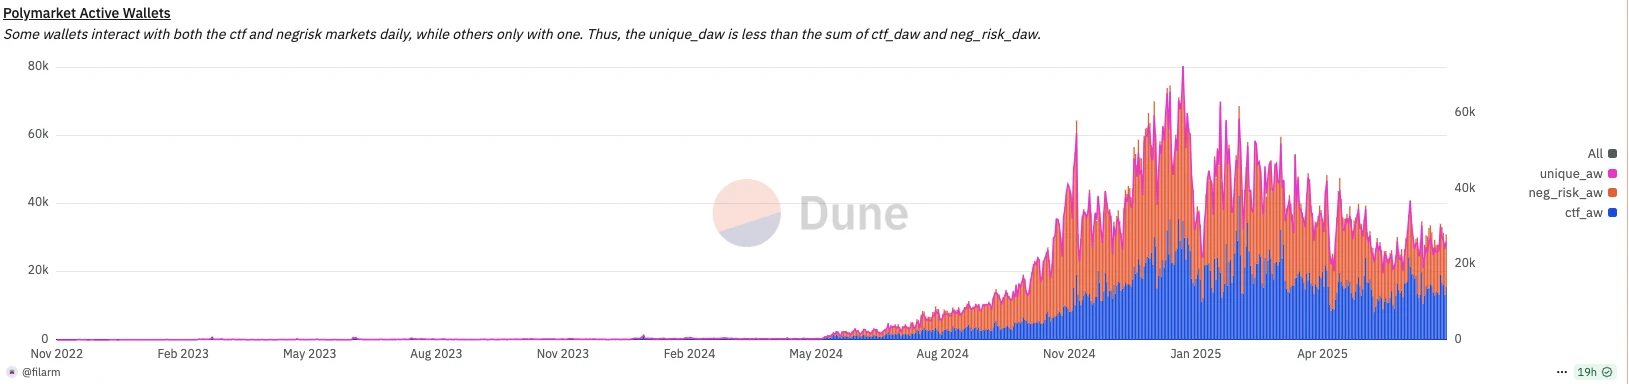
据 Dune 数据,从 2024 年 5 月开始,Polymarket 日钱包活跃数经历半年时间几乎从 0 至 7 万,虽然在 2025 年 1 月末至 2 月初因特朗普正式就职该平台钱包活跃度有所下降,但随后依旧回升。目前 Polymarket 日钱包活跃数保持在 2-3 万,虽与 Pump.fun 等 Meme 发射平台日活无法相比,但仍领先于 Starknet、ZKsync 等L2。在热潮过后仍保持较高的钱包活跃度也验证了 Polymarket 具有坚实的产品市场契合度。
日交易数
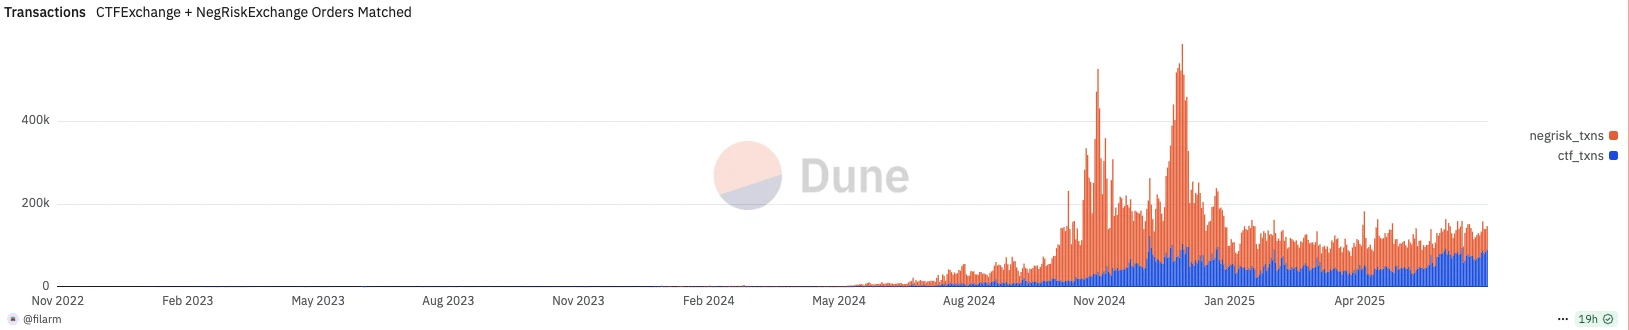
同样,Polymarket 的日交易笔数在 2024 年美国大选期间达到顶峰,峰值接近 50 万笔。但目前即使在大选降温后,Polymarket 平台交易数仍保持在 10 万笔上方。这意味着 Polymarket 在大选虽然使用率有所下降,但与 2024 年之前相比仍留存了一大批忠实用户。
月交易量
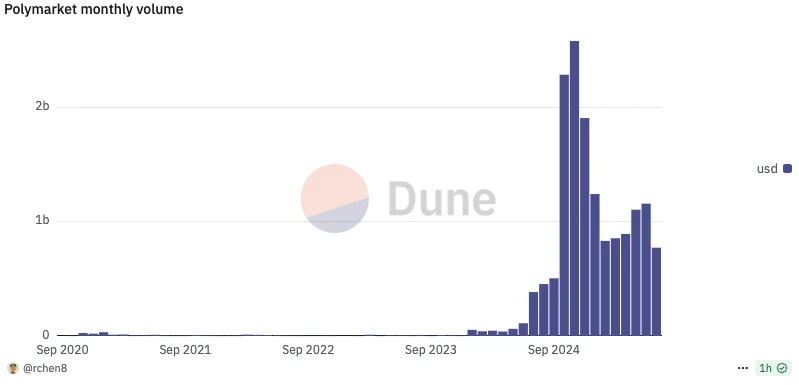
据Dune 数据, 2024 年 11 月 Polymarket 平台月交易量达至顶峰,峰值为 25 亿美元。但大选结束后, 2025 年 2 月至今,Polymarket 平台每月仍有 7-11 亿美元的交易量。据DeFiLlama 数据,过去 30 天,Polymarket 交易量排名第 40 位,领先于 Sushi、GMX 等老牌 DEX。
美国选举外的用户比例
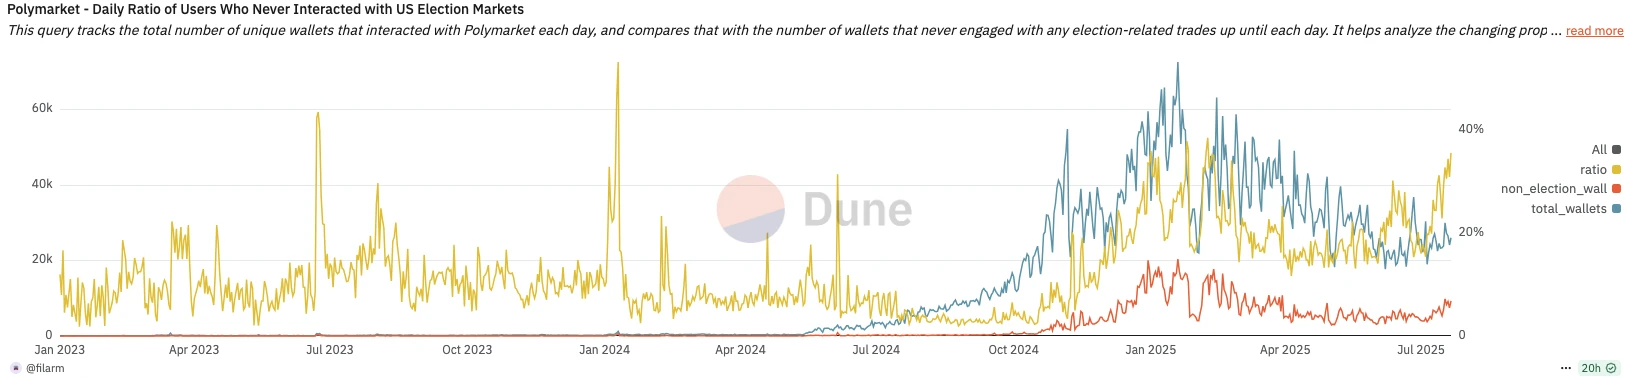
以上图标反映的是从未参与美国选举市场的用户比例。从图中可看出,美国大选结束后,总钱包数量在减少,但从未参与过美国选举的钱包数仍保证稳定,这意味着大选结束后 Polymakert 虽流失了大量短期投机用户,但忠实平台用户并未大幅减少。从未参与美国选举市场的用户比例正在逐渐上升。
月新增用户
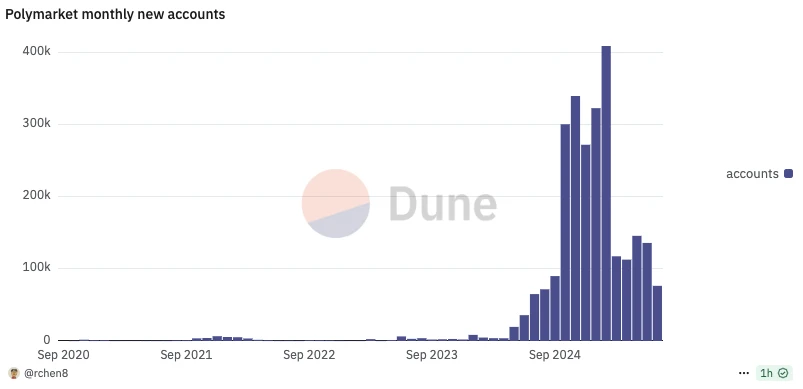 以上图表反映的是 Polymarket 的月新增用户。美国大选期间是 Polymarket 月新增用户最多的时期,但是也是 Polymarket 主要的平台增长期。但美国大选结束后,在因大选而来的投机者纷纷离开时,Polymarket 自 2025 年 3 月以来,每月仍保持 11-14 万个账号增长。这表明除去美国大选外,Polymarket 的其他预测领域仍在吸引着玩家入场,同时这也是一次 Polymarket 平台用户构成从短期热点事件投机到长期使用的“大换血”。
预测池数量
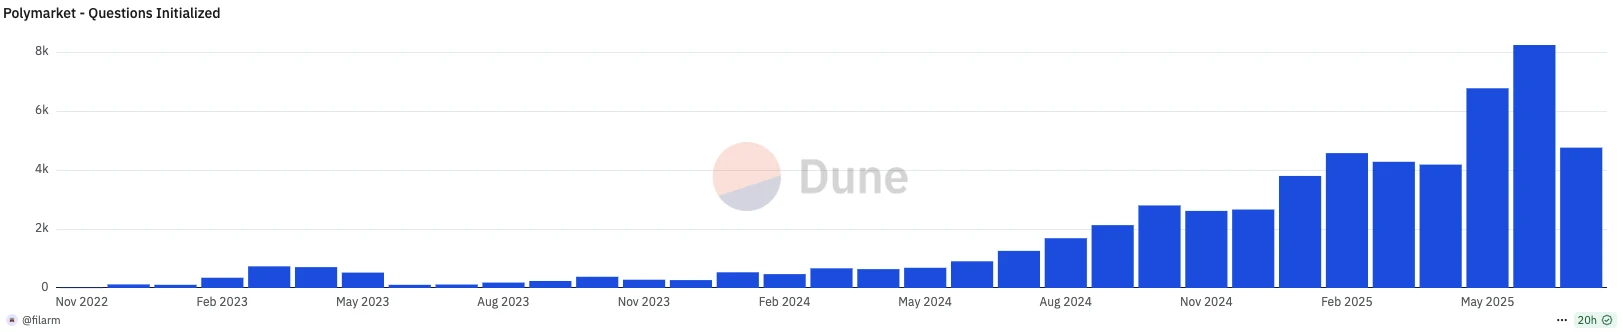
以上图表反映的是 Polymarket 平台每月的预测池数量。从上图中可看出, 2025 年以来,Polymarket 每月的预测池数量均多于 2024 年美国大选期间, 2025 年 5 月和 6 月,预测池还突破了 5000 ,分别达到 6771 和 8238 。这意味着 Polymarket 平台的预测投注领域正在不断扩大,有望吸引更多喜好不同领域的玩家加入。
现在撸 Polymarket 来得及吗?
从以上数据来看,Polymarket 平台仍未过时,这类具有产品市场契合度的项目也是融资市场上的香饽饽。据 Rootdata 数据,Polymarket 目前共完成 3 轮融资,总金额达 7400 万美元,同时据 6 月份消息,Polymarket 还在以超 10 亿美元的估值寻求融资近 2 亿美元。
对于 Polymarket 这样影响了传统政治媒体并将加密带出去的应用来说, 10 亿美元估值其实并不高,倘若真发币,即使是将 10% 的代币供应量空投给平台用户也可能是一个大毛。那么,考虑现在撸 Polymarket 是否来得及,实际是在考虑平台用户内卷程度,以及各种交易成本。
撸 Polymarket 并不卷
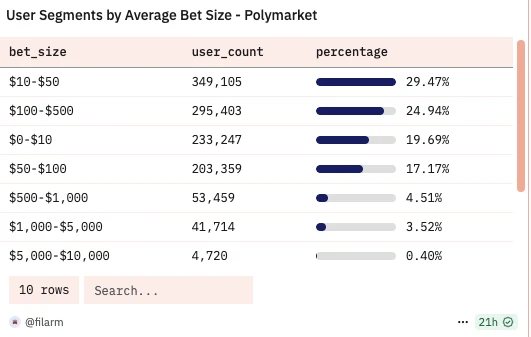
以上图表反映的是 Polymakert 用户的投注资金分布。如上图显示, 90% 以上的用户投注资金在 500 美元以下,投注 5000 美元-10000 美元的鲸鱼仅占 0.4% 。因此若 Polymarket 空投条件中有交易排名,那么目前来看跻身前 10% 的难度并不大,这也侧面反映了当前撸 Polymarket 并不卷,大多数人仍停留在小额低频的刷交易量和交易次数上。
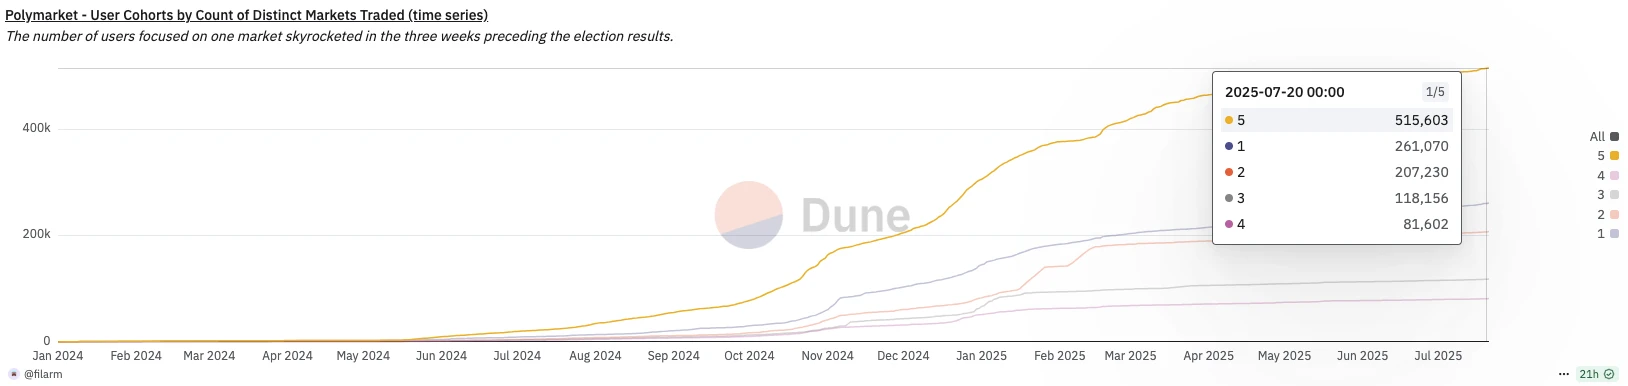
同时在 Polymarket 平台约 120 万个钱包中,参与 5 个以上不同市场的钱包数约 51 万,不到 50% 。参与不同的市场也被认为是交互 Polymarket 的重要维度之一,该指标侧面反映的也是撸 Polymarket 空投的钱包数量,在结合上文 Polymarket 日活跃钱包为 2-3 万的数据,可想而至全网持续撸 Polymarket 的钱包也仅几万个。这与公链动辄几十万的交互地址相比,已属于“宝藏协议”。
散户现在应该如何撸?
早年间,就有用户推测 Polymarket 发币空投可能参考的维度:
交易量
交易次数
交易频率
参与不同市场数
交易方式(市价、限价、AMM)
持仓时间
单笔交易量(如至少有一笔交互金额大于 500 美元)
以上维度也仅仅是一个参考,作为一个散户目前也许最应该注重的交易量、交易次数与频率、持仓时间这几个维度,同时控制投入的成本。对于持仓时间,玩家可投注于“ 2028 年美国总统选举”,因为该预测池较大,且距离结算时间长不容易剧烈波动,并且官方还有 4% 的持仓年化奖励。
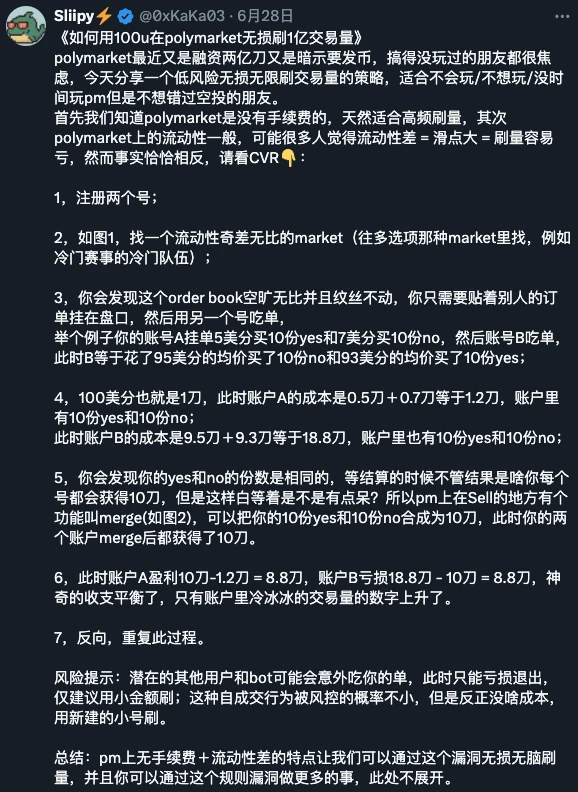
对于刷交易量,为了减少磨损,加密博主SIiipy分享了自己的打法,即寻找一个流动性较差的预测池,使用两个钱包来回刷量,具体操作如下图。
除了以上小额高频刷量外,用户也可以选择当一个真实用户,在 Polymarket 平台上进行真实投注,同时博取未来空投机会。但“十赌九输”的道理在 Polymarket 上也是适用的,根据 Dune 数据,只有 14.3% 的 Polymarket 用户处于盈利状态,而约 86% 的用户账户为负余额。
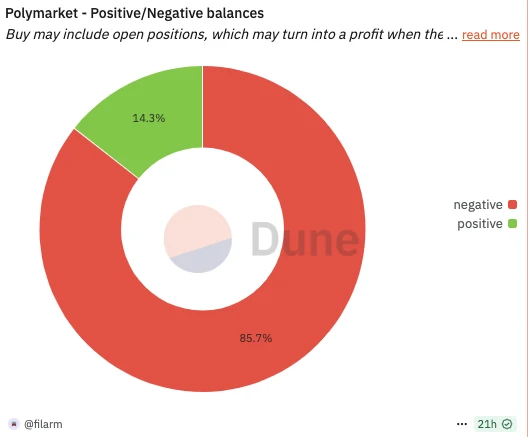
Polymarket 正负账户余额比例
因此,为了减少交互成本,一种使用期权套利的 Polymarket 玩法也诞生了。这种玩法仅限于 Polymarket 上的 Crypto 市场,如“BTC 在 7 月 28 日是否会跌破 118000 美元”这样的预测池,具体操作为在交易所购买 7 月 28 日到期的 118000 看跌期权,然后在 Polymarket 上购买“否”头寸(下注 7 月 28 日 BTC 不会跌破 118000 美元),如此便会自己提供的对冲,但玩家也需注意交易所和 Polymarket 结算时间不一致引发的时差风险。(相关阅读:Polymarket 有新玩法?使用期权套利)


