Dogecoin Recovery Drawing Close? A Bullish Breakout From Descending Chart Patterns Imminent

bitcoinistОпубліковано о 2025-03-04Востаннє оновлено о 2025-03-04

Анотація

Dogecoin alongside other major digital assets has lost its recent upward momentum as the general crypto market experiences a notable...

Dogecoin alongside other major digital assets has lost its recent upward momentum as the general crypto market experiences a notable drawback. With the market facing bearish pressure, DOGE seems like it could undergo more decline. However, analysts believe that the meme coin is likely to rebound soon targeting new yearly highs.

Upward Momentum Building For Dogecoin

Recent developments hint at a resurgence of upward momentum for Dogecoin in light of heightened bearish pressure. Technical analysis platform Rose Premium Signals has identified bullish indicators on the DOGE’s chart in the 1-day time frame.

In the analysis shared on the X platform, Rose Premium Signals foresees an impending price recovery, bringing the meme coin back to key resistance levels. A price recovery during this volatile period reflects Dogecoin’s strong resilience and capability in a bearish market outlook.

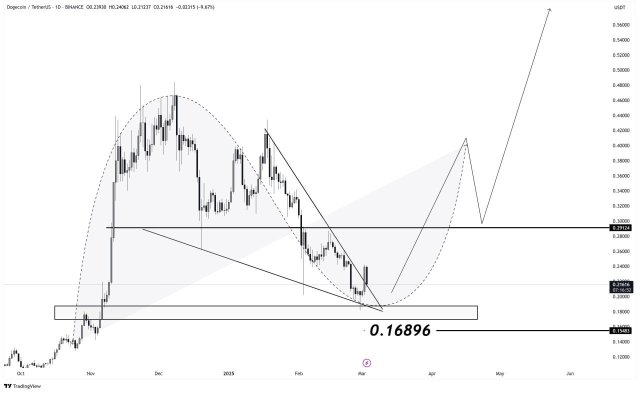
Looking at the 1-day chart, Dogecoin has formed a second Falling Wedge formation. The falling wedge chart formation is a bullish technical pattern characterized by two sloping trend lines that emerge after a downward trend in a crypto’s price action, which suggests growing momentum.
Dogecoin
DOGE eyes rebound to higher levels | Source: Rose Premium Signals on X

Rose Premium Signals highlighted that Dogecoin is rising from the lower edge or the falling wedge formation. With the meme coin bouncing from the lower edge, it is showing signs of a possible rebound that may trigger a notable price upswing to higher highs as the market sentiment stabilizes.

Once DOGE breaks out from the descending resistance, the development could push its price toward targets such as $0.230, $0.287, $0.340, and $0.445 in the upcoming weeks. However, before Dogecoin undergoes the anticipated breakout, it is likely to drop to the $0.16896 price mark.

An Ideal Time To Purchase DOGE In This Cycle

While DOGE has crashed significantly, the decline may be an opportunity to purchase the meme coin as key indications turn green. Ali Martinez, a technical expert and trader has predicted an upcoming rebound as he highlights that the ongoing dip may be the right time to buy DOGE.

In the 1-hour time frame, the TD Sequential indicator has presented a buy signal in the midst of rising volatility. As a result, Martinez is confident that DOGE might be poised for a recovery in the short term. 

Presently, large investors are persistently accumulating the meme coin in anticipation of a major rally in the ongoing market cycle. Martinez reported a notable number of DOGE, particularly 140 million, acquired by whales in a single day. This behavior by large investors shows renewed interest and confidence in DOGE among these whales.

At the time of writing, Dogecoin was trading at $0.18, demonstrating a more than 17% decline in the last 24 hours. Over the past day, its trading volume and market cap have also decreased by over 20% and 17% respectively. With waning market sentiment growing, DOGE could face challenges in sustaining an upward move.

Dogecoin
DOGE trading at $0.19 on the 1D chart | Source: DOGEUSDT on Tradingview.com
Featured image from Unsplash, chart from Tradingview.com
Godspower Owie

Godspower Owie

Godspower Owie is my name, and I work for the news platforms NewsBTC and Bitcoinist. I sometimes like to think of myself as an explorer since I enjoy exploring new places, learning new things, especially valuable ones, and meeting new people who have an impact on my life, no matter how small. I value my family, friends, career, and time. Really, those are most likely the most significant aspects of every person's existence. Not illusions, but dreams are what I pursue.

Пов'язані матеріали

On-chain Analyst: Why Are Most Zcash Transactions Still Traceable?

Title: Why Most Zcash Transactions Remain Traceable Zcash, a privacy-focused cryptocurrency launched in 2016, was designed to offer anonymity by hiding transaction details like sender, receiver, and amount using zero-knowledge proof technology (zk-SNARKs). However, in practice, a significant portion of ZEC transactions are still traceable on-chain. The key reason is Zcash's dual-address system. It features transparent addresses (t-addresses), which work like standard Bitcoin addresses with all data public, and shielded addresses (z-addresses) that encrypt transaction details. There are four transaction types with varying privacy levels: fully transparent (t→t), partially shielded (t→z and z→t), and fully private (z→z). Despite its privacy capabilities, most real-world Zcash activity involves transparent addresses, primarily because major exchanges and institutions use them for regulatory compliance. As a result, blockchain analytics platforms like Arkham can track and attribute a substantial volume of Zcash transactions. Arkham reports it has identified entities behind over $420 billion in ZEC transaction volume. Case studies highlight this traceability: the U.S. government holds seized Zcash from a dark web case, visible via its transparent wallet, and individual traders' profitable moves are trackable from purchase to exchange deposit. In conclusion, Zcash's privacy is not inherent but user-dependent. While purely shielded (z→z) transactions remain cryptographically private, the prevalence of transparent address usage makes much of the network's activity traceable. The actual privacy protection offered depends entirely on how users choose to transact.

marsbit22 хв тому

On-chain Analyst: Why Are Most Zcash Transactions Still Traceable?

marsbit22 хв тому

From Power Infrastructure to Token Economy: The 'Seven-Layer Cake' of the AI Industry Chain

From Power Grid to Token Economy: The AI Industry's "Seven-Layer Cake" The AI industry is shifting from a "model-centric" paradigm focused on massive training to a "token-centric" industrial era driven by inference demand. This new phase revolves around the production, distribution, scheduling, and consumption of tokens—the units of computation used by AI agents for every interaction and task. The article proposes a "seven-layer cake" framework for the AI economy: 1. **Power**: The foundational energy source, with competition shifting to securing stable, low-cost electricity. 2. **AIDC (AI Data Centers)**: Large-scale "Token factories." A trend toward smaller, modular, and regionally deployed AI Factories is emerging for efficiency and proximity to users. 3. **GPU**: The core production hardware for tokens. While NVIDIA dominates, competition exists from AMD, ASIC makers, and Chinese chipmakers, with a growing focus on inference efficiency. 4. **LLMs**: The "engines" that generate tokens. The competition is evolving beyond model size to prioritize factors like token cost, inference efficiency, and operational synergy with infrastructure. 5. **Token Distribution**: The "grid" that allocates and rents out compute resources, led by cloud giants and specialized AI-native platforms. 6. **Token Optimization & Intelligent Scheduling**: The critical "brain" layer that intelligently routes tasks (e.g., to local, cloud, or edge models) for optimal cost, latency, and privacy—maximizing the value of each token. 7. **AI Agents & Models**: The end consumers of tokens. The vision involves billions of AI agents working and interacting concurrently, consuming vast amounts of tokens. Currently, the industry faces fragmentation and inefficiencies between these layers. The true "mass adoption era" of AI will begin only when this seven-layer infrastructure is fully integrated and operates as a cohesive, intelligent network—transforming AI from a software tool into a global industrial system spanning energy, hardware, and compute logistics.

marsbit43 хв тому

From Power Infrastructure to Token Economy: The 'Seven-Layer Cake' of the AI Industry Chain

marsbit43 хв тому

Semiconductors up 78% annually, software down 12% annually: The 'Liquidity Siphon' is playing out within tech stocks

Semiconductor ETFs like SOXX have surged 78.5% year-to-date, while software ETFs like IGV have dropped 12.5%, creating a record performance gap exceeding 90 percentage points. This reflects a major "liquidity suction" within tech stocks, with capital flooding into semiconductors as software faces selling pressure. Driving the semiconductor boom are staggering capital expenditure plans from hyperscalers like Microsoft, Alphabet, Amazon, and Meta, whose combined 2026 capex is projected near $700 billion. This fuels demand for chips, with companies like SanDisk (up 426%), Intel (up 222%), and Micron (up 154%) leading the S&P 500. In contrast, major software firms like Microsoft, Adobe, and Salesforce are all down over 17% year-to-date. The software sector faces a dual challenge: capital is being redirected to semiconductors, and the rise of AI agents like Claude Code threatens traditional SaaS business models, triggering a narrative of AI displacement. Key unanswered questions remain: How long can hyperscalers sustain their massive capex, given potential free cash flow pressures? And will capital eventually rotate back into the deeply oversold software sector? While some analysts warn of a potential semiconductor bubble akin to the dot-com era, the sector's powerful momentum continues, making market timing exceptionally difficult.

marsbit43 хв тому

Semiconductors up 78% annually, software down 12% annually: The 'Liquidity Siphon' is playing out within tech stocks

marsbit43 хв тому

Торгівля

Спот
Ф'ючерси
活动图片