数据解析15个Whales Market上的项目积分价值:哪些值得参与?如何结算?

Odaily星球日报Опубліковано о 2024-03-26Востаннє оновлено о 2024-03-26

Анотація

一文玩转Whales Market:如何计算价值?双押机制是否有安全问题?如何结算非线性兑换的积分?

原创 | Odaily星球日报

作者 | 南枳

数据解析15个Whales Market上的项目积分价值:哪些值得参与?如何结算?

随着 Blast 引发了积分制热潮,现市面上的绝大多数未发币项目均设立了积分制度,作为用户的未来奖励凭证。而 Whales Market 凭借积分交易市场快速崛起,现已上线十多个项目的积分市场,各项目积分价值如何?积分非线性兑换情况下如何结算?双押机制是否有安全问题?Odaily 将于本文解答这些问题。

数据汇总

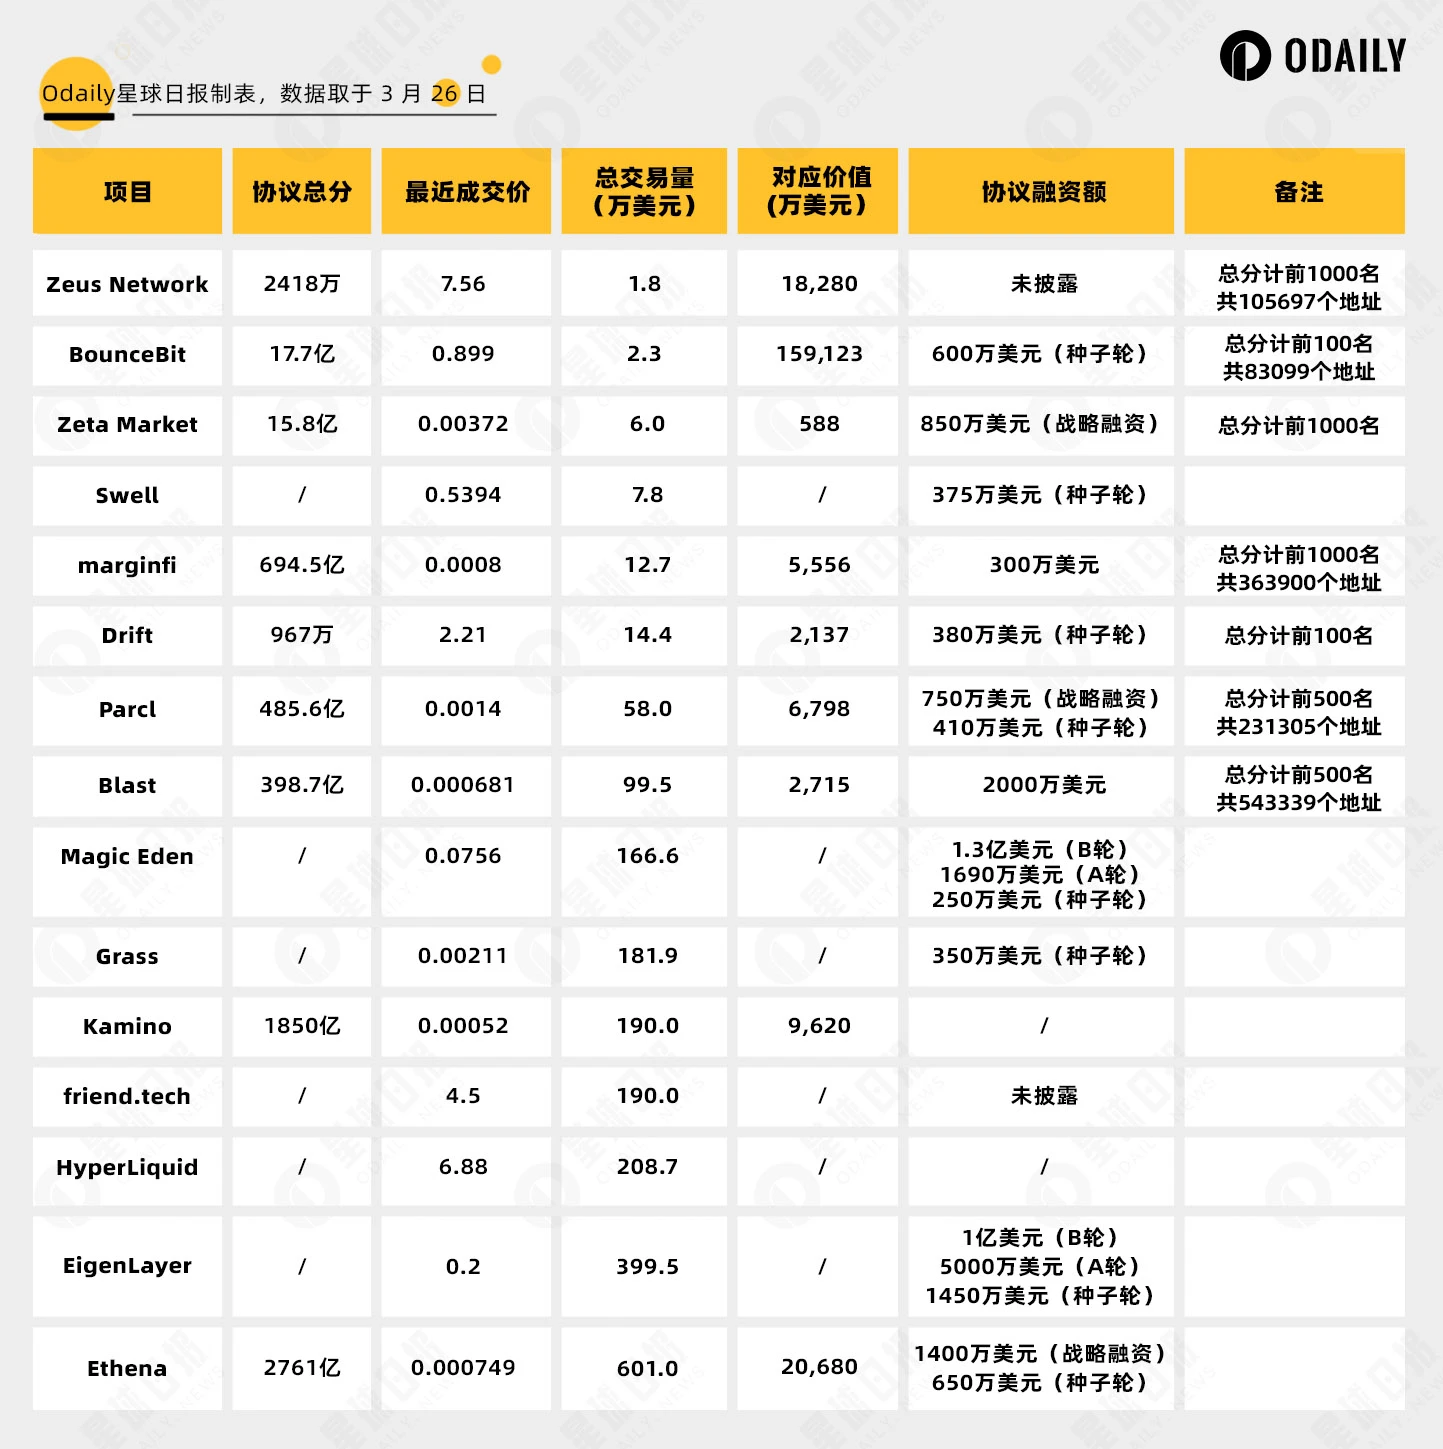
本节对各协议的用户持有总分和 Whales Market 积分市场价格汇总如下,按照 Whales Market 中的总交易量(Total Volume)升序,理论上总交易量越高价格越接近合理数值。

其中部分协议未有官方披露的总积分数,由 Odaily 直接对排行榜进行汇总统计,统计总数详见表中备注。由于积分具有长尾效应,例如 marginfi 前 100 名积分占 1000 名的 54% ,Parcl 前 100 名占 500 名的 93% ,因此所有用户的积分总价值预计与表中统计结果无明显差异。

根据下表,若积分总额低而融资金额高,意味着项目距离空投或其他代币激励还有一定时间,用户可根据项目背景和积分获取速度决定是否参与;若积分总额高而融资金额低,则可能存在高估风险。

数据解析15个Whales Market上的项目积分价值:哪些值得参与?如何结算?

积分结算问题

在积分如何结算方面,存在几个问题在白皮书中未有明确,在咨询项目人员后解答如下。

问题:当代币奖励与积分并非线性关系时如何结算?例如某地址拥有 100 分,而在空投规则里 100 分的地址不发放空投,但在 Whales Market 单独出售了 100 分,如何结算?

解答:对于每个项目,在项目开启基于积分的空投后,Whales Market 官方将为这个项目单独计算一个兑换系数,不论在积分市场上出售了涉及多少积分的单子,均按照统一的兑换系数计算,卖方根据换算后的应交付代币进行卖单结算。(原文:Our team will calculate the average conversion rate and move according to that)

问题:当某个项目最终决定不参考积分进行空投,此时市场上已成交的积分单如何结算?

解答:所有成交单将被撤销,然后向所有用户退款。

问题:项目已宣布空投且买卖单已成交,但迟迟不发放代币,能够撤销成交单吗?

解答:已成交单无法撤销,需等待 TGE 后开启结算。

(Whales Market 功能、机制、运行流程和代币解读详见下文:《积分制协议太多,难以定价和抉择?Whales Market 这样解决》)

安全问题

此外,Whales Market 采取了双押模式,买卖双方都需要质押资金在平台合约中,因此存在对安全方面的疑虑,对于部分问题,Odaily 咨询了安全团队 Beosin 的相关人士,问题及解答如下。

问题:买卖双方进行双押的资金合约,是否有后门,项目方是否有权转移?

解答:当前买卖双方进行双押的资金合约中并没有后门,但由于该合约是可升级合约,其风险点在于项目方或是控制了 ProxyAdmin 合约(0xeB5E772919661F455619A4cABd9B2b64715505E6)的人可以通过升级合约实现恶意的攻击。

问题:平台如果出现无法登陆的情况下,能否通过合约进行解除交割? 

解答:平台如果无法登陆,目前可以由合约的管理员调用 forceCancelOrder()解除订单,将资产返回给买卖双方。合约代码如下: https://etherscan.io/address/0x0e57fff83ae53b22c5b656745168b21a9d2ac3da#code#F 19 #L2 79 

结论

Whales Market 的积分市场极大程度地解决了积分市场的定价与锁定利润需求,但存在资金占用高、项目方仍有超级权限等瑕疵,用户可根据实际需求选择使用。

Пов'язані матеріали

Rented Faith: How Much of the Bitcoin ETF Inflows Is Real Money?

"Rented Conviction: How Much of Bitcoin ETF Flows Is Real Money" The weekly inflows into Bitcoin ETFs are often interpreted as a gauge of institutional belief. However, a significant portion of this activity is driven by a hidden arbitrage trade, not directional conviction. The core mechanism is a cash-and-carry arbitrage: traders buy spot Bitcoin (often via ETFs) while simultaneously shorting CME futures to lock in the price difference, or "basis." This delta-neutral trade is essentially an interest rate play. In weekly data, about half the fluctuation in ETF flows can be explained by new short positions added by leveraged funds (hedge funds), with a correlation of 0.70. Bitcoin's price movement in a given week shows no statistical power in predicting these flows. While this arbitrage trade drives weekly *volatility*, it is not the main component of the cumulative *stock*. Of the total ~$55 billion in net ETF inflows, the current net arbitrage position is only about $1 billion. The remainder is steady, directional buying averaging ~$400 million per week, which constitutes the vast majority of the accumulated "mountain" over two years. Thus, ETF flow data overstates the *volatility* of conviction, not its *level*. This arbitrage trade has been unwinding for nearly two years. Leveraged fund short positions peaked at ~$14 billion in late 2024 and have since declined to ~$4.5 billion. When the basis compresses to unprofitable levels, ETF inflows and short positions retreat together. Recent outflows should not be mistaken for a loss of faith but rather the routine unwinding of this rate trade. For Ethereum ETFs, the pattern is weaker. Accounting for staking yield makes the basis often negative, so neither strong conviction buying nor robust arbitrage supports its flows. To interpret ETF flows correctly, monitor the CME basis versus T-bill rates and leveraged fund net shorts. They reveal how much of the next "demand" headline is real. The real, patient buy-and-hold demand is what constitutes the enduring bulk of ETF assets.

marsbit10 хв тому

Rented Faith: How Much of the Bitcoin ETF Inflows Is Real Money?

marsbit10 хв тому

Soaring Over Tenfold Within the Year: The Frenzy Over SK Hynix Leveraged Products

South China Morning Post The leveraged ETF tracking SK Hynix has surged over tenfold year-to-date, fueled by intense market speculation on the memory chip sector. By June 22, the value of the 'South Korea 2x Long SK Hynix ETF' listed in Hong Kong had skyrocketed by more than 1,061% since the start of the year, while its asset size exploded over twenty times from the end of last year. The rally is driven by AI-driven demand for high-bandwidth memory (HBM), with SK Hynix recently sampling its next-generation HBM4E product. However, industry professionals warn of significant risks. Leveraged ETFs magnify both gains and losses. During a recent market correction, while the underlying SK Hynix stock fell 19.1%, its double-leveraged ETF dropped nearly 38%. Korean regulators noted that such products could theoretically lose 60% in a single day. Additionally, these ETFs face risks like time decay in volatile markets, liquidity spirals during mass redemptions, and extreme price dislocations from market-making failures, as seen in early June when an ETF moved opposite to its underlying stock. The trading is predominantly driven by retail investors, with institutional capital largely absent due to the products' high volatility. Analysts caution that with the semiconductor sector at elevated valuations and facing geopolitical and supply chain uncertainties, leveraged ETFs pose a substantial threat of amplified losses for uninformed investors.

marsbit1 год тому

Soaring Over Tenfold Within the Year: The Frenzy Over SK Hynix Leveraged Products

marsbit1 год тому

18 Months, Over 50x Surge: KIOXIA's Epic Comeback

KIOXIA, a NAND flash memory giant, staged a dramatic comeback driven by AI demand. After a period of significant losses, a failed merger, and missed HBM opportunities, its 2024 IPO began modestly. However, fueled by explosive demand for AI data storage, its stock price skyrocketed over 50 times within 18 months, making it Japan's most valuable company, surpassing Toyota. Its Q1 FY2026 profit guidance soared 30-fold year-over-year, with 2026 NAND capacity already sold out. Key to its success is its 3D NAND technology, BiCS FLASH. As the inventor of NAND, KIOXIA advanced its technology through generations, reaching over 200 layers by 2023. Key innovations include CBA (CMOS directly Bonded to Array), which separately manufactures control circuits and memory arrays for better performance, and OPS (On Pitch Select Gate) to increase density. The company is now developing high-capacity packages like an 8TB solution stacking 32 dies. Looking beyond NAND, KIOXIA is exploring 3D DRAM with its OCTRAM technology, using oxide semiconductor transistors for ultra-low leakage to reduce power consumption. This fundamental research differs from HBM and represents a long-term bet to extend its 3D expertise from NAND into future DRAM architectures. KIOXIA's story highlights how technological assets and shifting market cycles can rapidly transform a company's fortunes. While questions remain about sustaining growth beyond the current AI boom, its resurgence demonstrates that in semiconductors, being down does not necessarily mean being out.

marsbit1 год тому

18 Months, Over 50x Surge: KIOXIA's Epic Comeback

marsbit1 год тому

Market Trends in U.S. Stocks (June 23): Peak at Listing? SpaceX Loses Over $800 Billion in Three Days, Tech Stocks Experience Severe Internal Divergence

Stock Market Trends (June 23): Did SpaceX Peak at IPO? The company loses over $800 billion in market value in three days as a sharp divergence unfolds within the tech sector. SpaceX's post-IPO decline of over 20%, falling below its first-day close, reflects a swift market repricing. The catalyst is a clear shift in narrative from "AI platform potential" to concerns over rising capital costs, as its $8.57 billion IPO and subsequent $20 billion debt offering are earmarked for acquisitions and refinancing existing bridge loans rather than de-leveraging. While high-valuation tech stocks like Google, Meta, Amazon, and Microsoft faced pressure, Micron surged nearly 7% to a record high following a strategic supply deal with Anthropic for HBM and memory, highlighting robust, tangible demand in AI infrastructure. The broader market saw funds rotate into more defensive industrial and financial names. Macro factors included a dip in oil prices to a three-month low on news of a US-Iran framework deal, though logistical hurdles for resuming full Strait of Hormuz shipments remain. Key events ahead include Nvidia's shareholder meeting, Micron's earnings, and the May PCE inflation data. The latter will be crucial in determining whether the sell-off in high-valuation growth stocks, which appears to have just begun, will persist.

marsbit1 год тому

Market Trends in U.S. Stocks (June 23): Peak at Listing? SpaceX Loses Over $800 Billion in Three Days, Tech Stocks Experience Severe Internal Divergence

marsbit1 год тому

Торгівля

Спот
Ф'ючерси
活动图片