Bitcoin turned lower below $31,000 after bulls failed to bring the leading asset to a new high in 2023.
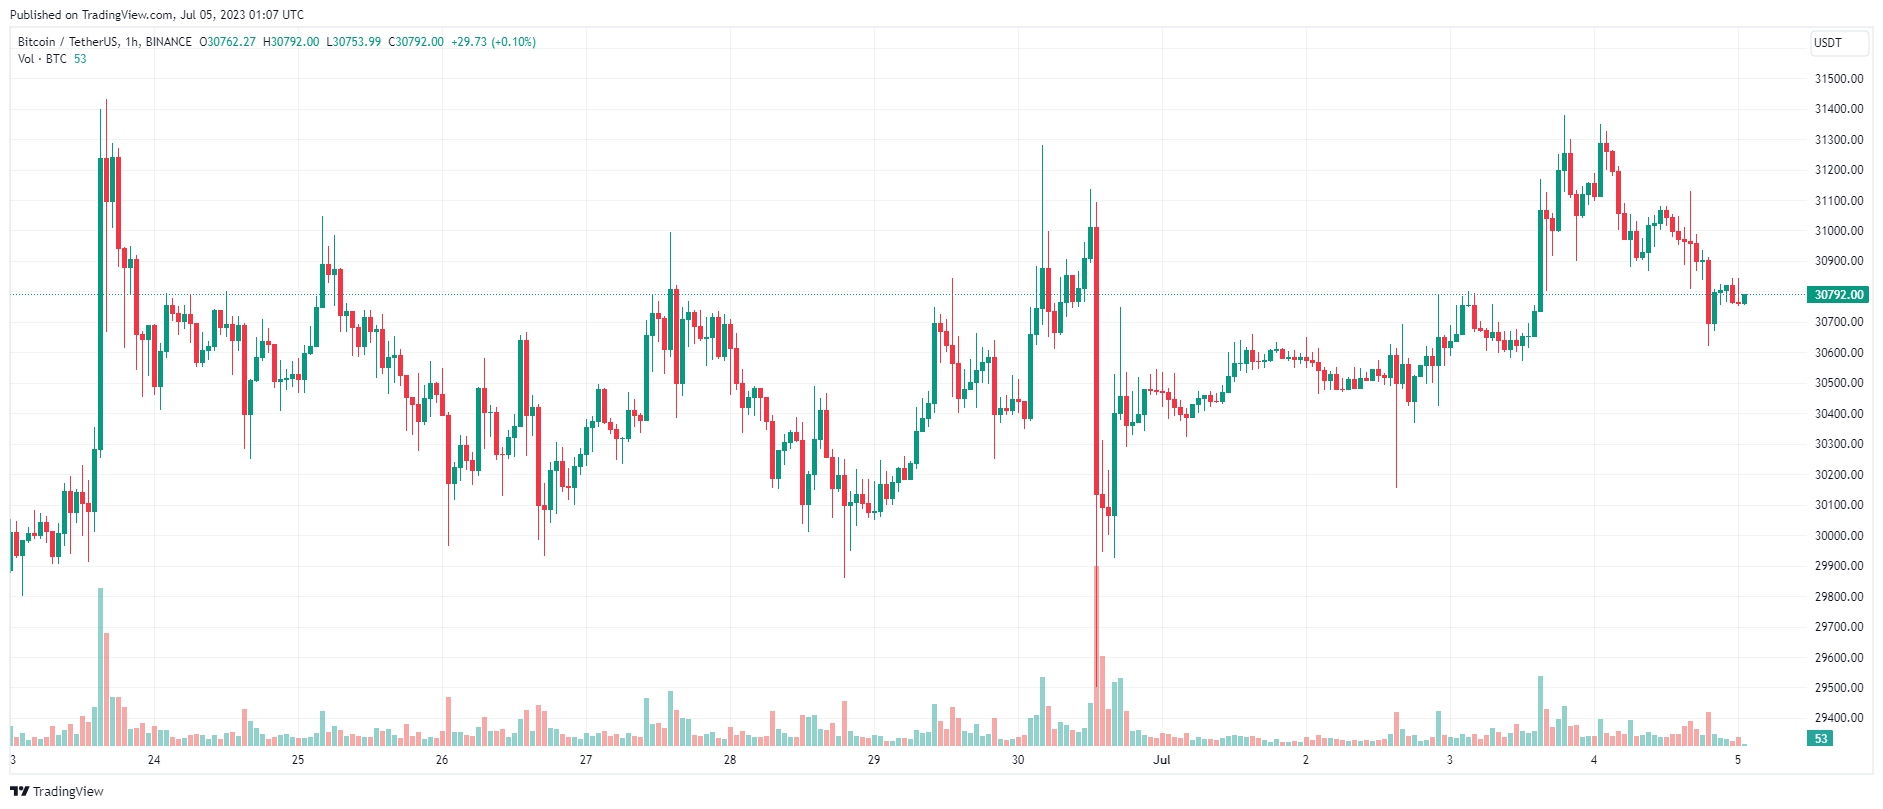
BTC Price Chart – 1 hour | Source: TradingView
U.S. stock market futures were little changed on Tuesday night as Wall Street had a shortened trading week with the holiday season.
Dow Jones futures contract fell 33 points, or 0.1%; S&P 500 and Nasdaq 100 futures fell 0.07% and 0.14%, respectively. Markets were closed on Tuesday for the Independence Day holiday.
Investors are having an active session on Monday, the start of a new month, quarter and half of the year. Shares were up slightly in the shortened trading day, with the Dow Jones Industrial Average adding 10.87 points, or 0.03%; The S&P 500 gained 0.12%, while the Nasdaq Composite closed 0.21% higher.
Last week, the Nasdaq Composite posted its best first-half results since 1983, while the S&P 500 recorded its best first-half gain since 2019, as growing interest in artificial intelligence fueled the promote investor optimism towards stocks. The Dow Jones index rose only 3.8%. Some market participants expect this to be a signal that prices will continue to rise in the second half of the year.
Traders are watching May factory orders data on Wednesday after the market opens. Economists polled by Dow Jones are predicting a 0.6% gain, higher than the previous month's 0.4% gain.
Investors are also looking forward to the minutes of the US Federal Reserve's June meeting on Wednesday, which could shed some light on the path of future rate hikes.
Elsewhere, New York Fed President John Williams is scheduled to speak during the 2023 Annual Meeting of the Central Banking Research Association (CEBRA) in New York.
Gold prices were mostly flat on Tuesday (July 4) in low-volume trade due to the US holiday, while investors awaited the minutes of the Federal Reserve's June meeting (Fed). ) on Wednesday (July 5) for more hints on the future roadmap for interest rate hikes.
At the end of the session, the spot gold contract was almost flat at $1,921.39/oz. Gold futures were mostly unchanged around $1,929.1 an ounce.
Oil prices rose slightly on Tuesday (July 4), as the market gauged supply concerns from Saudi Arabia and Russia's cuts.
Ending the session, the Brent oil contract increased 22 cents, or 0.3%, to $74.87 a barrel. The WTI oil contract added 27 cents, or 0.3%, to $70.06 a barrel.
Data from TradingView shows BTC price action attempting to consolidate upside momentum just below $31,000.
The top asset peaked near $31,400 before momentum waned, leaving BTC/USD remaining in a tight trading range.
While there are no new yearly highs yet, market participants are still bullish on the back of the recent price action.
On one of its proprietary tools, DecenTrader even argued that Bitcoin “looks bullish on almost every timeframe.”
“It looks like the market is ready to go higher,” adds DecenTrader co-founder Philip Swift, creator of the On-Chain data source, LookIntoBitcoin.
Michaël van de Poppe, founder and CEO of trading firm Eight, forecasts that the rapid rise will only begin when BTC/USD breaks through $32,500 to mark a new top.
“Bitcoin is still accumulating pretty well. The market swept through some highs, but did not accelerate sharply. The upside will actually happen above $32,500″.
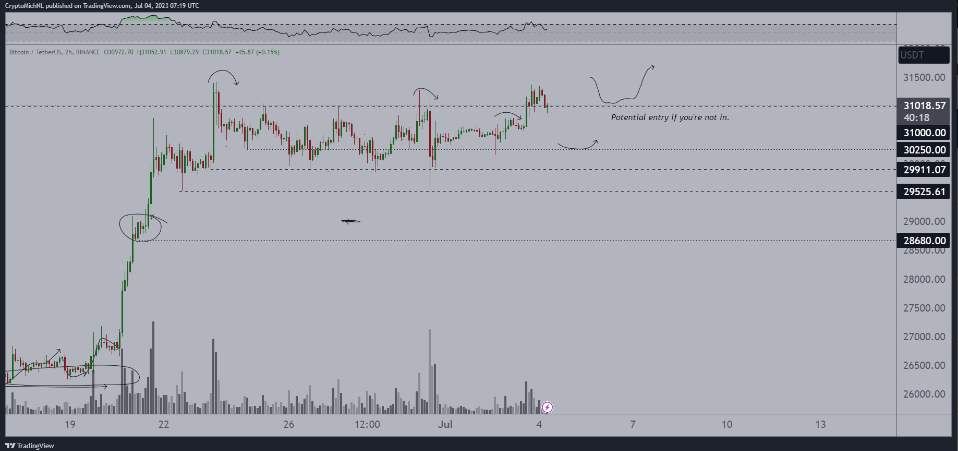
BTC/USD chart with caption | Source: Michaël van de Poppe
Others continue to predict lower lows reappearing in the second half of 2023 after peaking in the midterms.
“On the macro side, the longer Bitcoin holds above $25,000, the more I lean towards the macro Dip ,” wrote popular crypto trader Crypto Tony.
“I still believe we will see a larger decline later this year, but it is likely to be part of a larger accumulation zone.”
Meanwhile, the latest On-Chain metrics from analytics firm Glassnode have revealed an ongoing accumulation among smaller Bitcoin investors.
These “shrimp”, defined as wallets holding less than 1 BTC, are now rotating their holdings to over 33,000 BTC per month, bringing the total BTC held by the “shrimp” to 1, 33 million.
According to Glassnode, “only 130/5263 (2.5%) trading days recorded monthly position changes greater than this.”
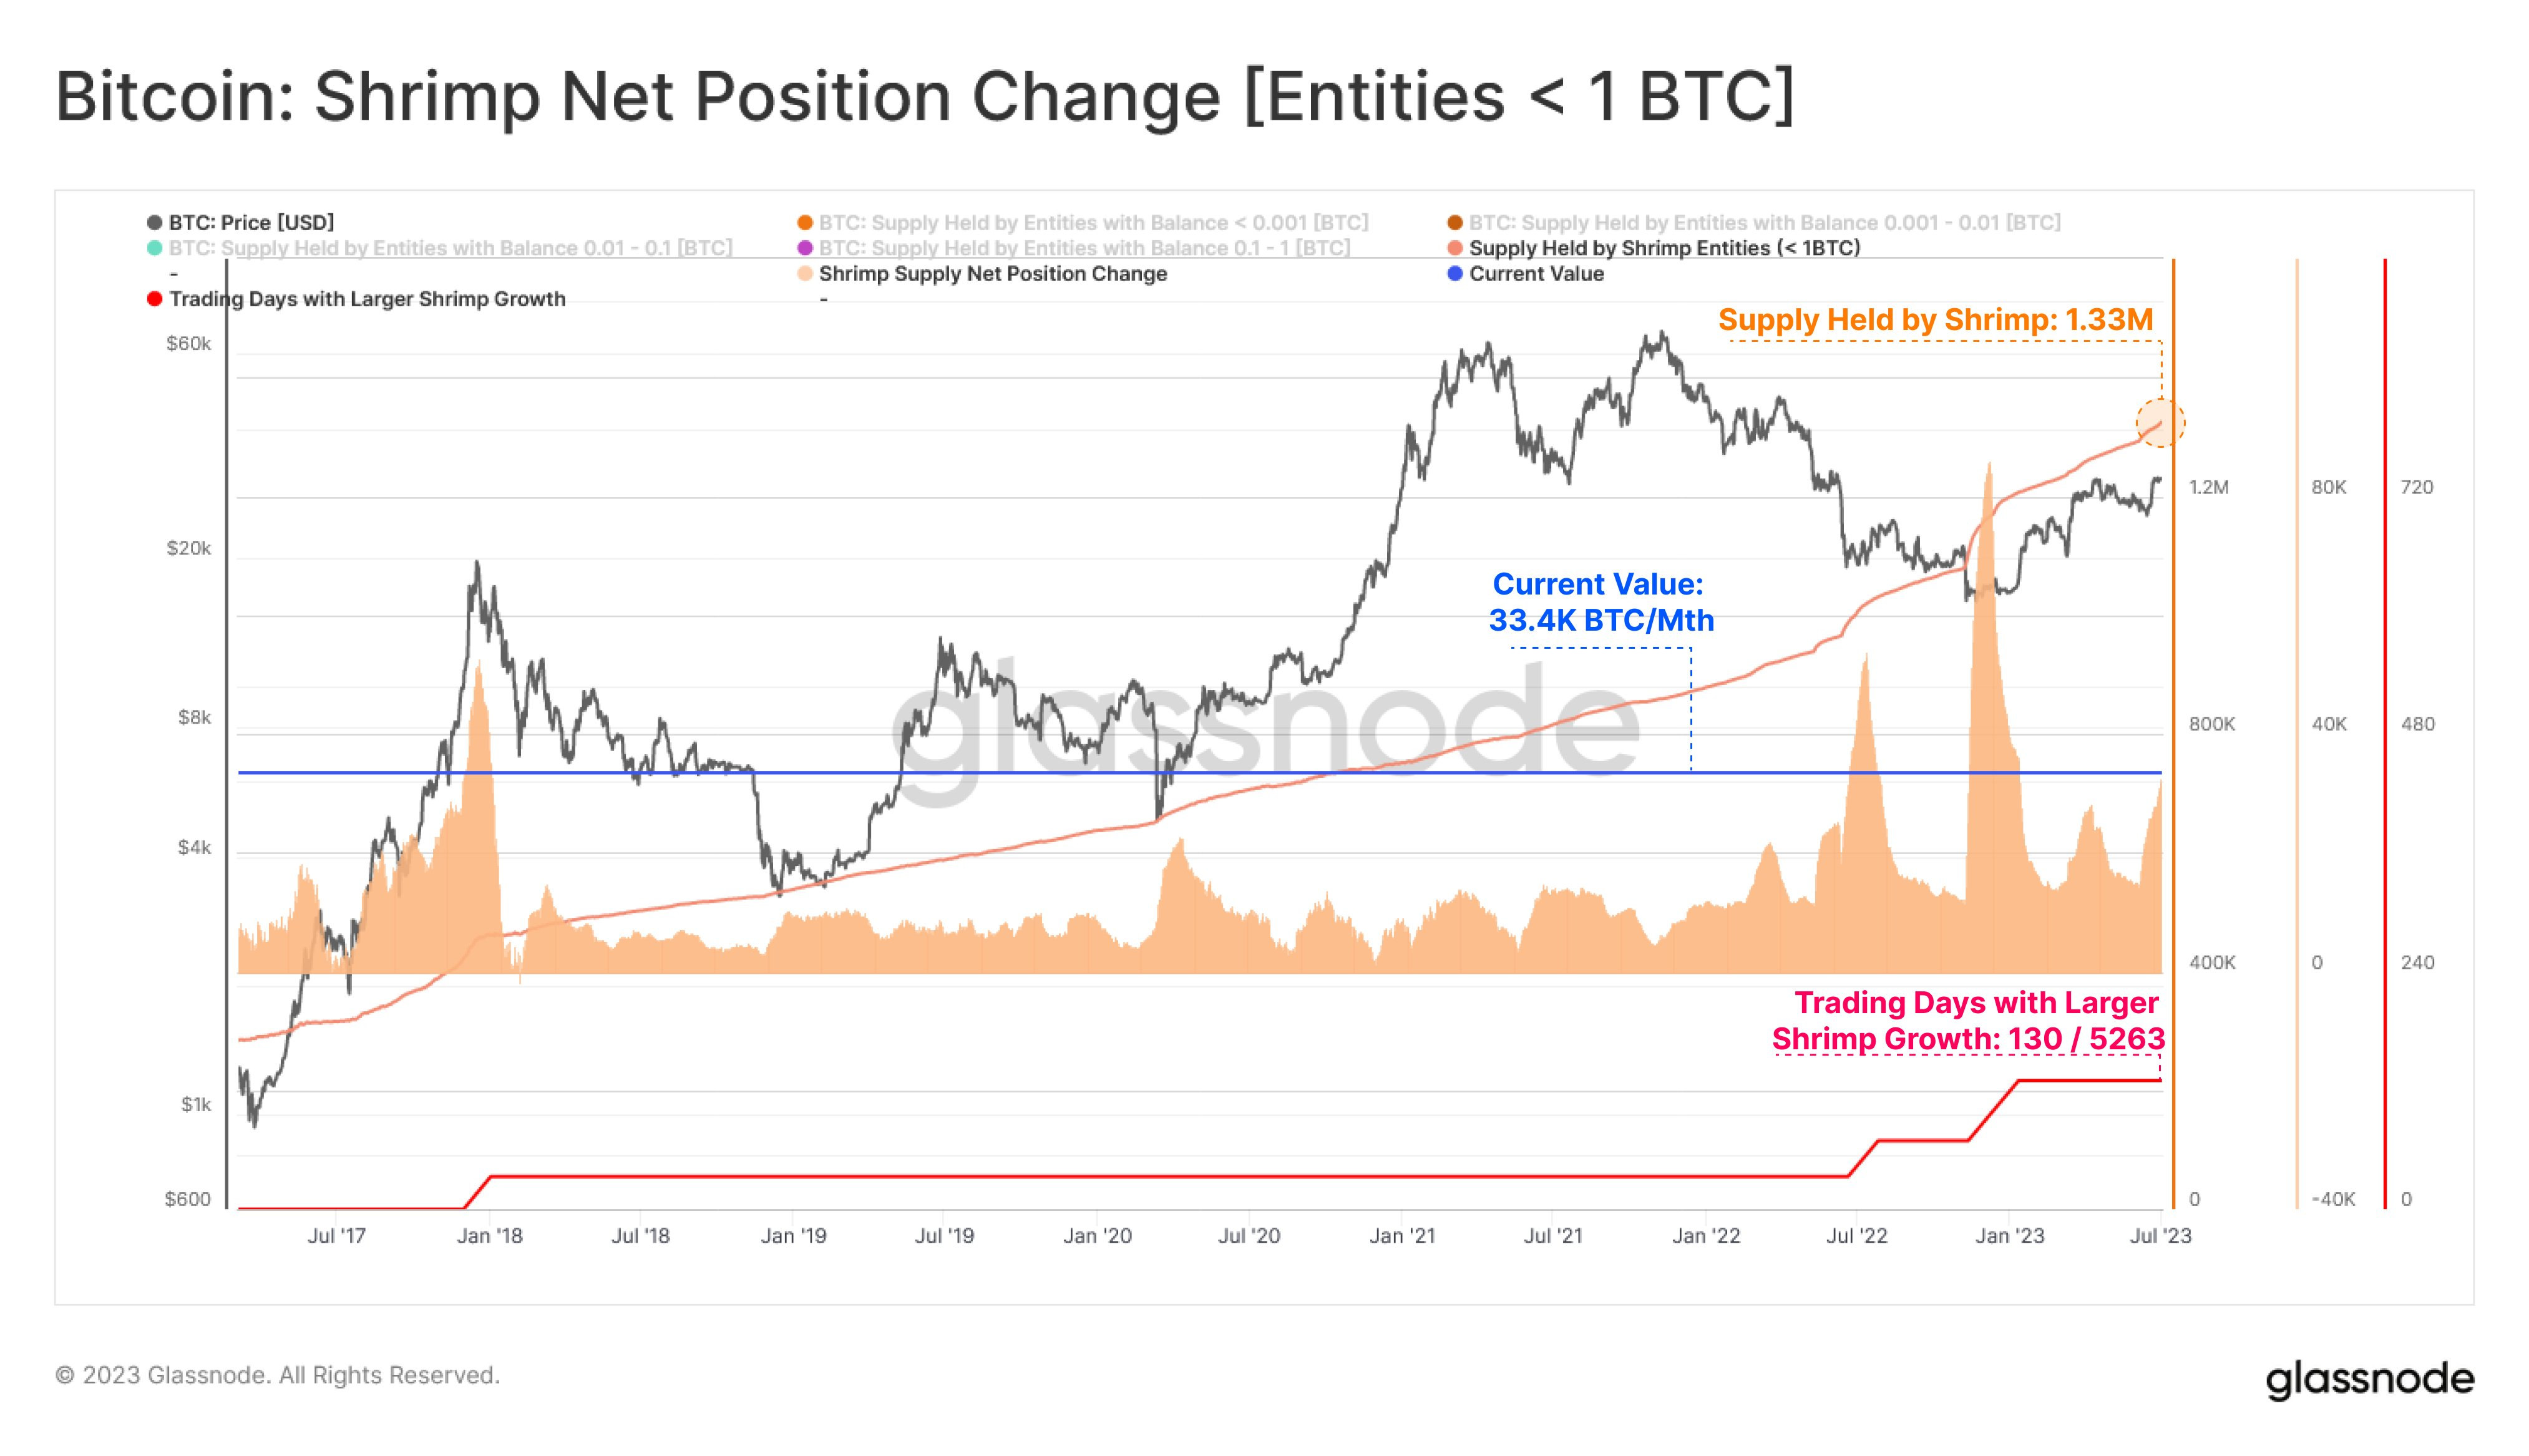
Change chart of BTC holdings of “shrimp” | Source: Glassnode
The altcoin market eased slightly after Bitcoin fell back below $31,000 after failing to establish a new yearly top.
Flow (FLOW), eCash (XEC), WOO Network (WOO), Bitcoin SV (BSV), Pepe (PEPE), Render Token (RNDR), Optimism (OP), The Graph (GRT), Stacks (STX), Peg (Peg)…. all dropped from 4-7% in the past 24 hours. However, on the weekly timeframe, most of these projects are still in the green.
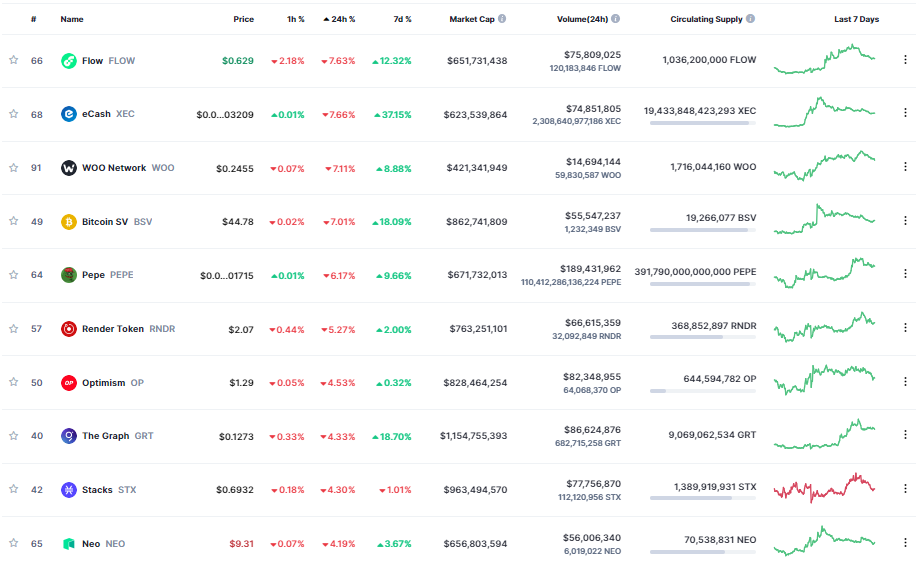
Source: Coinmarketcap
After hitting a local top at $1,966, Ethereum (ETH) has shown a correction signal back below the $1,950 area. Currently, the asset with the second largest market Capital is trading around $1,936, down slightly by nearly 1% on the day.
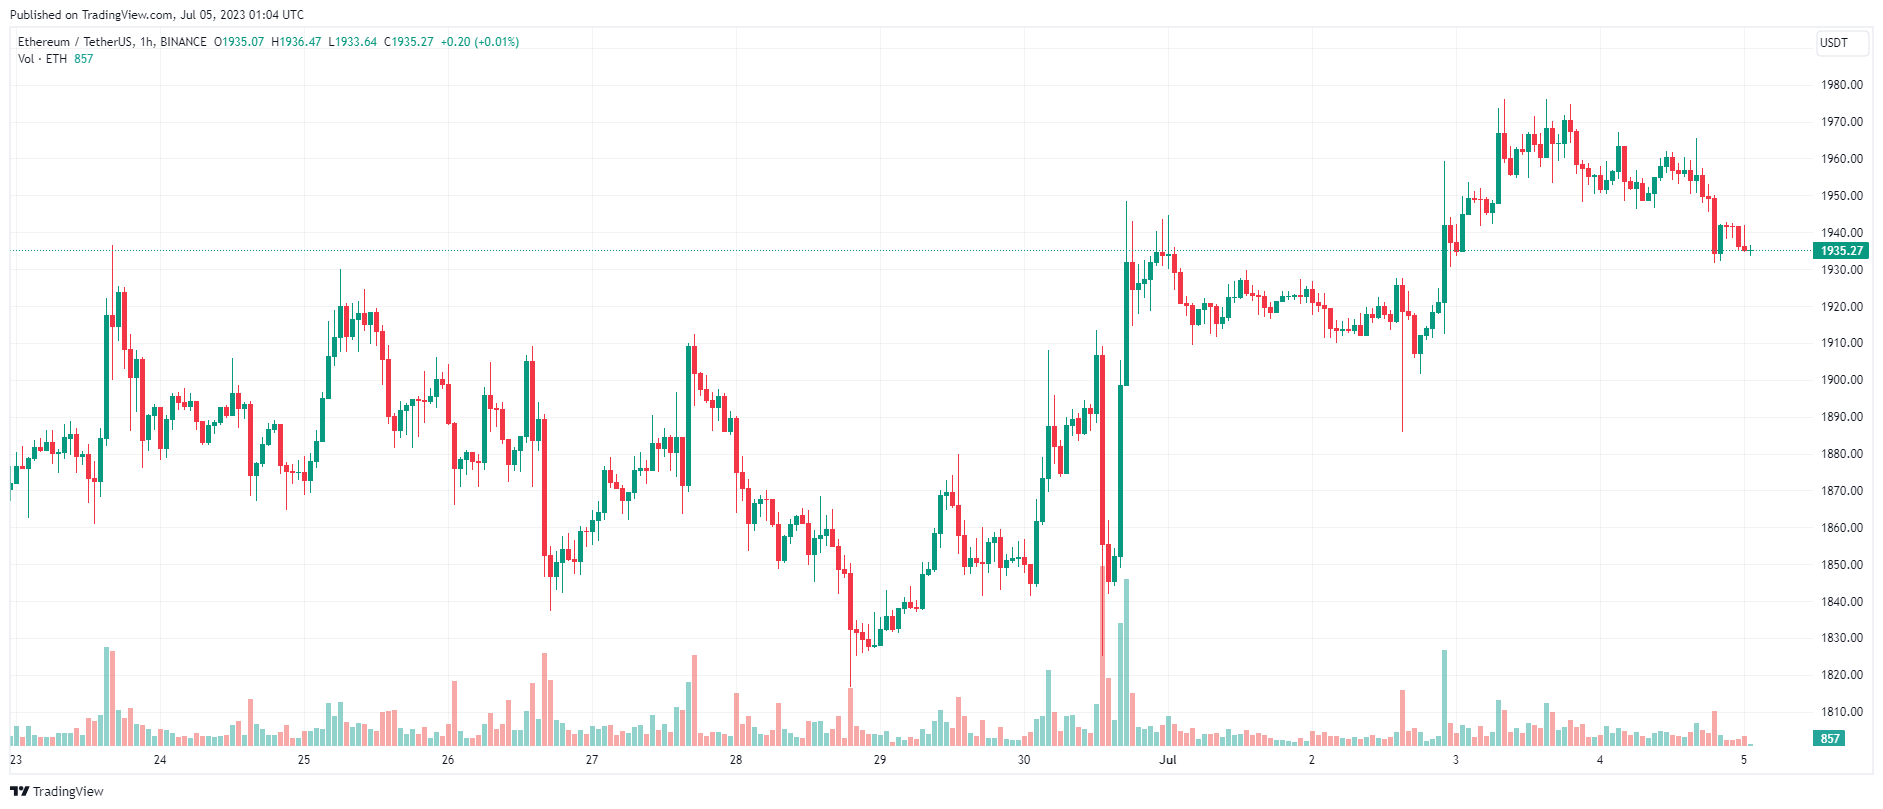
ETH price chart – 1 hour | Source: TradingView