asiftahsin
06/22 23:34
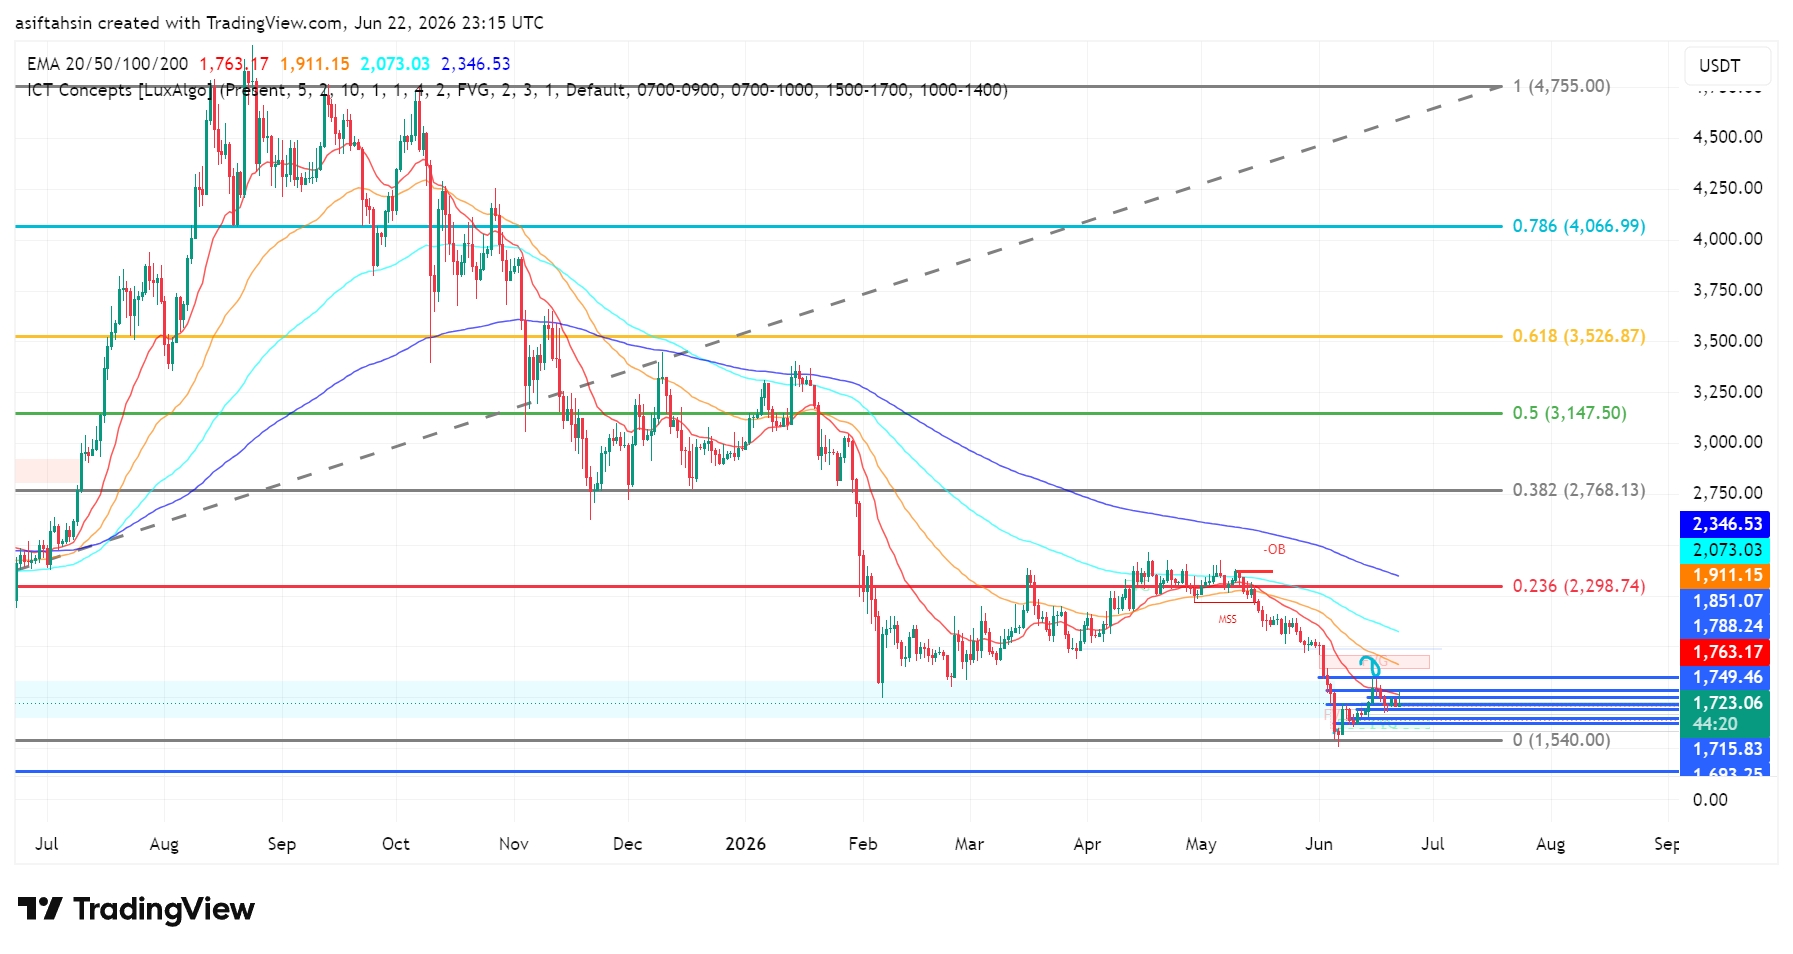
Technical Outlook: ETH Holding Above Key Support — Relief Rally Faces Strong Overhead Resistance
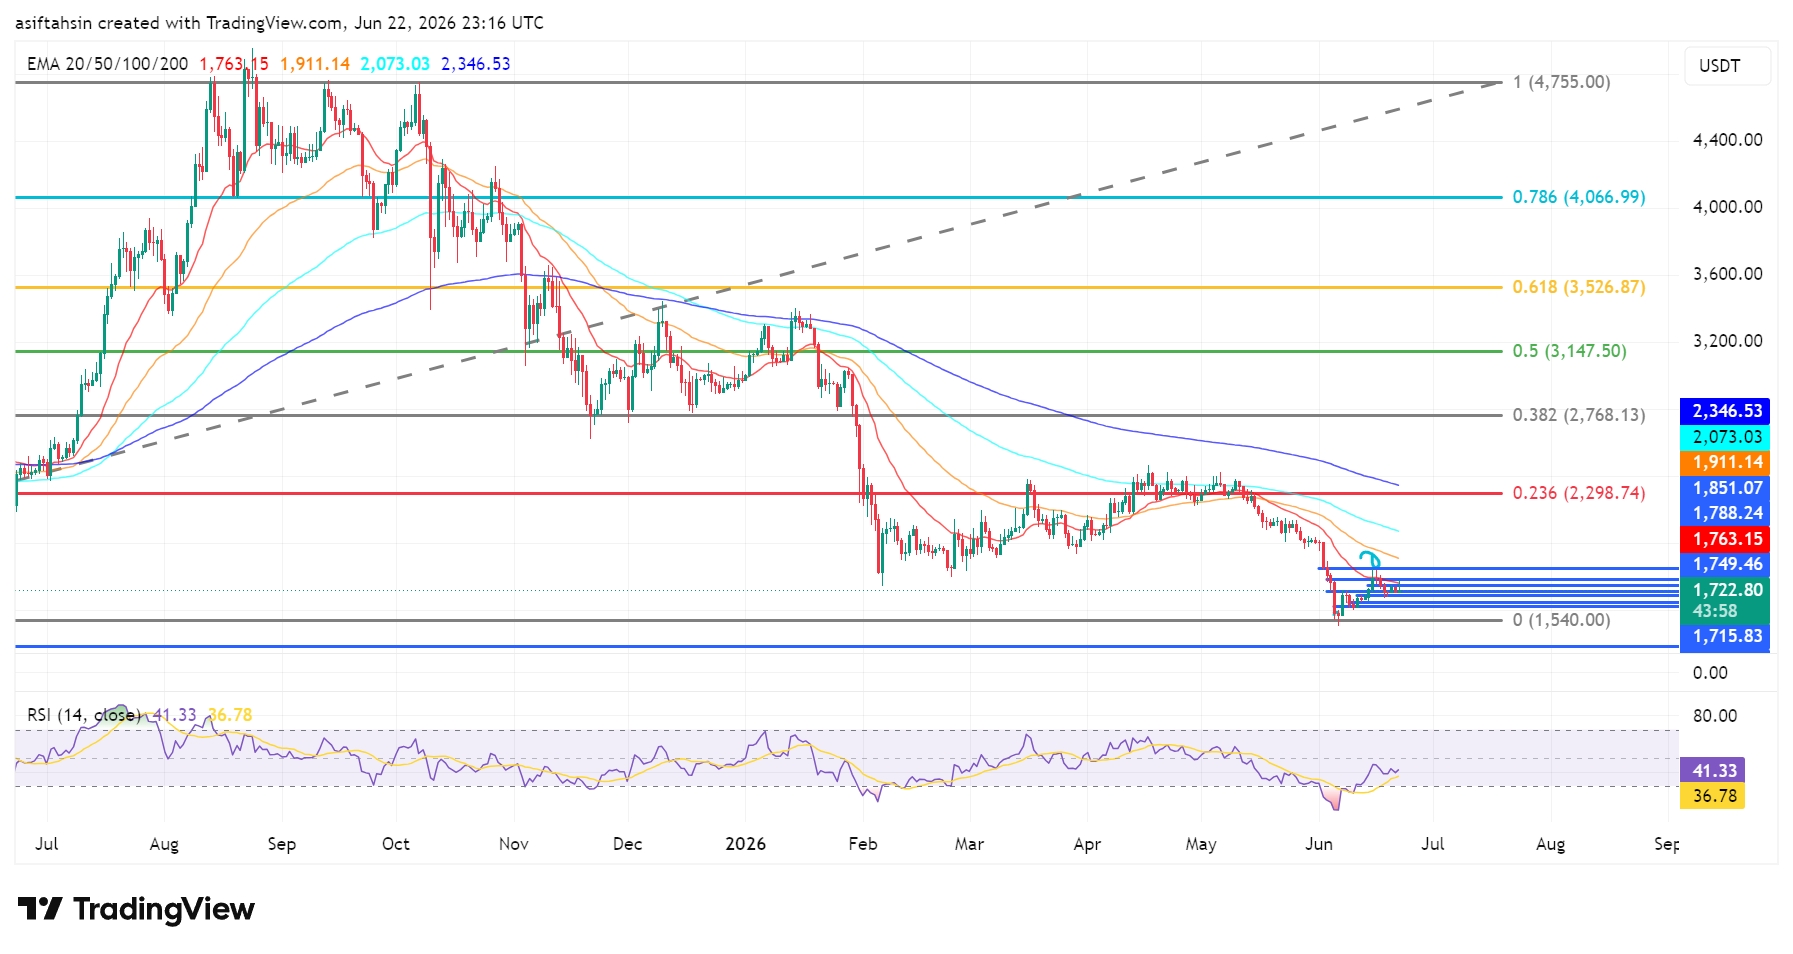
ETH continues to trade under heavy bearish pressure despite stabilizing above the major macro support region around $1,715–$1,750. After months of lower highs and lower lows, price remains below all major moving averages while attempting a short-term recovery from oversold conditions.
Although buyers have defended the recent lows and momentum has improved slightly, the broader market structure remains bearish until ETH reclaims multiple resistance levels overhead.
📈 EMA Structure (Bearish)
20 EMA: $1,763
50 EMA: $1,911
100 EMA: $2,073
200 EMA: $2,347
Price remains below all major EMAs ❌
20 EMA acting as immediate dynamic resistance
50 & 100 EMA continue capping recovery attempts
200 EMA remains the primary macro trend barrier
👉 ETH must reclaim the EMA cluster before a sustainable bullish reversal can be confirmed.
📐 Fibonacci & Market Structure
Price remains below the 0.236 Fibonacci level at $2,298.74
Long-term bearish structure remains intact
Recent decline swept liquidity below previous support
Current rebound appears corrective within the larger downtrend
👉 A relief rally could target:
$1,763 → 20 EMA resistance
$1,911 → 50 EMA resistance
$2,073 → 100 EMA resistance
$2,299 → 0.236 Fibonacci resistance
👉 Failure to hold current support could expose:
$1,723 → Immediate support
$1,715 → Critical macro support
Below $1,715 → Increased downside risk toward lower liquidity zones
🧠 ICT / Smart Money View
Recent selloff swept significant sell-side liquidity beneath the range
Market structure continues to print lower highs
Current bounce is occurring beneath major resistance and remains unconfirmed
Fair Value Gap (FVG) remains overhead and has yet to be fully filled
No confirmed bullish market structure shift (MSS/BOS) has occurred
#Claim1,200 USDT in the Monthly Creation Challenge
ETHUSDT
永续
----%
1Поділитися
Усі коментарі0НовіПопулярно