Bitstar2
06/22 13:01
$SYN Hourly Chart: Parabolic Move With SAR and Sup
$SYN Hourly Chart: Parabolic Move With SAR and Supertrend Both Bullish
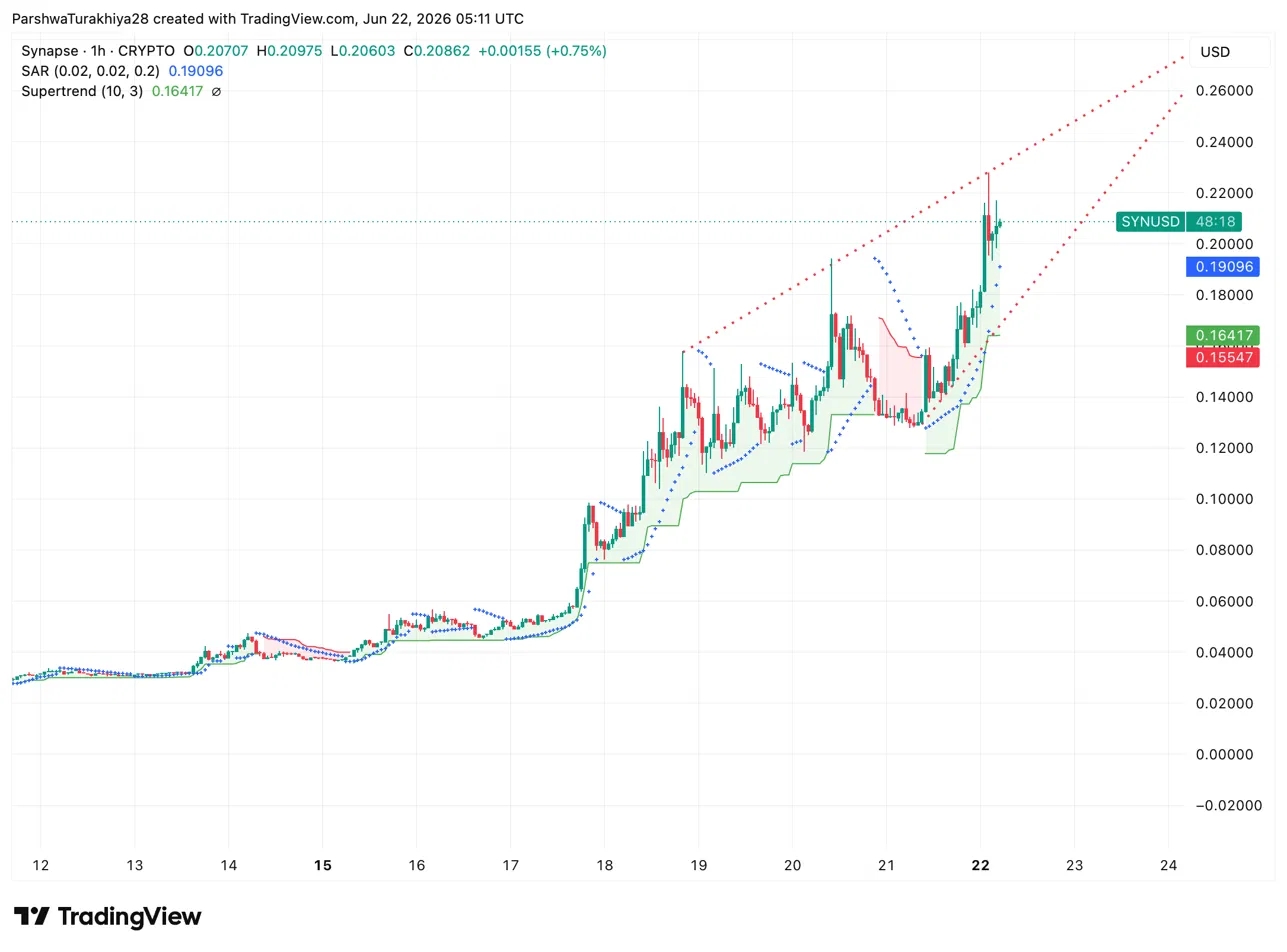
$SYN Hourly Price Action (Source: TradingView)
The hourly chart shows a clean parabolic structure building since June 18, with price stair-stepping higher inside an ascending channel. SAR at $0.1910 and the Supertrend at $0.1642 both sit below price in bullish alignment, confirming the short-term trend remains intact despite the extended RSI reading.
The move has not shown any meaningful pullback structure yet, which is unusual for a rally of this size. A break below the Supertrend at $0.1642 would be the first technical signal that momentum is fading.#HTX Creation Challenge — Post and Win 1,500U 💥 #World Cup Predictions: 100,000 USDT Daily #HTX Invites You to Share 600K USDT in Gift Packs
1Поділитися
Усі коментарі0НовіПопулярно