Crypto Express
07/07 17:58
BONK Crypto To Rise 35%?
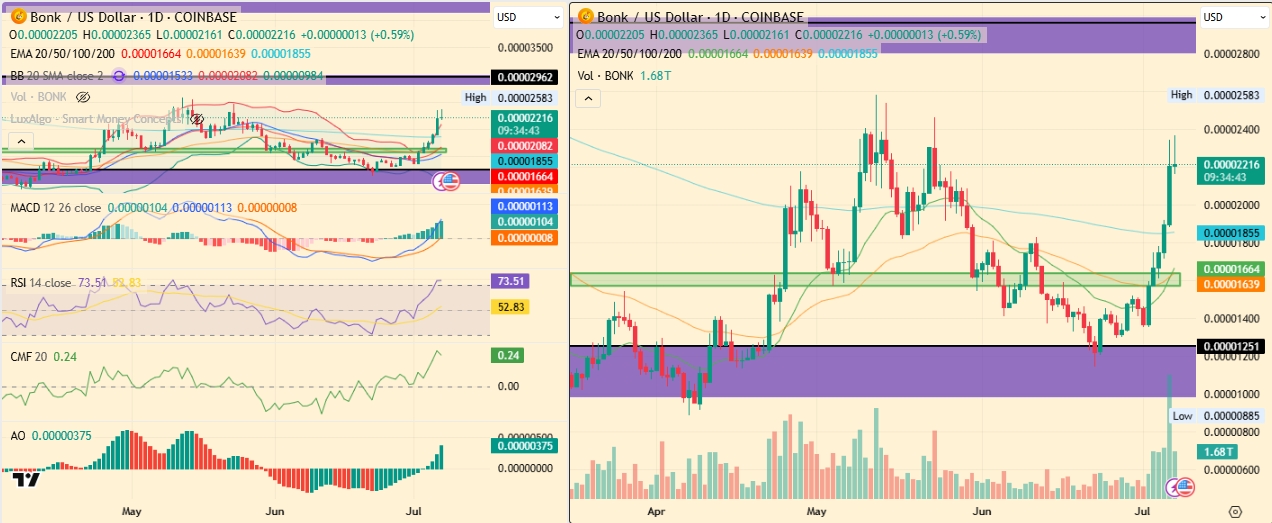
Currently, Bonk price can be seen exchanging hands at $0.00002240, comfortably breached above the 200-day dynamic EMA band while its upper boundary of the Bollinger Bands has also expanded upwards.
This bullish trend is further supported by majority of its technical indicators on BONK’s daily chart that reflect short-term strength. Like, the Chaikin Money Flow (CMF) is displaying a strong capital at 0.25. Both MACD and Awesome Oscillator histograms are trending upward.
Moreover, the RSI has peaked 73 to an overbought condition. Despite this, the upward trend suggests that buyers may remain active in the short term. but, a cooldown period towards 60 via a consolidation in BONK crypto price could also occur before another significant rise.
Bullish Scenario
If the support at $0.000022 holds and trading volumes return, Bonk could make a new push towards the relative highs around $0.000029, potentially yielding gains of 35%.
Bearish Scenario
Conversely, a clear breakdown below $0.0000190 would signal a return to previous trading ranges, increasing the risk of downward pressure towards the May lows and possibly down to the volume cluster at $0.0000158
#Join HTX On A Fitness Journey To Mars#Check In to Win a 20g Gold Bar#Claim1,200 USDT in the Monthly Creation Challenge
36Поділитися
Усі коментарі0НовіПопулярно