SilentEyes
06/20 16:23
PEPE Price Analysis On the daily chart, Pepe is f
PEPE Price Analysis
On the daily chart, Pepe is forming a base near the 38.20% Fibonacci retracement level at $0.00001026. This pattern hints at a potential double bottom, with the previous low formed on June 5.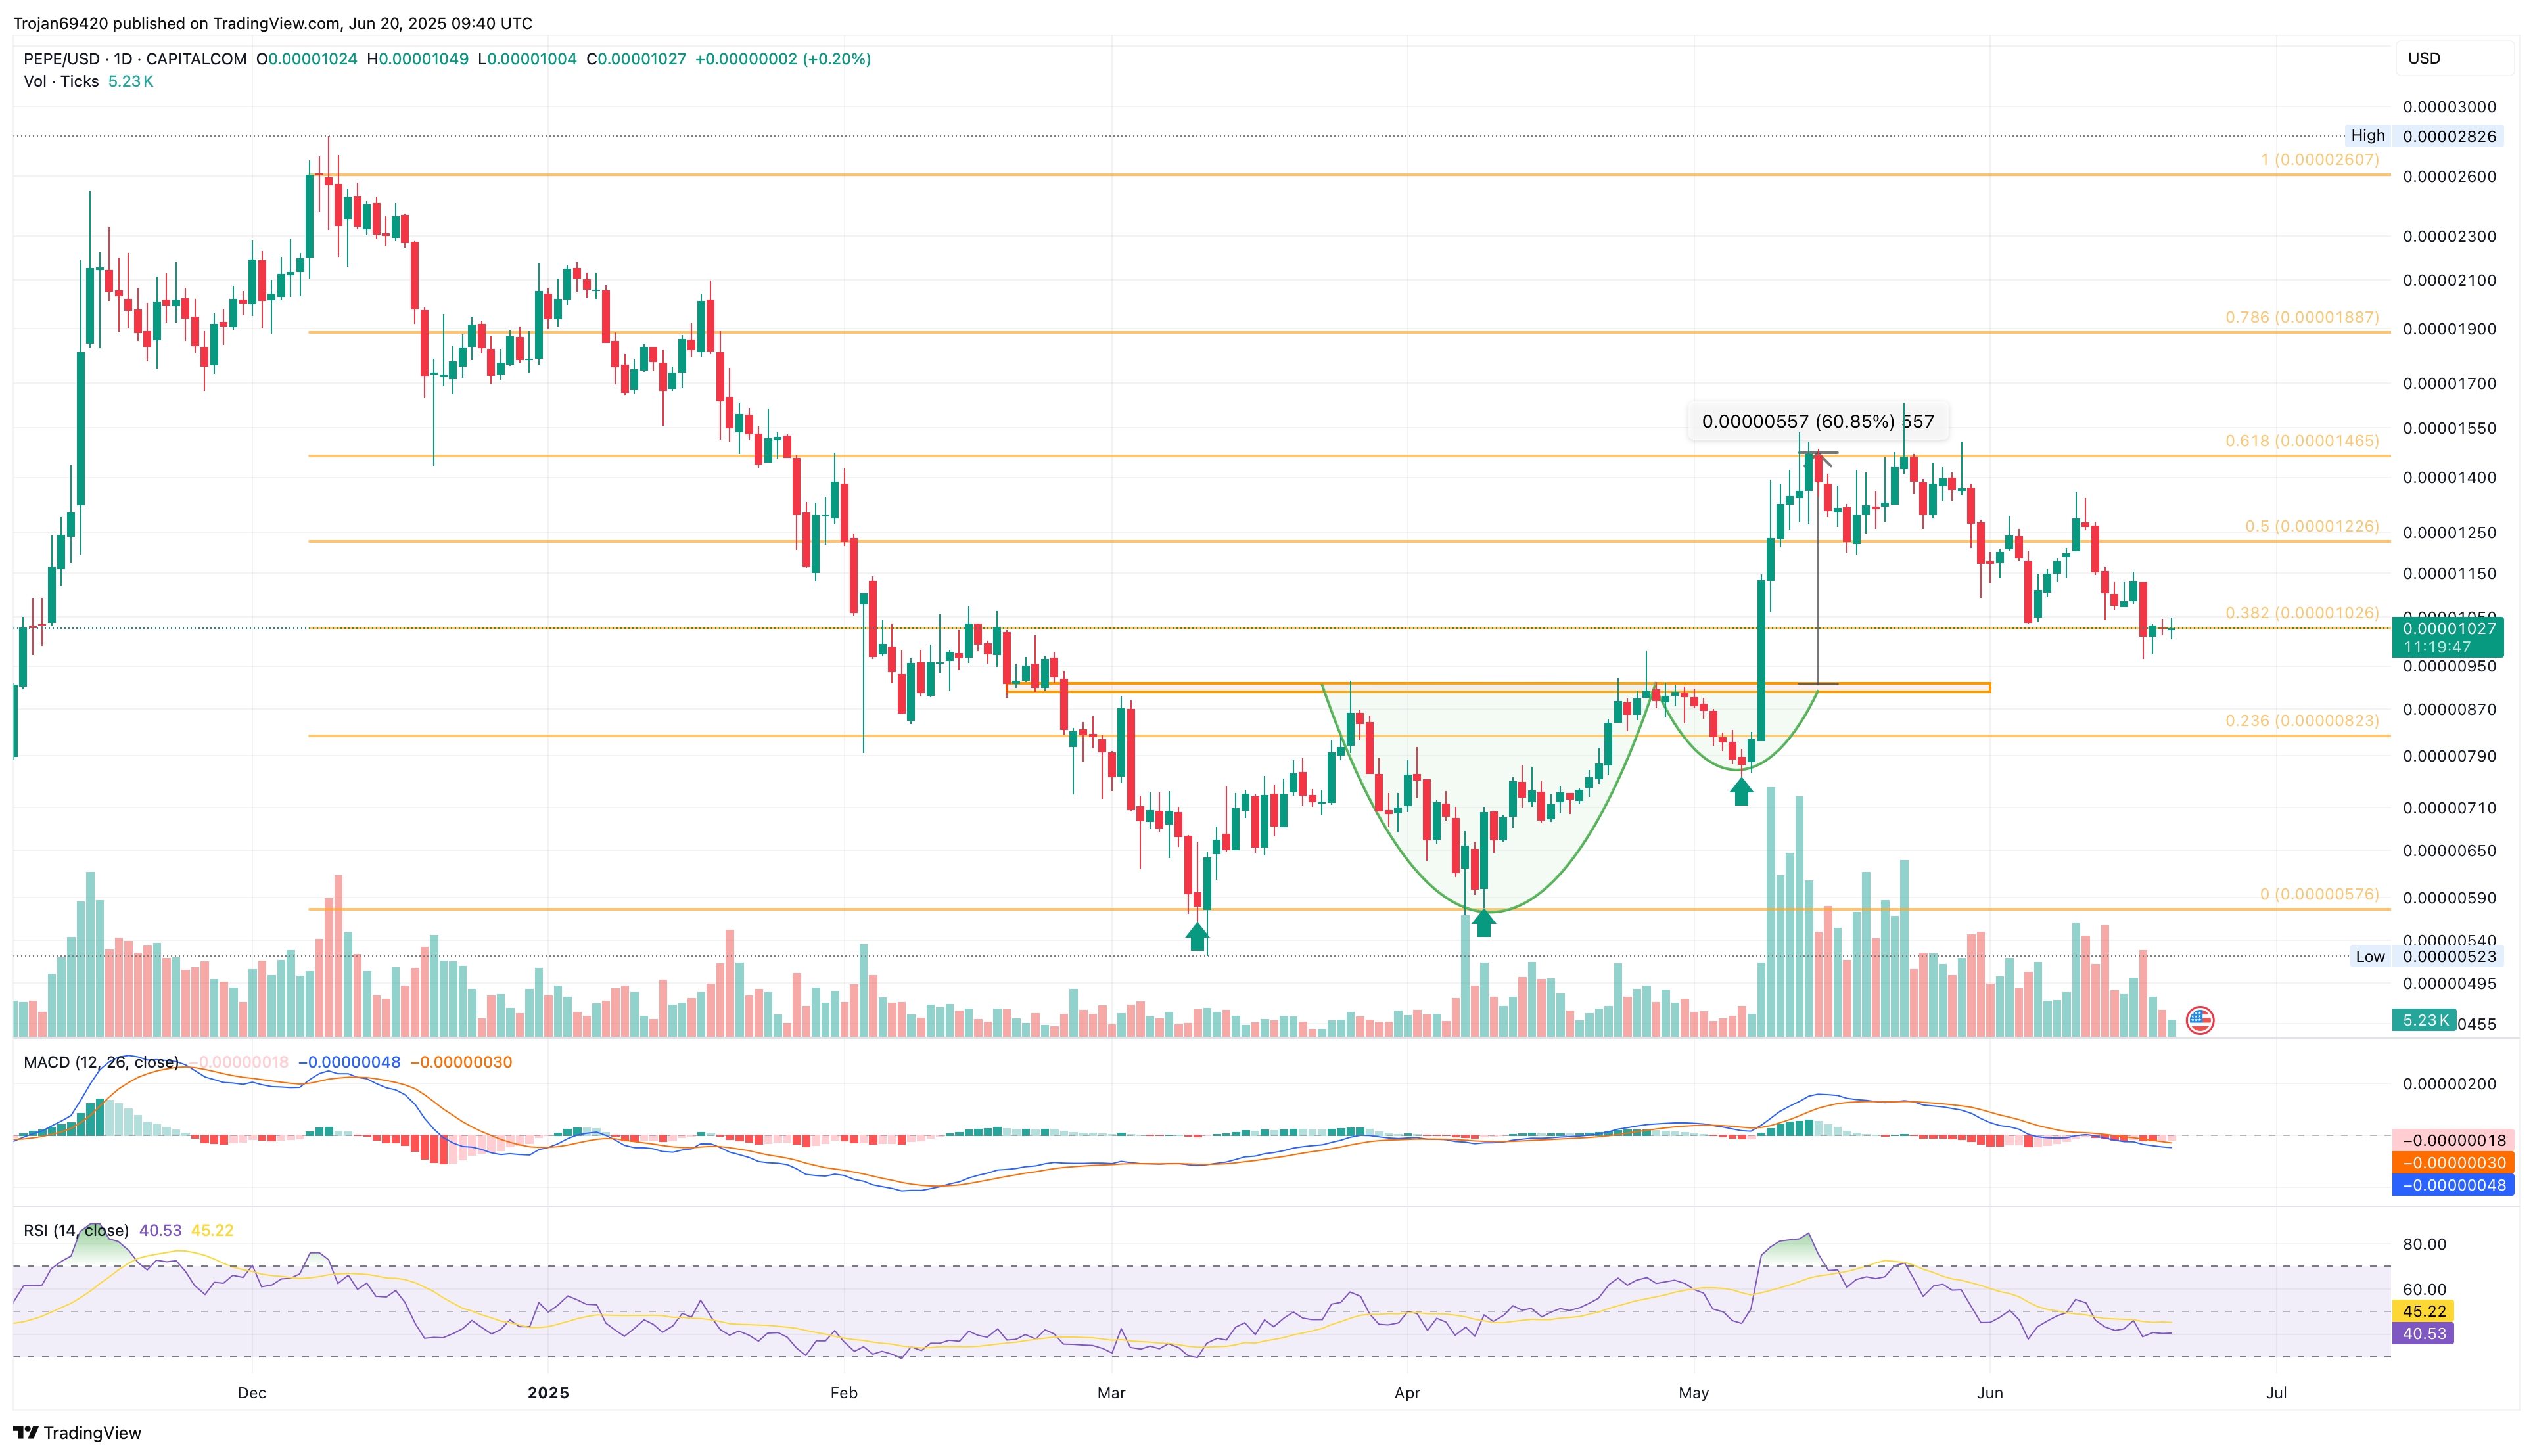
The daily RSI shows a minor bullish divergence between the two recent lower lows, supporting the reversal outlook. Similarly, the MACD and signal lines are converging, suggesting a possible bullish crossover and trend reversal.
Currently, Pepe is trading at $0.00001033, down 36% from its 30-day high of $0.00001630. Based on Fibonacci retracement levels, a potential bullish move could first challenge the 50% level at $0.00001226, followed by the 61.8% level at $0.00001465.
On the downside, if the psychological support fails, a deeper correction could test the 23.60% Fibonacci level at $0.00000823.
Усі коментарі0НовіПопулярно