Crypto Queen 👑
06/03 08:51
More bullish confluences surface Market indicator
More bullish confluences surface
Market indicators suggest that SHIB has a higher potential to rally, based on technical metrics such as the Bollinger Bands and the Money Flow Index.
The Bollinger Bands (BB), which help gauge whether an asset is overbought or oversold, indicate a possible rally. At the time of writing, SHIB was trading near the lower band, signaling oversold conditions—often a precursor to buyer interest.
This lower BB band also aligns with the key support level shown on the chart, adding further credibility to the pattern.Supporting the case for a potential rally is the increasing liquidity inflow into SHIB. At press time, the Money Flow Index (MFI) was at 35.67 and trending upward.
If this upward trend continues—especially if the MFI crosses above 50—it would indicate a strong liquidity inflow into the asset, signaling bullish momentum.
Still, the question remains: Are the bulls fully committed to SHIB, or is this only a temporary performance?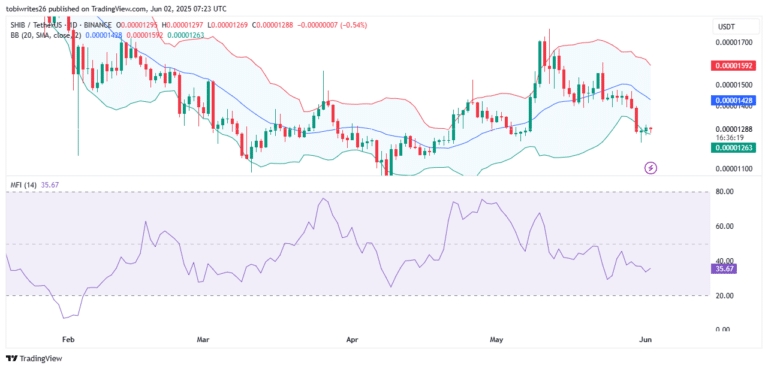
Усі коментарі0НовіПопулярно