Your Backtest Is Lying: Why You Must Use Point-in-Time Data

insights.glassnode2026-03-13 tarihinde yayınlandı2026-03-13 tarihinde güncellendi

Özet

This article warns against a common pitfall in backtesting trading strategies: look-ahead bias caused by using revised historical data. It illustrates this with a hypothetical Bitcoin strategy based on exchange outflows from Binance. The strategy is built on the premise that sustained outflows (when the 5-day moving average of BTC balance falls below the 14-day average) are bullish, while inflows signal a sell-off. An initial backtest using standard, revised data shows the strategy performing comparably to a simple buy-and-hold approach. However, the author argues these results are misleading because the data has been updated with information that wasn't available in real-time. This data mutation creates an unfair advantage in the backtest. To demonstrate, the test is rerun using Point-in-Time (PiT) data—an immutable, append-only record that reflects only what was known on any given day. The results are significantly worse, as the PiT-based strategy misses key profitable moves. The key takeaway is that accurate backtesting requires immutable Point-in-Time data to avoid look-ahead bias and replay history honestly.

Let's build a simple, hypothetical trading strategy. The premise is straightforward and rooted in a widely discussed narrative: when coins leave exchanges, it tends to be bullish. The reasoning is intuitive: coins moving off exchanges typically signal that holders are withdrawing to self-custody, reducing the available supply for selling. Conversely, coins flowing onto exchanges may indicate that holders are preparing to sell.

A single day of outflows, however, is just noise. To identify a genuine trend, we would apply a moving average crossover on the exchange balance. When the short-term average falls below the long-term average, it confirms that coins have been leaving exchanges consistently, as a sustained pattern, rather than isolated events.

Using Glassnode's exchange balance for Binance, we define the following:

  • Enter the market when the 5-day moving average of Binance's BTC balance falls below its 14-day moving average, signaling a sustained outflow trend.
  • Exit the market when the 5-day average rises back above the 14-day average, signaling that the outflow trend has reversed and coins are returning to the exchange.

We then benchmark this strategy against simply holding BTC over the same period, starting January 1, 2024 through March 9, 2026, with an initial capital of $1,000 and 0.1% trading fees applied to each trade.

This is a simplified trading strategy, designed primarily for illustrative purposes. It is not investment advice, nor is it meant to suggest that exchange balances are a robust foundation for a trading system.
Access live chart

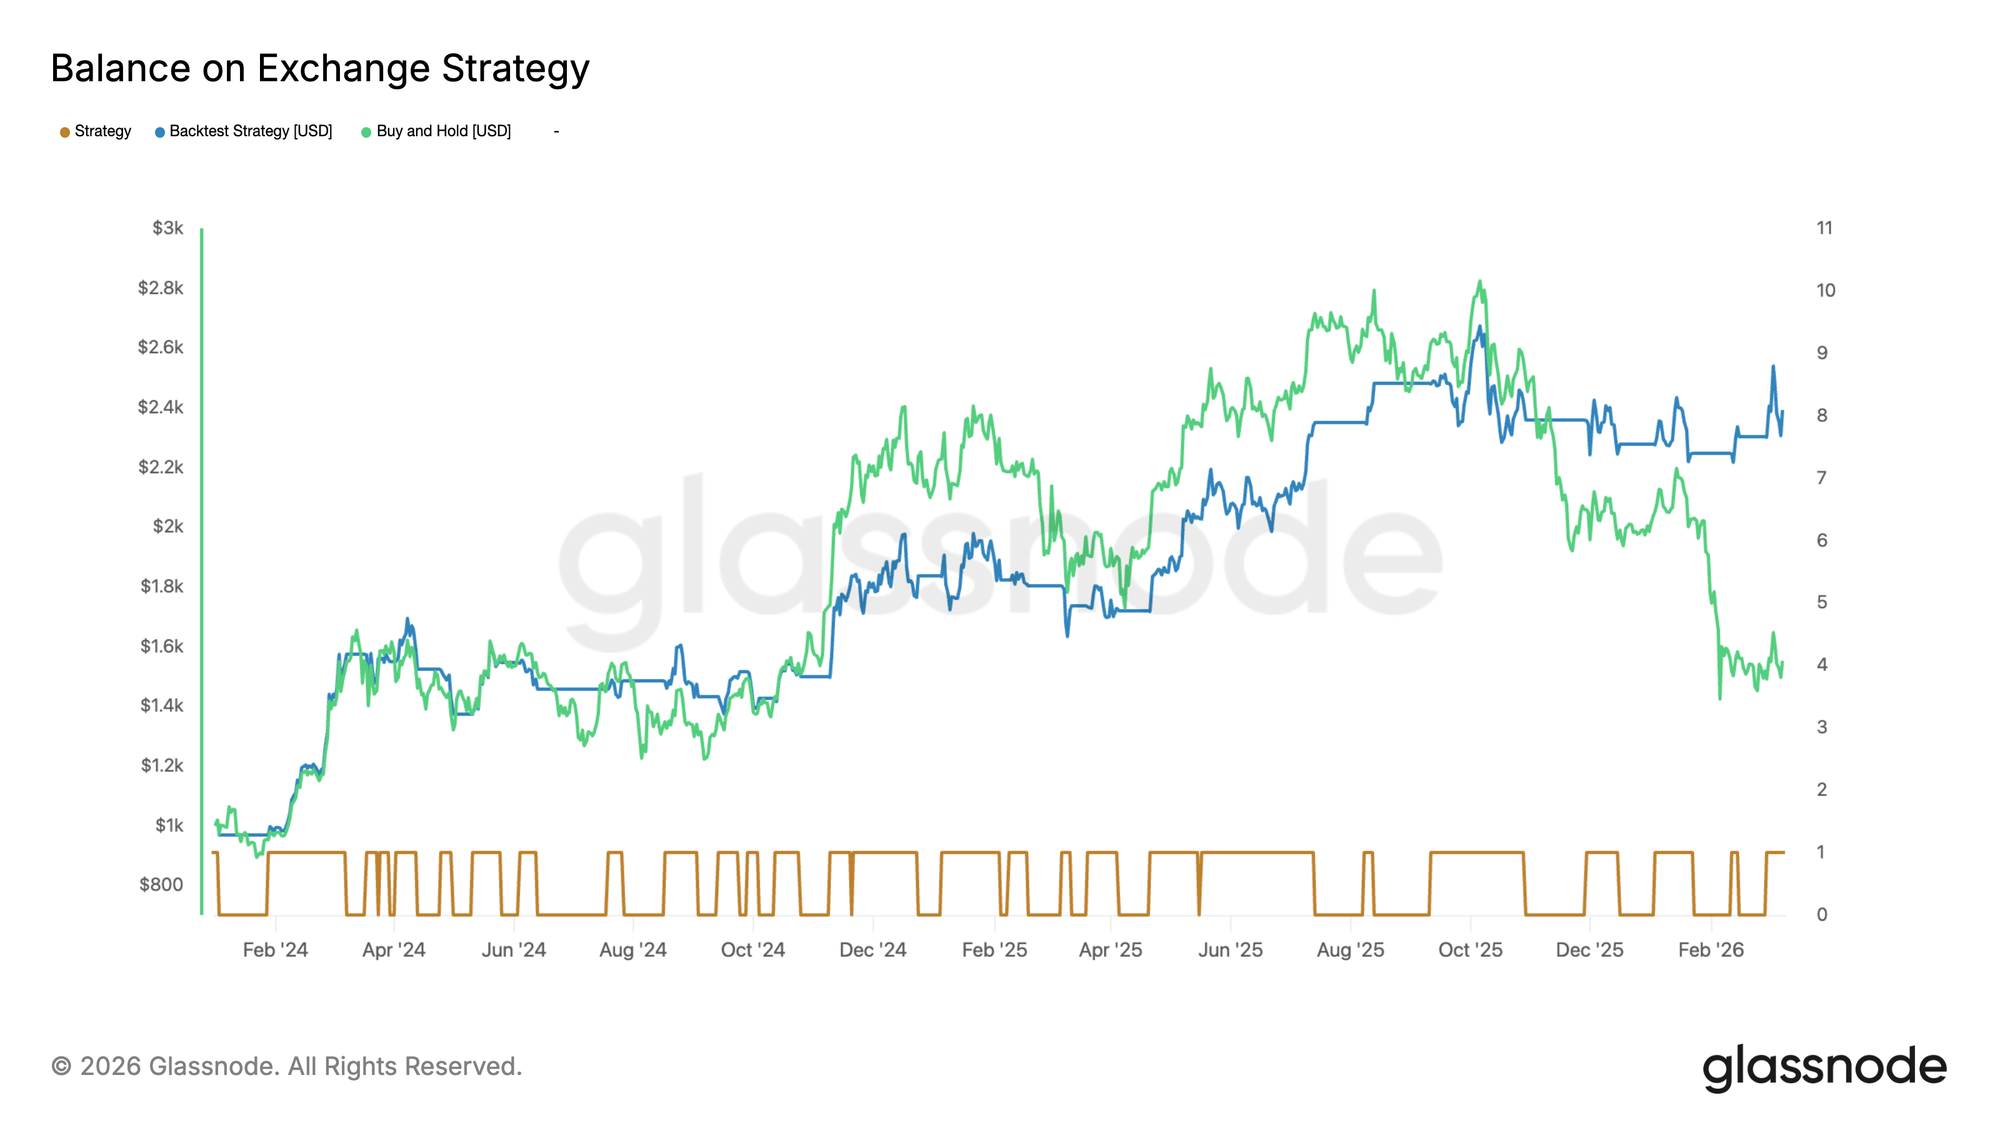
Here's how to read this chart:

🟫 The brown line at the bottom is the binary trading signal, toggling between in the market (1) and out of the market (0).

🟦 The blue line tracks the strategy's portfolio value over time.

🟩 The green line is the buy-and-hold portfolio benchmark.

We can observe that the exchange balance strategy performed reasonably well, although at times the buy-and-hold strategy outperformed it. In the final days of the research period, however, the exchange balance strategy caught up. While some investors may find the combination of reduced volatility and an ultimately comparable performance to buy-and-hold appealing, the final numbers are misleading – and here’s why.

The Problem: Data Mutation and Look-Ahead Bias

Metrics are not static. Many are retroactively revised as new information becomes available. This is particularly true for metrics that depend on address clustering or entity labeling, such as on-chain exchange balances. However, it is also the case for metrics such as trading volume or price, as individual exchanges can occasionally submit their data with slight delays.

This means that a value you see today for, say, January 15, 2024, may not be the same value that was published on January 15, 2024. The data has been revised with hindsight. When you backtest a strategy on this revised data, you are implicitly using information that was not available at the time the trading decisions would have been made. This introduces a look-ahead bias.

The Honest Backtest: Using Point-in-Time Data

Let's therefore repeat the exact same backtest – same signal logic, same parameters, same dates, same fees – but this time using the Point-in-Time (PiT) variant of the Exchange Balance metric, available in Glassnode Studio.

PiT metrics are strictly append-only and immutable. Each historical data point reflects only the information that was known at the time it was first computed. No retroactive revisions, no look-ahead bias.

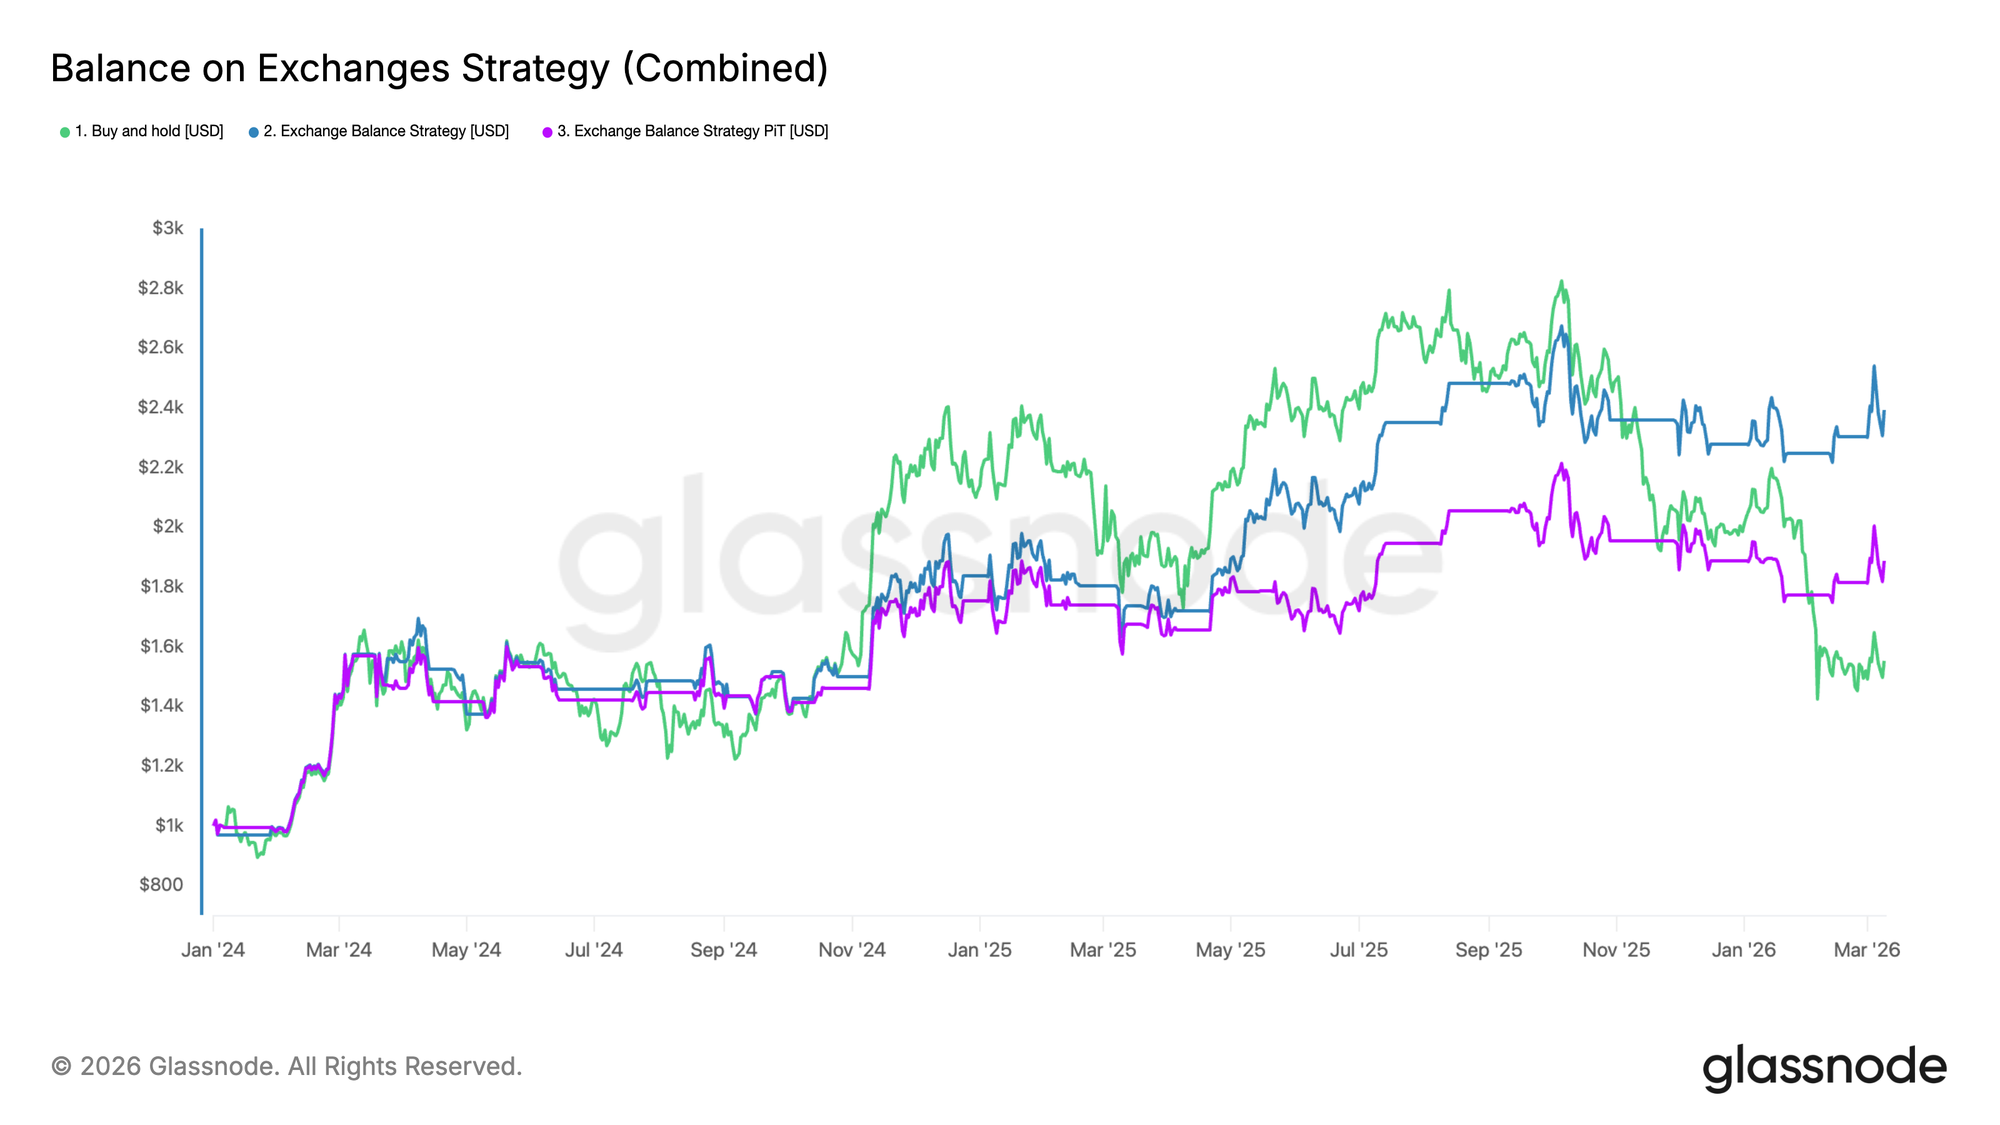
While we are using the same metric, the strategy now produces significantly different results, as illustrated by the purple line in the new chart below. The overall performance is notably worse.

Although both strategies behave similarly for much of 2024, we observe that the PiT-based version fails to capture the strong upticks in November 2024 and March 2025 as effectively. As a result, the cumulative performance diverges meaningfully and ends up considerably lower.

Access live chart

Key Takeaway

In this example, the purple strategy, which only has access to information as it was available at the time, performs noticeably worse. ► Backtests will lie if fed with wrong or revised data. Only immutable, Point-in-Time metrics ensure you’re replaying history as it actually happened.

İlgili Sorular

QWhat is the main problem with using revised data for backtesting a trading strategy?

AThe main problem is that it introduces look-ahead bias, as the revised data includes information that was not available at the time the trading decisions would have been made.

QHow does the Point-in-Time (PiT) data differ from the standard exchange balance metric?

APoint-in-Time data is strictly append-only and immutable, meaning each historical data point reflects only the information known at the time it was first computed, with no retroactive revisions.

QWhat was the trading signal used in the hypothetical strategy based on exchange balances?

AThe strategy entered the market when the 5-day moving average of Binance's BTC balance fell below its 14-day moving average, and exited when the 5-day average rose back above the 14-day average.

QWhy did the backtest using Point-in-Time data perform worse than the one using revised data?

AThe PiT-based strategy failed to capture strong market upticks as effectively because it only had access to information available in real-time, without the benefit of hindsight revisions.

QWhat is the key takeaway from the article regarding backtesting and data quality?

ABacktests will produce misleading results if fed with revised data; only immutable, Point-in-Time metrics ensure an accurate replay of history as it actually happened.

İlgili Okumalar

AI PC Battle: Bet on the Toll Booth, Not the Camp

**Title:** The AI PC Battle: Don't Bet on Sides, Bet on the Tollbooth **Summary:** The AI PC competition is moving beyond simple "x86 vs. Arm" narratives. The core investment thesis should focus on identifying which players can sustain margins, cash flow, and pricing power throughout the upgrade cycle, rather than backing a particular architecture. The opportunity is analyzed in three layers: 1. **The Advanced Foundry Tollbooth:** TSMC is positioned to collect "tolls" regardless of which chip designer wins, due to its dominant ~70% share in advanced semiconductor manufacturing, which is essential for high-end AI PC chips. 2. **Compute & Platform Spillover:** AMD represents an offensive in the x86 CPU+GPU space, while NVIDIA leverages its GPU and CUDA software stack dominance. Both benefit from the demand for increased local AI compute. 3. **Architecture Diffusion & Turnaround Plays:** ARM and Intel offer potential for significant upside (elasticity), but investments here require stricter discipline due to higher execution risks and competitive challenges. The industry is transitioning from concept to shipment validation. While short-term forecasts for AI PC adoption have been revised down slightly due to tariffs and procurement delays, the long-term trend towards AI becoming a standard PC feature remains intact. The key driver for upgrade cycles will be whether compelling enterprise applications (e.g., privacy-sensitive computing, low-latency inference) emerge beyond consumer-focused features like meeting summarization. Investment strategy should prioritize companies with platform-level advantages and recurring revenue streams. TSMC offers high certainty as the foundational tollbooth. AMD presents a strong offensive play within the established ecosystem. ARM and Intel are higher-risk, higher-potential-reward turnaround bets. The report cautions against chasing short-term hype and emphasizes a disciplined, long-term approach focused on buying ecosystem strength and cash-flow certainty after market enthusiasm subsides. **Key Risks:** Underwhelming AI PC applications slowing upgrade cycles; slow improvement in Windows on Arm compatibility; macro/tariff impacts on PC demand; potential advanced node supply-demand mismatches affecting TSMC; high overall AI sector valuations making stocks vulnerable to a risk-off shift in markets.

marsbit2 dk önce

AI PC Battle: Bet on the Toll Booth, Not the Camp

marsbit2 dk önce

Ten-Thousand-Word Analysis: From $10 to $290, MRVL Wins the Entire AI Era by 'Not Making GPUs'

Marvell Technology's stock price surged from under $10 in 2016 to a record $290 in June 2026, fueled not by making GPUs, but by dominating AI infrastructure connectivity. This analysis argues the market misvalues MRVL as merely a smaller Broadcom in custom AI chips, overlooking its true, unique position. Marvell's core strength lies in enabling high-speed data flow for AI clusters through three interconnected businesses. First, it holds a commanding ~70% market share in high-speed optical DSPs (essential for data center light modules), a deep-moat business with accelerating growth. Second, its custom AI chip design business serves hyperscalers like AWS, Microsoft, and Google, with a significant revenue pipeline despite lower margins. Third, stable cash flows come from Ethernet switch chips and enterprise storage controllers. Together, they form a full-stack "AI data movement" platform. CEO Matt Murphy's transformative leadership since 2016, involving strategic divestments, key acquisitions (like Inphi for optical DSPs), and securing long-term agreements with major cloud providers, repositioned the company. A pivotal $2 billion strategic investment from NVIDIA in 2026 underscored Marvell's critical role in the AI ecosystem, particularly through collaborations like NVLink Fusion. While Marvell faces risks—including client concentration (losing the Amazon Trainium3 design), lower-margin business mix, competitive threats, insider selling, and complex supply chains—its fundamentals remain strong. The optical interconnect moat is widening with the acquisition of Celestial AI (photonics fabric), and financial metrics show accelerating revenue growth and operating leverage. With a PEG ratio suggesting undervaluation relative to its growth, the thesis is that the market undervalues Marvell's monopolistic position in AI "plumbing" while overemphasizing its competitive custom chip segment. The story transcends investing, symbolizing how in any complex system—from the internet to AI—the value of "connection" ultimately surpasses that of individual "nodes."

marsbit31 dk önce

Ten-Thousand-Word Analysis: From $10 to $290, MRVL Wins the Entire AI Era by 'Not Making GPUs'

marsbit31 dk önce

AI Relay Stations Spark Heated Debate on Zhihu: Behind Cheap Tokens, What Are Users Really Worried About?

A discussion on Zhihu about "AI relay stations" shifted the niche developer topic of "cheap tokens" into broader user awareness. Users moved beyond simply questioning the legitimacy of these services to focus on practical concerns: Where do cheap tokens truly come from? Is the model being accessed the real one? Can relay stations see prompts, code, and API keys? For occasional users, are the risks worth it? The core debate centered less on price and more on trust. A primary worry is model authenticity—the risk of "model swapping," where users paying for a premium model might be routed to a cheaper one, creating an information asymmetry. Others argued that cost comparisons matter; while cheaper than official pay-as-you-go APIs, relay stations may not be the lowest-cost option versus subscriptions, domestic models, or free tiers, making user needs assessment crucial. Speculation about token sources ranged from legitimate bulk discounts to gray-area methods like account sharing or exploiting regional pricing. This opacity makes risk assessment difficult for users. Data security emerged as a critical concern, especially for enterprise use. When processing sensitive information like code, contracts, or client data, the inability to verify a relay station's data handling, retention, or access policies poses significant compliance and confidentiality risks. The evolving consensus suggests relay stations can be used cautiously for low-sensitivity, disposable tasks (e.g., summarizing public info, simple translation). However, they should not be the default for sensitive, professional, or production workflows involving proprietary data, Agents, or automated systems. Recommendations include avoiding large prepayments, not relying on a single service, using test prompts to monitor quality, anonymizing data where possible, and keeping official channels as backups. Ultimately, the discussion framed tokens not just as a billing unit but as a measure of real cost encompassing price, model integrity, data security, and service stability. The popularity of relay stations highlights user demand for affordable access, but the debate underscores a key trade-off: the savings from cheap tokens may come at the price of trust, transparency, and control over one's data and AI experience.

marsbit1 saat önce

AI Relay Stations Spark Heated Debate on Zhihu: Behind Cheap Tokens, What Are Users Really Worried About?

marsbit1 saat önce

In-Depth Research Report on TradFi: The Convergence Wave of Crypto and Traditional Finance

In 2026, the crypto industry is undergoing a profound infrastructure-level transformation—TradFi assets are migrating on-chain at an unprecedented pace. According to CoinGecko's Q1 2026 report, the total value locked (TVL) of tokenized real-world assets (RWA) has surpassed $31 billion, a nearly 4x increase from $7.8 billion at the beginning of 2025, with the sector’s aggregate market capitalization reaching $19.3 billion. Among these, the market cap of tokenized stocks surged from $2 million to $486 million, with Q1 spot trading volume reaching $15.1 billion—a single quarter already surpassing the entire second half of 2025. RWA perpetual contract Q1 trading volume reached a staggering $524.8 billion, far exceeding the $313 billion for all of 2025. Meanwhile, BlackRock's BUIDL fund has reached $2.3 billion in scale and has filed for two new tokenized funds, signaling that the world's largest asset manager's tokenization strategy is evolving from pilot to product suite expansion. HTX, as a core participant in the crypto exchange sector, officially launched TradFi perpetual futures products including NVDA, AAPL, MSFT, META, and SPY in 2026, enabling crypto users to gain 24/7 trading access to core U.S. equities. Boston Consulting Group predicts that global tokenized asset scale could reach $16 trillion by 2030, while McKinsey offers a conservative estimate of approximately $2 trillion. The on-chain migration of TradFi assets is no longer a "future narrative" but a structural transformation unfolding in real time, as crypto exchanges evolve from single crypto asset trading platforms toward "multi-asset-class trading infrastructure."

HTX Learn1 saat önce

In-Depth Research Report on TradFi: The Convergence Wave of Crypto and Traditional Finance

HTX Learn1 saat önce

İşlemler

Spot
Futures
活动图片