XRP Pundit Shares Why You Shouldn’t Get Tricked By The Price Rebound

bitcoinist2026-03-25 tarihinde yayınlandı2026-03-25 tarihinde güncellendi

Özet

A crypto analyst, CasiTrades, warns that the recent XRP price rebound may be a temporary bounce and a potential bull trap. Despite the uptrend driven by positive macro conditions and Bitcoin's rise above $70,000, XRP has broken below a key bullish trendline, which is now acting as resistance. This break suggests the recovery could be a short-lived "subwave 2 bounce," often followed by further declines. If rejected at resistance levels of $1.40-$1.41 or $1.51-$1.55, the price could crash around 40% to major support near $0.87. The analyst concludes that unless XRP breaks and holds above $1.65 resistance, a significant downturn is likely.

Recently, the XRP price has been in an uptrend, spurred on by the improving macro political climate and the Bitcoin price crossing $70,000. But while this move has brought some much-needed positive sentiment back into the market, one analyst is calling for caution during this time. The call points to the fact that the move above $1.4 might be only temporary and that the price downtrend will resume in short succession, trapping investors in their positions.

The XRP Trendline To Watch For A Lower Break

Over the last few weeks, the XRP price had formed an interesting trendline, which crypto analyst CasiTrades had called out. At a point, the XRP price was still trading above the trendline, suggesting that the trend was still very bullish. However, the digital asset has now seen its price fall below this trendline, putting it in a very perilous position.

CasiTrades explains that the price break below this trendline has seen it begin to act more like resistance at this level. If that is the case, it means that the price might not be able to break out of it, and if it is pushed down, then it could trigger another wave down.

The recent price recovery, the crypto analyst explains, could be a subwave 2 bounce. Such a bounce is historically short-lived and actually tends to give way to more declines. As a result, at the first sign of resistance, it is possible that the XRP price will be harshly rejected, triggering the next move down.

Source: X

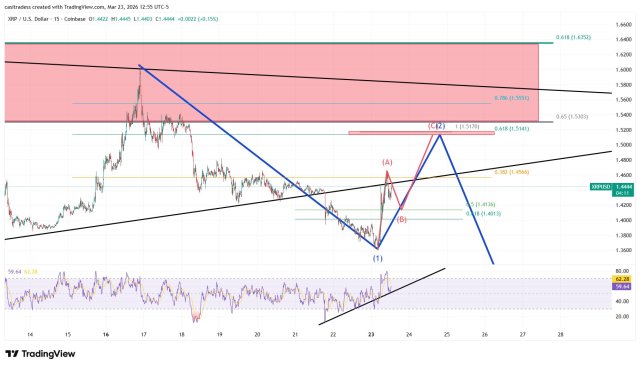
Such a move would eventually see no support above the $1, and this would leave room for the bears to drag the price further down. In fact, the crypto analyst says that the next major support on the leg down lies around $0.87. This would constitute a 40% crash from current levels at the time of writing.

As for levels to watch, CasiTrades says to keep an eye on $1.40-$1.41 for the B wave. For the C wave, the major levels to watch are $1.51-$1.55, and these targets are for the short-term. “Either we head down to $0.87, or we somehow break and hold $1.65 resistance,” the analyst stated.

Price resumes uptrend | Source: XRPUSDT on Tradingview.com

İlgili Sorular

QAccording to the analyst CasiTrades, what is the significance of XRP's price falling below the identified trendline?

AThe price break below the trendline suggests it has begun to act as resistance, indicating a potential failure to break out and a possible trigger for another downward wave.

QWhat does the analyst refer to as a 'subwave 2 bounce' and what is its typical outcome?

AA 'subwave 2 bounce' is a short-lived price recovery that historically tends to give way to more declines, often resulting in a harsh rejection at the first sign of resistance.

QWhat is the next major support level for XRP if the price downtrend resumes, and what percentage drop would that represent from the current price mentioned?

AThe next major support level is around $0.87, which would constitute a 40% crash from the current price levels at the time of writing.

QWhat are the two possible price targets for the short-term B wave and C wave that investors should watch, according to the analysis?

AFor the B wave, watch $1.40-$1.41. For the C wave, watch $1.51-$1.55.

QWhat two ultimate price scenarios does the analyst CasiTrades outline for XRP?

AThe two scenarios are: the price heads down to $0.87, or it breaks and holds above the $1.65 resistance level.

İlgili Okumalar

İşlemler

Spot
Futures

Popüler Makaleler

T Nasıl Satın Alınır

HTX.com’a hoş geldiniz! Threshold Network Token (T) satın alma işlemlerini basit ve kullanışlı bir hâle getirdik. Adım adım açıkladığımız rehberimizi takip ederek kripto yolculuğunuza başlayın. 1. Adım: HTX Hesabınızı OluşturunHTX'te ücretsiz bir hesap açmak için e-posta adresinizi veya telefon numaranızı kullanın. Sorunsuzca kaydolun ve tüm özelliklerin kilidini açın. Hesabımı Aç2. Adım: Kripto Satın Al Bölümüne Gidin ve Ödeme Yönteminizi SeçinKredi/Banka Kartı: Visa veya Mastercard'ınızı kullanarak anında Threshold Network Token (T) satın alın.Bakiye: Sorunsuz bir şekilde işlem yapmak için HTX hesap bakiyenizdeki fonları kullanın.Üçüncü Taraflar: Kullanımı kolaylaştırmak için Google Pay ve Apple Pay gibi popüler ödeme yöntemlerini ekledik.P2P: HTX'teki diğer kullanıcılarla doğrudan işlem yapın.Borsa Dışı (OTC): Yatırımcılar için kişiye özel hizmetler ve rekabetçi döviz kurları sunuyoruz.3. Adım: Threshold Network Token (T) Varlıklarınızı SaklayınThreshold Network Token (T) satın aldıktan sonra HTX hesabınızda saklayın. Alternatif olarak, blok zinciri transferi yoluyla başka bir yere gönderebilir veya diğer kripto para birimlerini takas etmek için kullanabilirsiniz.4. Adım: Threshold Network Token (T) Varlıklarınızla İşlem YapınHTX'in spot piyasasında Threshold Network Token (T) ile kolayca işlemler yapın.Hesabınıza erişin, işlem çiftinizi seçin, işlemlerinizi gerçekleştirin ve gerçek zamanlı olarak izleyin. Hem yeni başlayanlar hem de deneyimli yatırımcılar için kullanıcı dostu bir deneyim sunuyoruz.

373 Toplam GörüntülenmeYayınlanma 2024.12.10Güncellenme 2025.03.21

T Nasıl Satın Alınır

Tartışmalar

HTX Topluluğuna hoş geldiniz. Burada, en son platform gelişmeleri hakkında bilgi sahibi olabilir ve profesyonel piyasa görüşlerine erişebilirsiniz. Kullanıcıların T (T) fiyatı hakkındaki görüşleri aşağıda sunulmaktadır.

活动图片