Why can’t Ethereum hold $3K? ETH recovery in doubt as data tilts bearish

cointelegraph2025-12-16 tarihinde yayınlandı2025-12-16 tarihinde güncellendi

Özet

Ether (ETH) has been struggling to hold above the $3,000 level, facing resistance and declining momentum. Key factors contributing to this bearish pressure include a lack of demand in futures markets, aggressive selling by long-term holders, and reduced on-chain activity. The 50-day EMA at $3,260 is acting as a major resistance level, while support lies around $2,800. If this support breaks, technical analysis suggests a potential drop to $2,300 or lower. Additionally, Ethereum network fees have decreased significantly, reflecting weaker demand. Without a strong break above key resistance levels, ETH’s recovery remains uncertain, with further downside risk.

Ether (ETH) has oscillated around $3,000 for the past three weeks, a consolidation period following its flash crash to $2,620 on Nov. 21. Ether traders are now questioning the likelihood of a further correction if support at $2,800 is lost.

Key takeaways:

  • Ether slid below $3,000 again due to a lack of futures demand and aggressive selling by long-term holders.

  • Declining Ethereum network fees and activity suggest lower onchain demand.

  • Weak technical setups warned of a drop to $2,300 if the next support is lost.
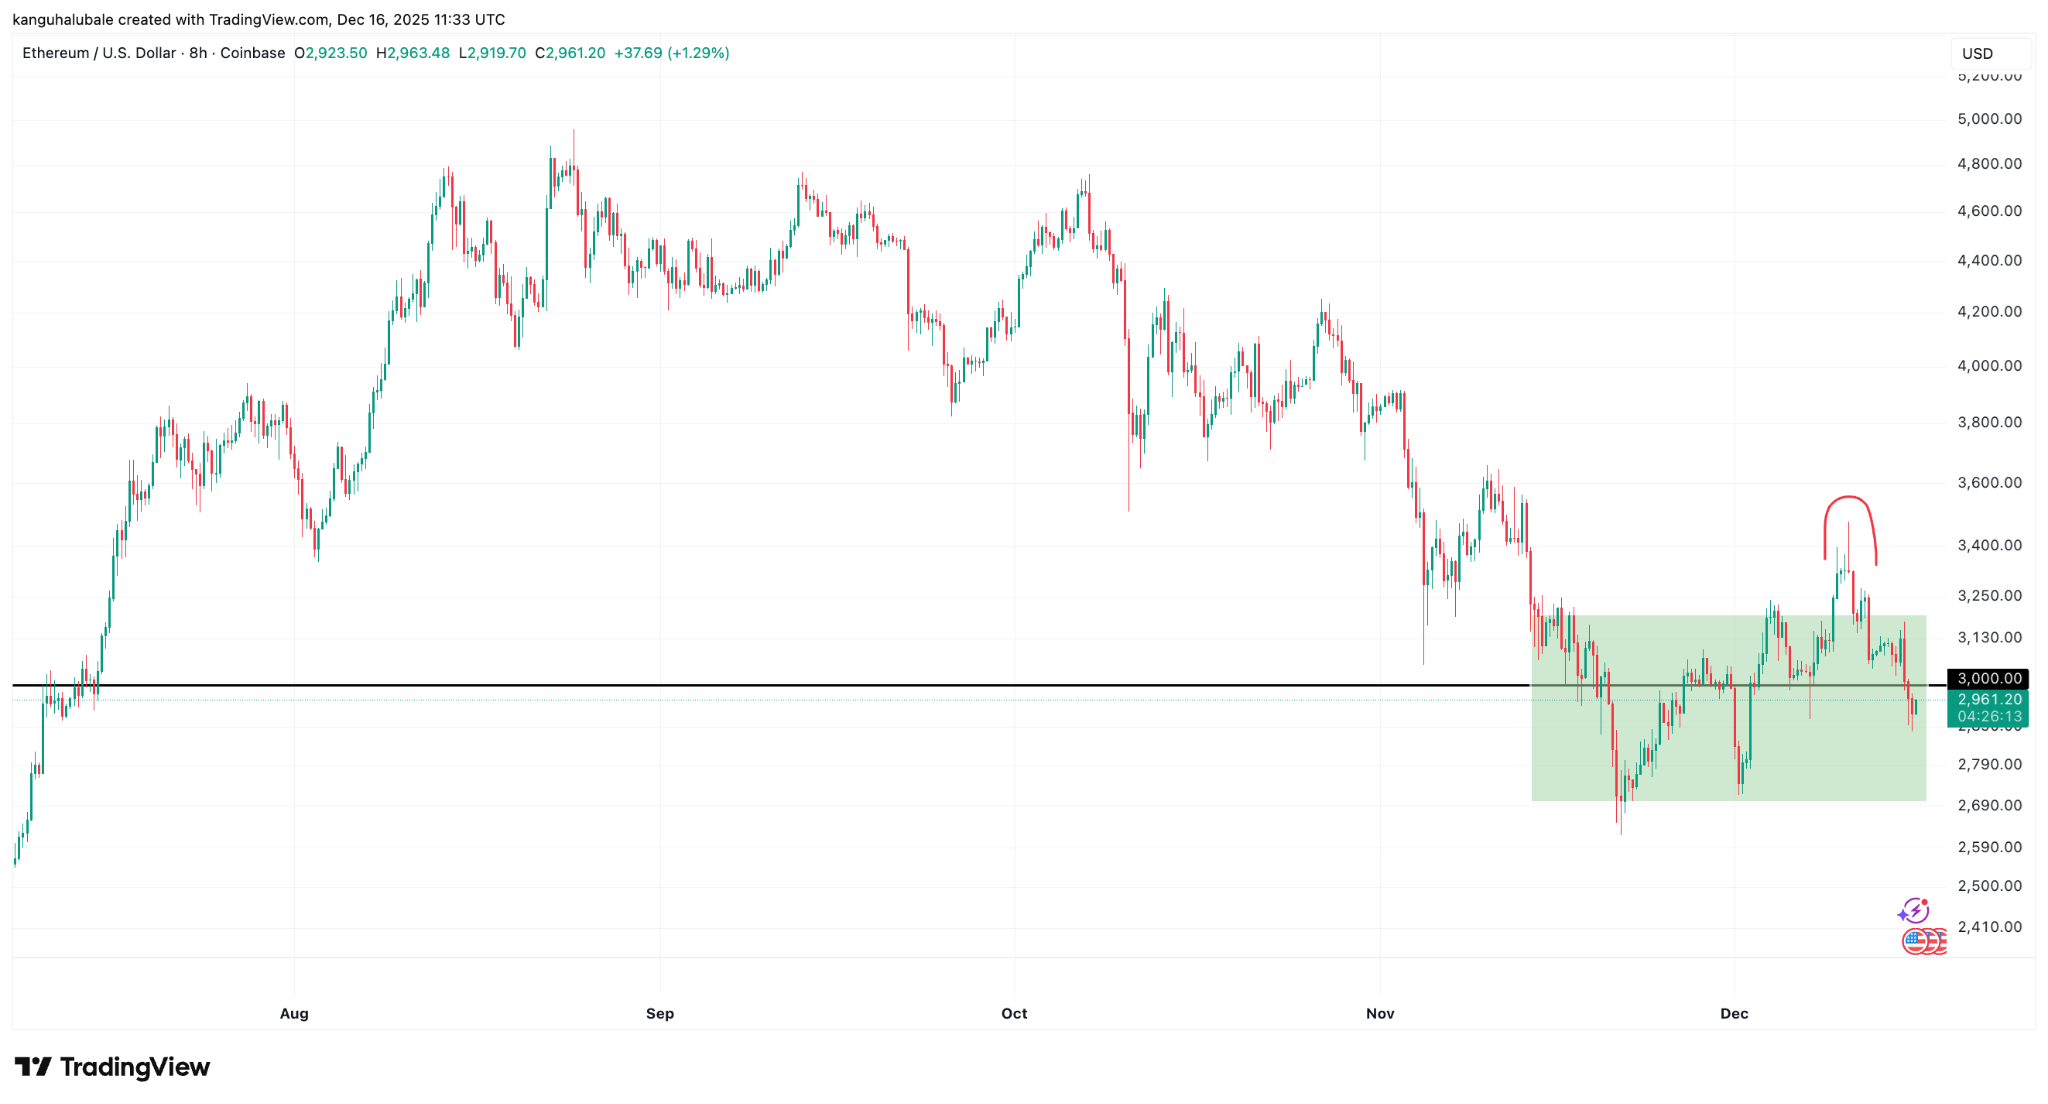
ETH/USD price chart. Source: Cointelegraph/TradingView


ETH price stuck between two trendlines

Ether’s recent recovery was rejected by resistance from the 50-day exponential moving average (EMA), which currently sits at $3,260, as shown on the daily chart below.

Related: Ether price trend forecasts triple-digit rally as ETH ETF inflows resume

This move, however, saw ETH/USD find support from the $2,800-$2,600 demand zone. The 200-week EMA is currently within this zone.
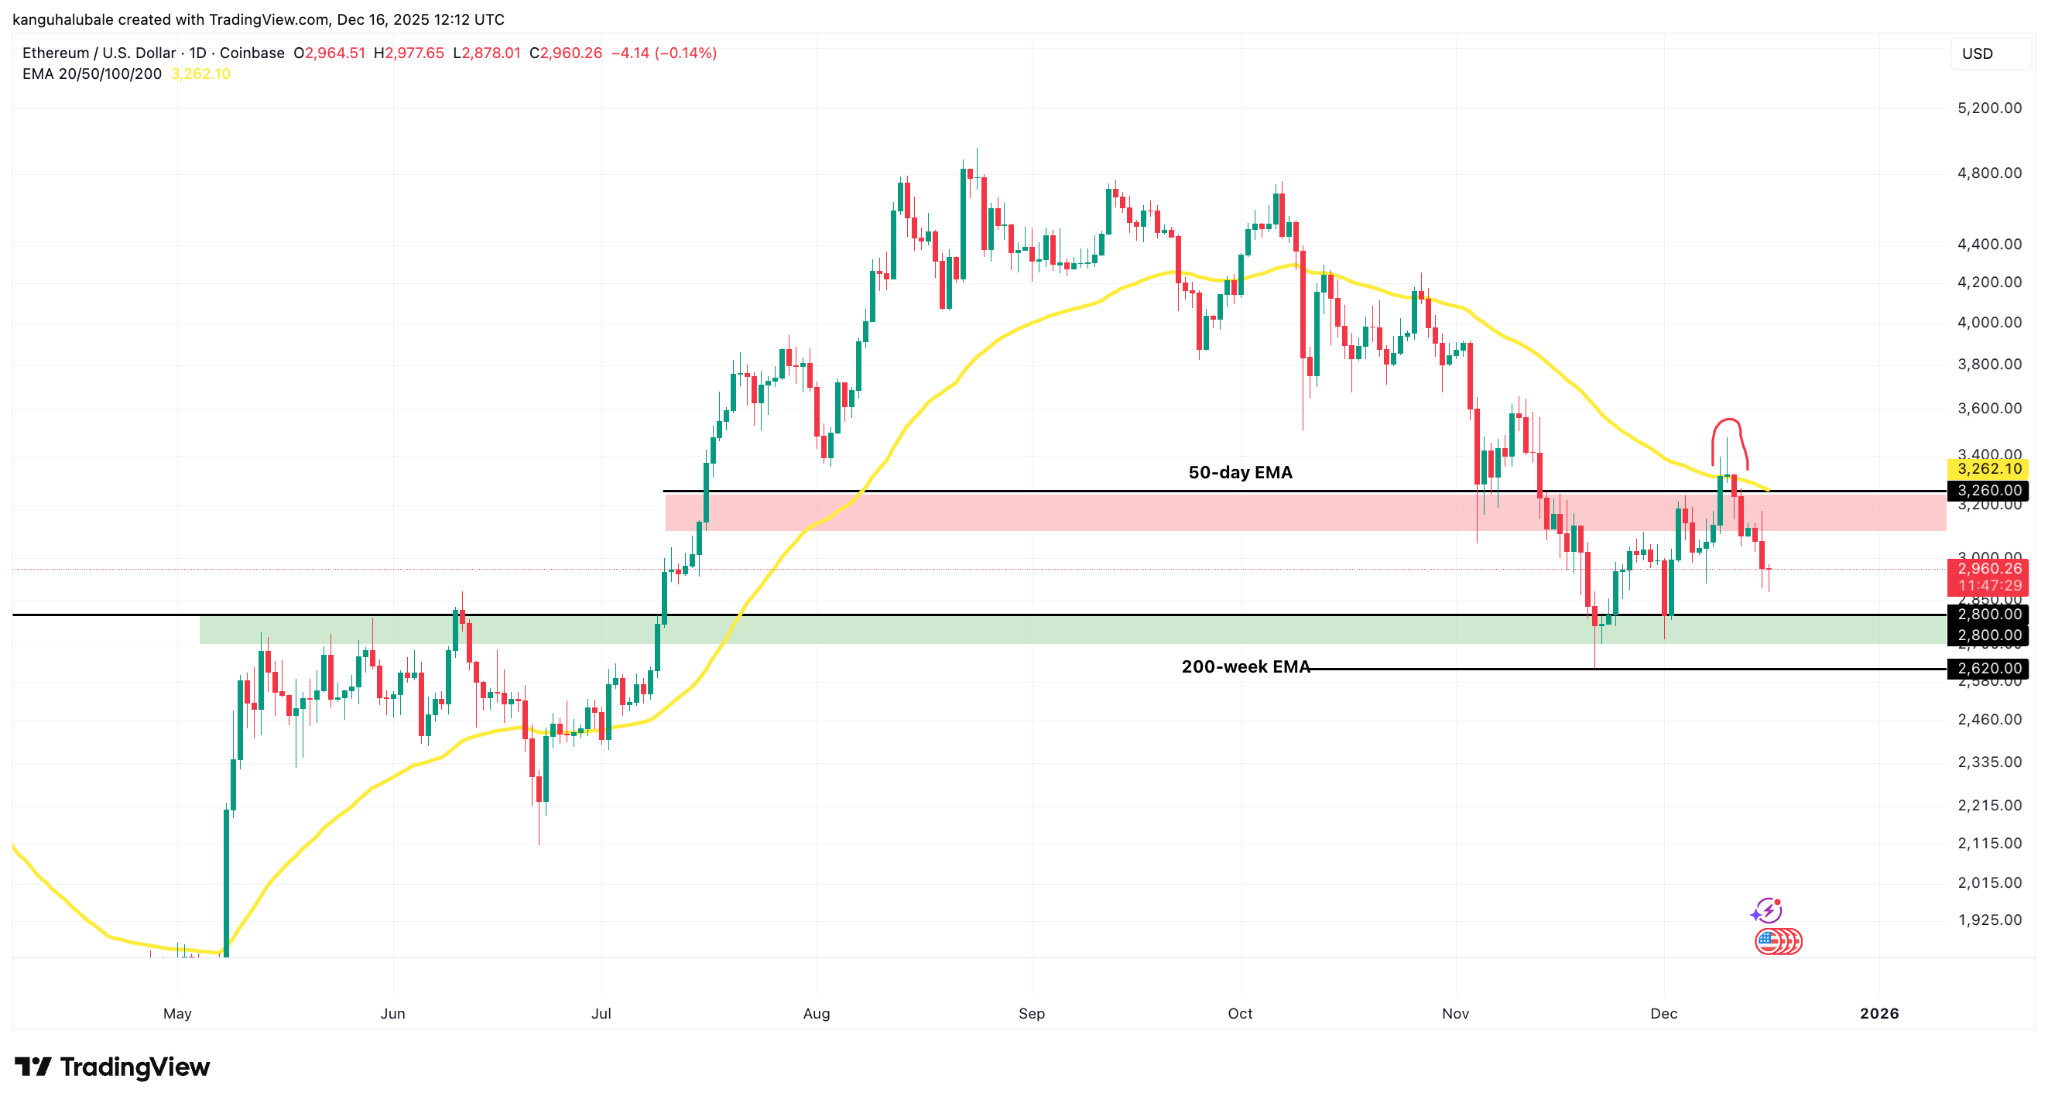
ETH/USD daily chart. Source: Cointelegraph/TradingView

ETH must rise above the resistance at $3,000 and surpass the 50-day EMA to break out of consolidation for a sustained recovery toward $4,000.

The Glassnode cost basis distribution heatmap showed resistance between $3,100 and $3,250, where investors acquired roughly 5.9 million ETH.

Ethereum: Cost basis distribution heatmap. Source: Glassnode

On the downside, the key support area is around $2,800, where 5.8 million ETH were previously purchased.

Ether price lacks bullish momentum

Ether futures are currently trading at a 3% premium relative to bearish ETH spot markets, reflecting declining demand from buyers using leverage.

In bearish market conditions, futures premiums typically stay below 5%, signaling weak demand for leveraged long positions and less optimism among traders.

More concerningly, even last week’s recovery to $3,750 did not restore sustained bullish sentiment among traders.

Ether annualized futures, three-month rolling basis. Source: Glassnode

The bearish trend in Ether futures coincided with a decline in long-term holder supply, which has decreased by 847,222 coins over the past 30 days, the largest drop since January 2021. This adds to the sell-side pressure that keeps ETH from staying above $3,000.
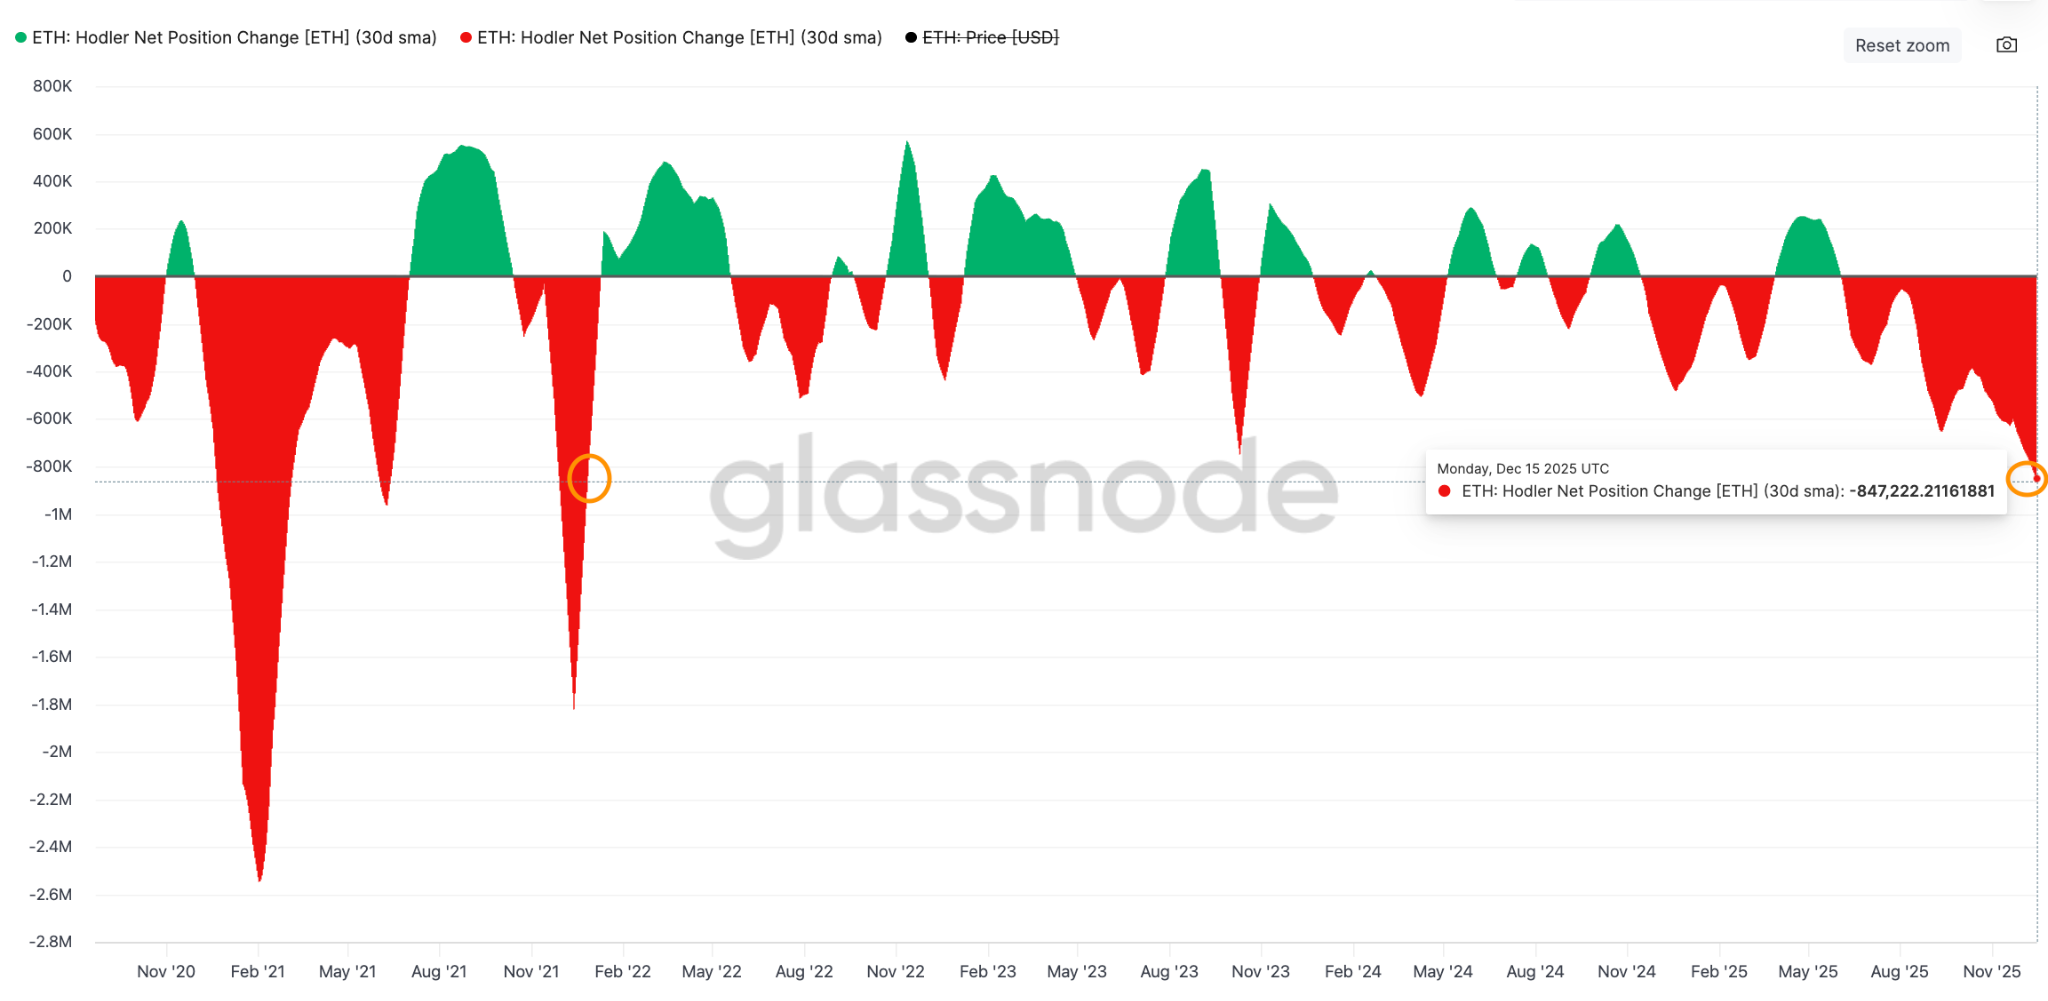
Ethereum 30-day rolling LTH supply change. Source: Glassnode

Ether’s inability to stay above $3,000 can also be attributed to the decline in Ethereum network fees, although this issue has affected the entire cryptocurrency market.
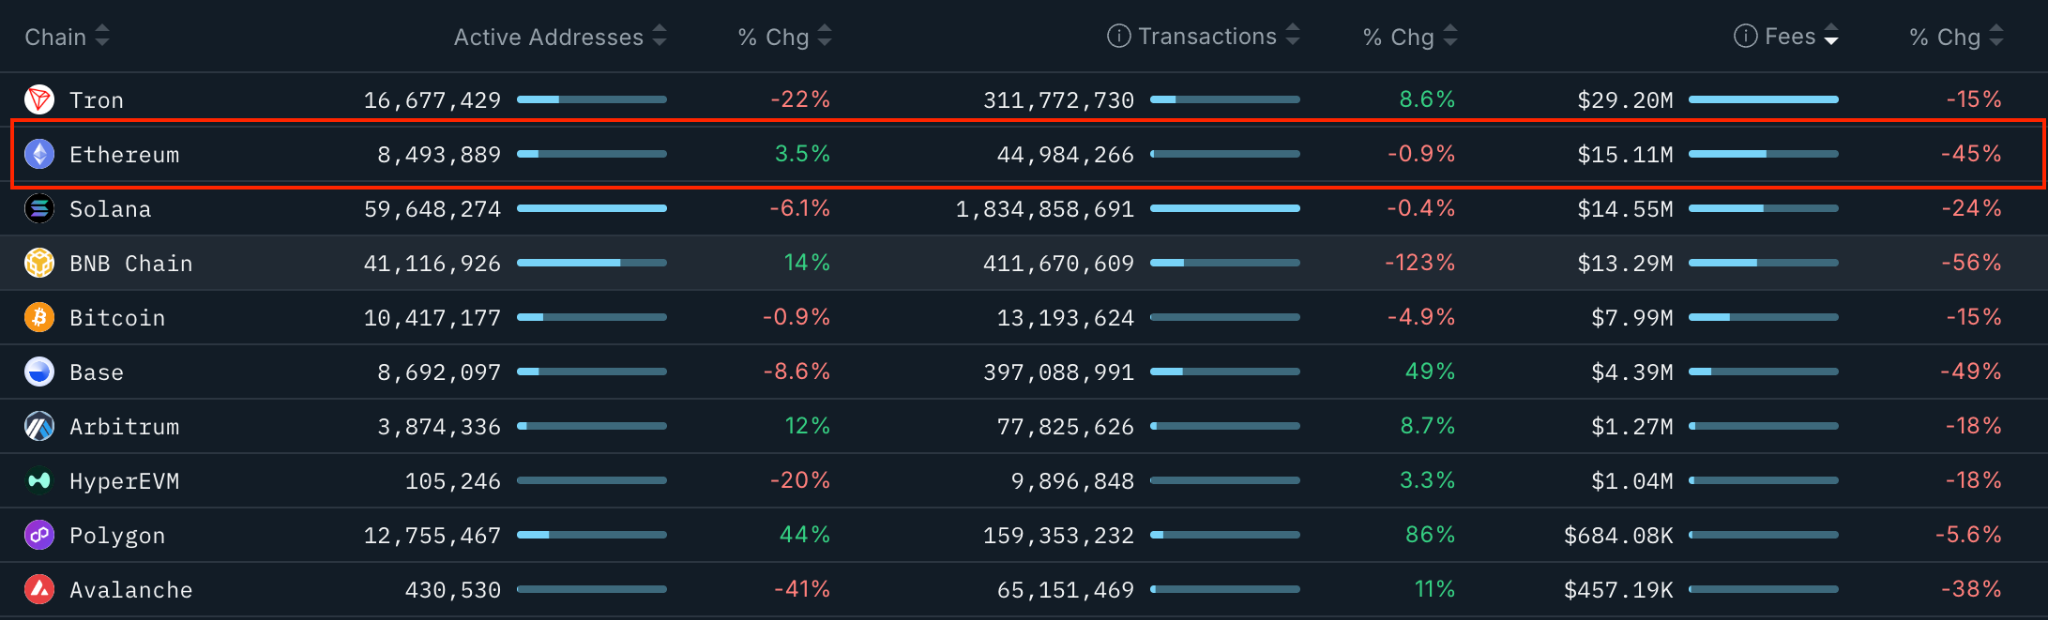
Blockchains ranked by 30-day fees, USD. Source: Nansen

Ethereum chain fees totaled $15.1 million over the past 30 days, representing a 45% decrease from the previous month. By comparison, fees on BNB Chain dropped 56%, and Tron experienced a 15% decline.

Although the number of active addresses on Ethereum’s base layer increased by 3.5% over the same period, it has decreased by 14% over the last seven days. The number of transactions is down by 11% over a seven-day period.

Ethereum bears target $2,300 ETH price

The ETH/USD pair has validated a bear flag on the daily chart after dropping below its lower boundary at $3,200, as shown below.

“Ethereum is consolidating after a sharp sell-off, forming a bear flag beneath prior support near the 3,173 to 3,250 zone,” said analyst Danny Naz in an X post on Sunday, adding:

“That area has flipped to resistance.”

The measured target of the flag is $2,300, representing a 22% drop from the current price.

ETH/USD daily chart. Source: Cointelegraph/TradingView

Zooming into the 12-hour time frame, a break and a close below the lower trendline of a megaphone pattern at $2,800 would open the way for a deeper correction toward the measured target of the pattern at $2,376.

Such a move would represent an 18% drop from the current price.
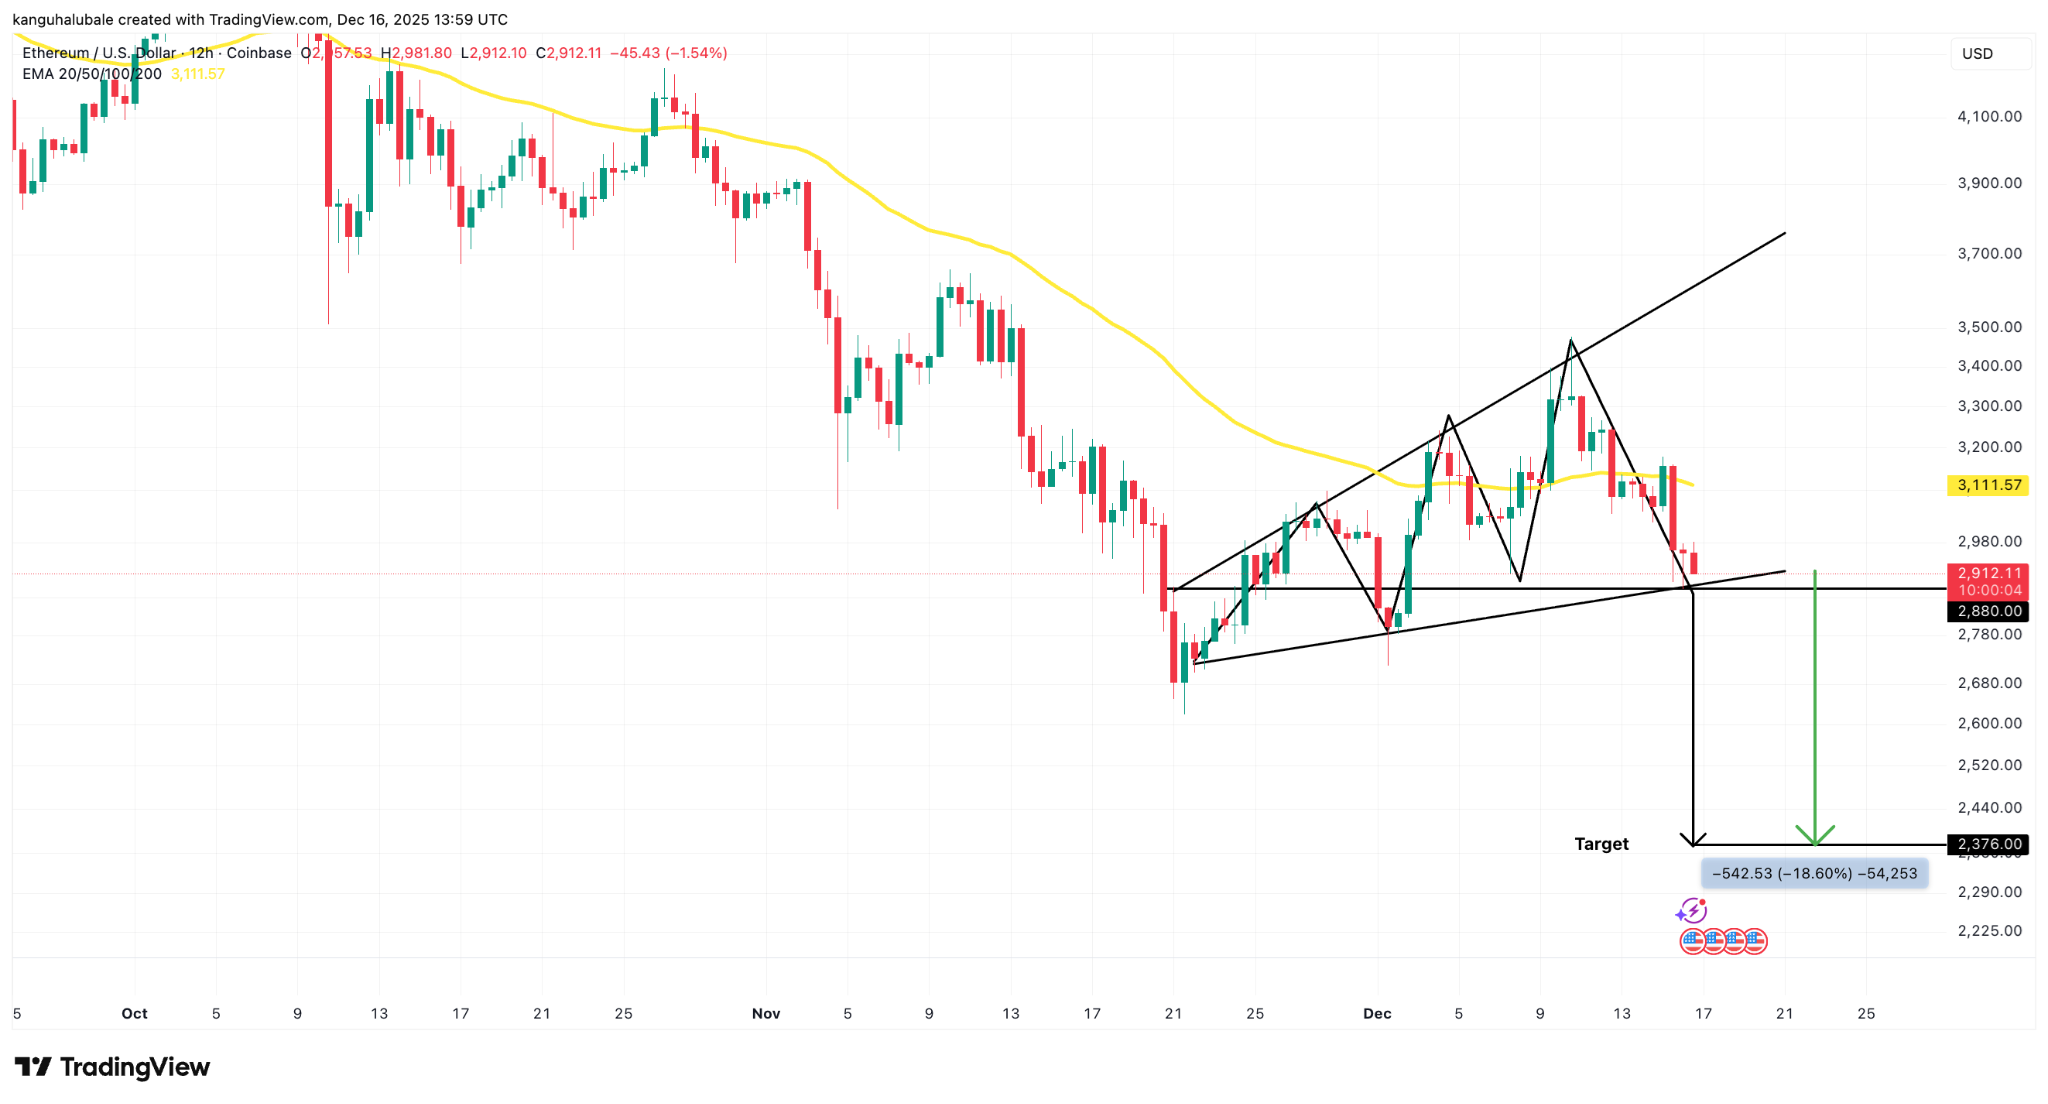
ETH/USD 12-hour chart. Source: Cointelegraph/TradingView

If this support fails and the bears manage to pull the price below $2,800, ETH price could descend to the next $2,716 to $2,623 support zone.

This article does not contain investment advice or recommendations. Every investment and trading move involves risk, and readers should conduct their own research when making a decision. While we strive to provide accurate and timely information, Cointelegraph does not guarantee the accuracy, completeness, or reliability of any information in this article. This article may contain forward-looking statements that are subject to risks and uncertainties. Cointelegraph will not be liable for any loss or damage arising from your reliance on this information.



Trend Kriptolar

İlgili Okumalar

Weekly Editor's Picks (0725-0731)

Weekly Editor's Picks (0725-0731) provides a curated selection of deep analysis, filtering out market noise. Key themes from this week include: **Macro & Policy:** The Federal Reserve's upcoming meeting is marked by high uncertainty, balancing cooling inflation data against persistent price pressures. Meanwhile, the U.S. crypto regulatory Clarity Act faces critical political hurdles, with its 2026 passage probability seen as low. **Investing & Crypto:** Analysis suggests long-term crypto success depends on conviction through volatile cycles, focusing on assets like Bitcoin and core smart contract platforms. A trend noted is the increasing similarity between global equity markets (especially tech) and crypto, driven by narrative and leverage. Several major crypto protocols show strong revenue growth, but this isn't always translating to token price appreciation due to sell pressure and structural factors. **AI & Semiconductors:** Nvidia's rising credit default swap rates signal market concern over AI infrastructure financing risks. The storage sector experienced volatility as markets began pricing in potential 2027 oversupply. Despite a record profitable quarter, SK Hynix's results were deemed "below expectations," reflecting heightened investor demands for future growth visibility. **Markets & DeFi:** TradeXYZ demonstrated remarkable accuracy in pre-market pricing for a major A股 listing. The token ONDO saw gains, linked to its growing role in the on-chain tokenized stock ecosystem. **Ethereum:** Post-Pectra upgrade, a major structural shift is underway as Lido begins migrating millions of ETH to new validator architectures designed for capital efficiency. **Also Highlighted:** Butian's bullish stock market move; OpenAI's Altman promising major advances; Samsung and SK Hynix securing large AI chip deals; Apple reaching a $5T market cap; and ongoing discussions around exchange security following Poolin's bankruptcy case.

marsbit27 dk önce

Weekly Editor's Picks (0725-0731)

marsbit27 dk önce

Low Investment Isn't Apple's Immunity Pass

While Meta and Google face investor scrutiny over ballooning AI capital expenditures, Apple's minimal AI investment has paradoxically become a strength. Its market cap recently reclaimed the global top spot, surpassing $5 trillion. The irony is deep: Apple's own AI efforts have lagged, with "Apple Intelligence" delayed and core talent lost, forcing reliance on partners like Google Gemini and Alibaba's Qianwen. Its Q3 FY2026 (Q2 CY) earnings initially seemed stellar. Revenue hit $109.4B (up 16% YoY), with iPhone and Mac sales, growing 22% and 29% respectively, driving most of the growth. However, the stock fell over 8% post-earnings. The primary concern was a weaker Q4 revenue growth forecast of 9-11%, below expectations, due to looming supply chain constraints. Apple is feeling the indirect cost of the AI boom. Soaring memory and chip prices, fueled by massive data center investments from Microsoft, Amazon, and others, are forcing Apple to raise Mac and iPad prices significantly. The upcoming iPhone launch is also expected to see substantial price hikes. Despite avoiding heavy AI infrastructure spending—its capital expenditures are actually down 28%—Apple cannot escape the industry-wide supply and cost pressures. While Apple's operating cash flow remains robust, its substantial R&D spending (up 32% YoY) has yet to yield major AI breakthroughs. As Tim Cook prepares to step down as CEO, Apple faces a challenging transition: balancing its premium hardware success against the strategic and cost pressures of the AI era it has so far cautiously navigated.

marsbit1 saat önce

Low Investment Isn't Apple's Immunity Pass

marsbit1 saat önce

PA Graphics Explanation | One Chart to Understand the Major Web3 Events in August 2026

**PANews Crypto Calendar: Key Web3 Events in August 2026** PANews introduces its revamped crypto calendar, featuring comprehensive coverage, flexible filtering, and easy export options. The market in August will be shaped by multiple key events across macroeconomics, regulation, tokenomics, and project developments: * **Macro & Policy:** Key US economic data releases (July Non-Farm Payrolls, CPI), the Federal Reserve meeting minutes, and the Jackson Hole Economic Symposium will be in focus. On the regulatory front, the US Senate plans to release a new draft of the *CLARITY Act*, while the EU's expanded crypto ban against Belarus comes into effect. * **Token Unlocks:** Significant token unlocks are scheduled for assets including ENA, AVAX, CONX, ZRO, and KAITO, which may influence market volatility. * **Project Updates & Shutdowns:** Several services, including Exchange Art, Ctrl Wallet, Zapper, NFTfi, and Summer.fi, are set to cease operations or undergo major adjustments. Users are advised to manage their assets accordingly. * **Corporate Activity:** Q2 earnings reports from companies like SpaceX, Circle, and Nvidia are due. Unitree Robotics will initiate its IPO subscription on the STAR Market, and Moonshot AI plans to begin a Pre-IPO financing round. * **Industry Events:** Major conferences such as Bitcoin Asia 2026 and the 2026 Digital Expo will take place. The overarching market narrative for August will revolve around macroeconomic expectations, regulatory developments, token unlock schedules, and ongoing industry consolidation.

marsbit1 saat önce

PA Graphics Explanation | One Chart to Understand the Major Web3 Events in August 2026

marsbit1 saat önce

Wall Street's Most Famous 'Cassandra' Now Has His Sights Set on Nvidia

Michael Burry, the famed "Big Short" investor, has once again captured Wall Street's attention with a series of short positions against major tech and semiconductor stocks, most notably Nvidia. In late June and July, through his "Cassandra Unchained" newsletter, Burry disclosed short bets against Nvidia, Tesla, Applied Materials, Caterpillar, the SOXX semiconductor ETF, and later, Micron Technology. His core thesis revolves around potential distortions in the AI infrastructure boom, specifically questioning whether extended depreciation schedules (e.g., 6 years vs. a realistic 2-3 years for AI chips) by cloud giants like Microsoft and Google artificially inflate profits. He also raises concerns about possible "off-balance-sheet circular financing," where chip demand might be propped up by vendor-backed funding to clients. Nvidia's stock experienced volatility following these disclosures, briefly dipping but largely holding near Burry's reported entry points, leaving his positions roughly flat or slightly underwater as of late July. This move is part of a pattern for Burry, whose track record since his legendary 2008 bet is mixed. He has faced notable losses, such as on Tesla in 2021, while scoring on broader market turns like the 2020 pandemic crash. His methodology focuses intensely on free cash flow and scrutinizing original financial documents to spot overvaluation and structural risks, but it often struggles with timing the market. The article contrasts Burry's stance with other prominent investors. Steve Eisman, another "Big Short" figure, is not shorting Nvidia, citing strong fundamentals but expressing nervousness about sustainability. Jim Chanos agrees with the broad "accounting mismatch" concern—comparing it to the dot-com bubble—but targets financial leverage in private equity firms rather than the chip stocks themselves. While Nvidia's short interest remains relatively low at 1.3-1.4% of float, the massive stock size means absolute short losses have been significant, exceeding $5 billion earlier this year. The piece concludes that for ordinary investors, the key takeaway is not replicating specific short bets but learning from the critical frameworks these investors use: questioning rosy accounting, identifying structural vulnerabilities, and maintaining skepticism during market euphoria, even if pinpointing the exact catalyst for a downturn remains elusive.

marsbit1 saat önce

Wall Street's Most Famous 'Cassandra' Now Has His Sights Set on Nvidia

marsbit1 saat önce

İşlemler

Spot

Popüler Makaleler

T Nasıl Satın Alınır

HTX.com’a hoş geldiniz! Threshold Network Token (T) satın alma işlemlerini basit ve kullanışlı bir hâle getirdik. Adım adım açıkladığımız rehberimizi takip ederek kripto yolculuğunuza başlayın. 1. Adım: HTX Hesabınızı OluşturunHTX'te ücretsiz bir hesap açmak için e-posta adresinizi veya telefon numaranızı kullanın. Sorunsuzca kaydolun ve tüm özelliklerin kilidini açın. Hesabımı Aç2. Adım: Kripto Satın Al Bölümüne Gidin ve Ödeme Yönteminizi SeçinKredi/Banka Kartı: Visa veya Mastercard'ınızı kullanarak anında Threshold Network Token (T) satın alın.Bakiye: Sorunsuz bir şekilde işlem yapmak için HTX hesap bakiyenizdeki fonları kullanın.Üçüncü Taraflar: Kullanımı kolaylaştırmak için Google Pay ve Apple Pay gibi popüler ödeme yöntemlerini ekledik.P2P: HTX'teki diğer kullanıcılarla doğrudan işlem yapın.Borsa Dışı (OTC): Yatırımcılar için kişiye özel hizmetler ve rekabetçi döviz kurları sunuyoruz.3. Adım: Threshold Network Token (T) Varlıklarınızı SaklayınThreshold Network Token (T) satın aldıktan sonra HTX hesabınızda saklayın. Alternatif olarak, blok zinciri transferi yoluyla başka bir yere gönderebilir veya diğer kripto para birimlerini takas etmek için kullanabilirsiniz.4. Adım: Threshold Network Token (T) Varlıklarınızla İşlem YapınHTX'in spot piyasasında Threshold Network Token (T) ile kolayca işlemler yapın.Hesabınıza erişin, işlem çiftinizi seçin, işlemlerinizi gerçekleştirin ve gerçek zamanlı olarak izleyin. Hem yeni başlayanlar hem de deneyimli yatırımcılar için kullanıcı dostu bir deneyim sunuyoruz.

671 Toplam GörüntülenmeYayınlanma 2024.12.10Güncellenme 2026.06.02

T Nasıl Satın Alınır

Tartışmalar

HTX Topluluğuna hoş geldiniz. Burada, en son platform gelişmeleri hakkında bilgi sahibi olabilir ve profesyonel piyasa görüşlerine erişebilirsiniz. Kullanıcıların T (T) fiyatı hakkındaki görüşleri aşağıda sunulmaktadır.

活动图片