Author: Frank, PANews
In early 2026, the crypto market is filled with frustration and confusion.
Bitcoin has retraced about 36% from its all-time high in October 2025, with the market seesawing between bullish and bearish sentiments. However, what makes many crypto investors even more uneasy is not the price itself, but the fact that the set of metrics they used to gauge the market's position in the past have almost all failed.
The S2F model's $500,000 prediction deviated from reality by more than threefold, the four-year cycle failed to deliver an explosive rally long after the halving, the Pi Cycle Top indicator remained silent throughout the entire cycle, the fixed thresholds of the MVRV Z-Score were no longer triggered, and the top regions of the Rainbow Chart became seemingly out of reach. Meanwhile, the contrarian signals of the Fear & Greed Index repeatedly misfired, and the highly anticipated "altcoin season" never arrived.
Why have these metrics collectively failed? Is it a temporary deviation, or has the market structure undergone fundamental changes? PANews has systematically reviewed and analyzed 8 widely discussed failed metrics.
Four-Year Cycle Theory: The Halving's Supply Shock Is Becoming Negligible
The four-year cycle theory is one of the most widely accepted patterns in the crypto market. This theory posits that Bitcoin follows a fixed rhythm driven by halving events: accumulation before the halving, an explosive rally 12-18 months after the halving, a peak followed by a 75%-90% crash, bottoming out in a bear market, and then restarting. The three halvings in 2012, 2016, and 2020 all validated this pattern reasonably well.
However, after the April 2024 halving, the market did not experience the typical explosive rally seen in previous cycles. Bitcoin's annualized volatility dropped from historically over 100% to about 50%, showing more characteristics of a "slow bull" market. Bear market drawdowns have also narrowed; the 2022 drop from peak to trough was 77%, less than 86% in 2014 and 84% in 2018.
Discussions about the failure of the four-year cycle theory are widespread on social media. The mainstream view is that the entry of institutional funds has fundamentally altered the market's microstructure.
First, the launch of Bitcoin spot ETFs in the US has continuously absorbed funds, creating sustained demand and breaking the simple narrative driven solely by halvings.
Second, on the supply side, the 2024 halving reduced the block reward to 3.125 BTC, cutting the daily new supply from about 900 BTC to 450 BTC. This reduction translates to an annualized supply decrease of approximately 164,000 coins. This drop lowers Bitcoin's annualized inflation rate (supply growth rate) from about 1.7% pre-halving to roughly 0.85%. The annual reduction in supply represents only 0.78% of the total 21 million coin issuance. Relative to Bitcoin's multi-trillion dollar market capitalization, the practical impact of this supply reduction has become minimal.
Pi Cycle Top: Declining Volatility Removes the Condition for Moving Average Crossovers
The Pi Cycle Top, developed by Philip Swift, identifies market tops by observing when the 111-day moving average crosses above twice the 350-day moving average. This indicator accurately signaled the top three times: in 2013, 2017, and April 2021.
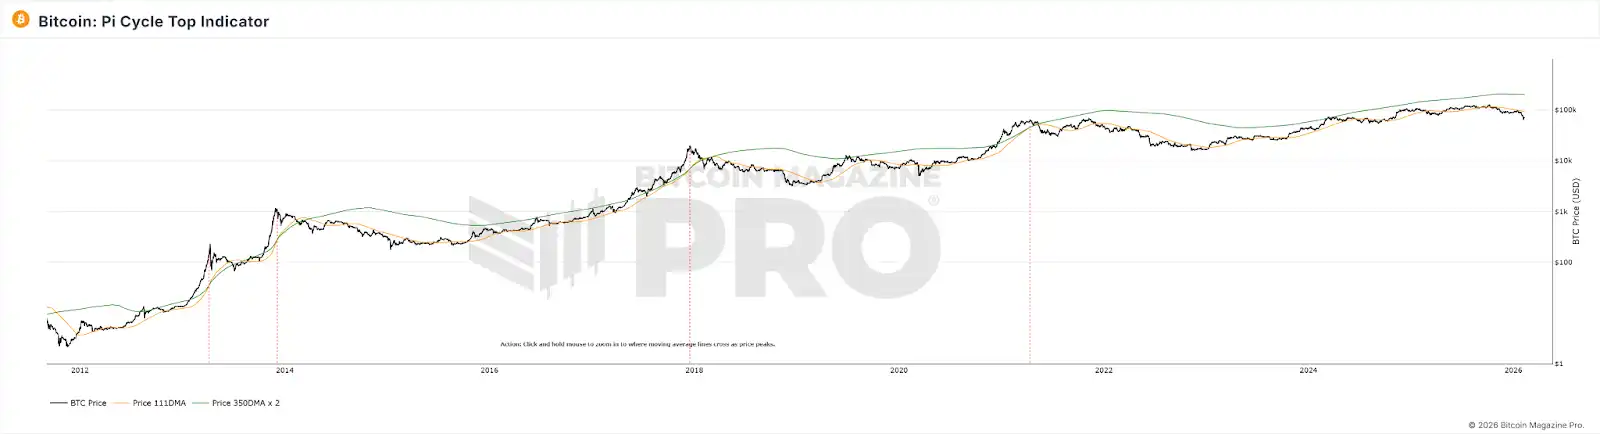
During the 2025 bull cycle, the two moving averages never produced a valid crossover, and the indicator remained "silent." Yet, the market's downward trend was already quite evident.
The failure of this indicator is likely because the Pi Cycle Top relies on sharp price volatility, causing the short-term average to deviate significantly from the long-term average before crossing. As Bitcoin's volatility has structurally declined with ETF and institutional participation, leading to smoother price movements and fewer parabolic rallies driven by retail, the prerequisite for moving average crossovers is no longer easily met. Furthermore, this indicator is essentially a curve fit to data from the early adoption phase (2013-2021). After a qualitative change in market participant structure, the parameters fitted to earlier data likely no longer apply.
MVRV Z-Score: Market Scale and Holding Patterns Alter the Calculation Basis
The MVRV Z-Score is an on-chain valuation metric that assesses market valuation by comparing Bitcoin's market value (current market cap) to its realized value (the total value calculated based on the price at each coin's last on-chain movement). Traditionally, a Z-Score above 7 is considered an overbought sell signal, while below 0 is seen as an extremely undervalued buy signal.
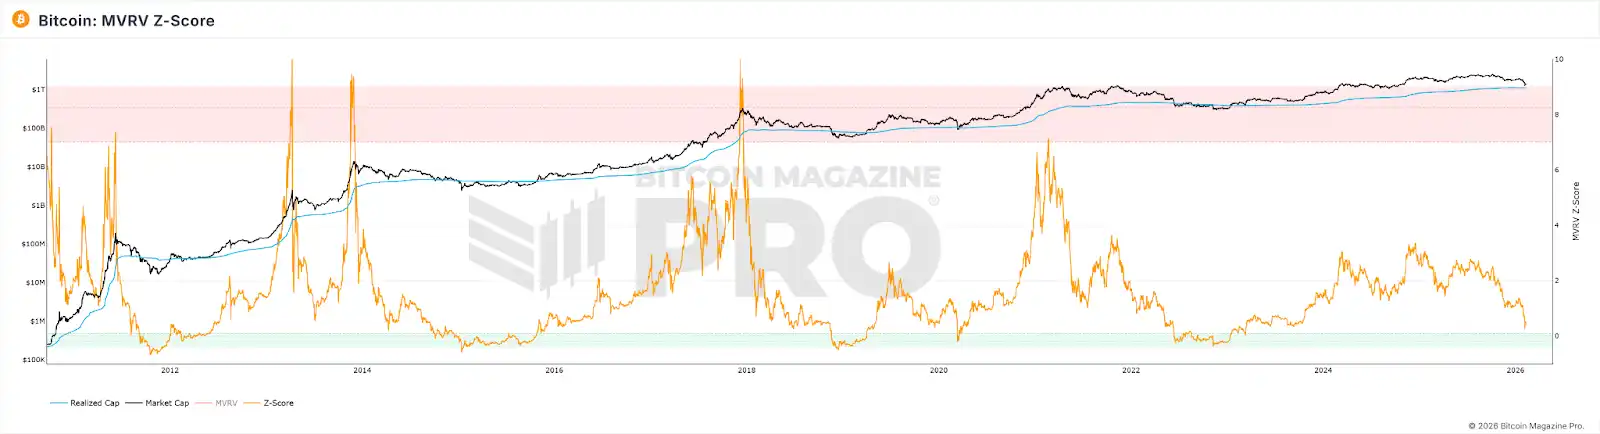
In terms of performance, even at the peak of the 2021 bull market, the Z-Score did not reach the heights of previous cycles, and the traditional fixed threshold (>7) was no longer triggered. By 2025, although Bitcoin's price peaked, the Z-Score's maximum value was only 2.69.
The reasons for this may include:
1. Institutions buying at high prices and holding long-term, systematically raising the Realized Value closer to the market value, compressing the fluctuation range of MVRV.
2. Frequent movements by short-term active traders continuously "refreshing" the RV of active supply to near current price levels, further narrowing the MV-RV gap.
3. As the market capitalization has expanded, the amount of capital required to generate the same extreme Z-Score values as in the early days has grown exponentially.
The combined effect of these factors is that the Z-Score's ceiling has been structurally lowered, making the originally set fixed threshold of "7 = overbought" impossible to reach.
Rainbow Chart: The Logarithmic Growth Assumption Is Being Broken
The Bitcoin Rainbow Chart uses logarithmic growth curves to fit long-term price trends, dividing the price range into colored bands from "Extreme Undervaluation" to "Maximum Bubble Territory," helping investors judge buying and selling opportunities. In 2017 and 2021, prices touching the higher color bands indeed corresponded to cycle tops.
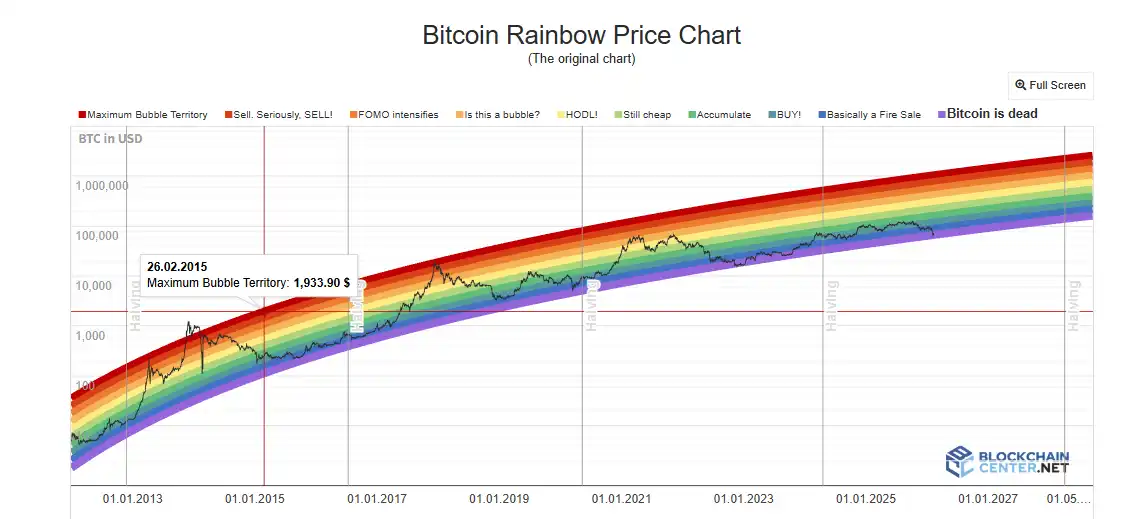
However, throughout the 2024-2025 bull cycle, Bitcoin's price remained only in the "HODL!" neutral zone, never approaching the deep red area representing extreme bubbles. The chart's top prediction function hardly came into play.
For the Rainbow Chart indicator, in this model, price is merely a function of time. It does not consider halvings, ETFs, institutional funds, macro policies, or any other variables. Additionally, institutionalization has led to decreased volatility, systematically reducing the amplitude of price deviations around the trend line, making fixed-width color bands unreachable. Furthermore, Bitcoin's growth is transitioning from the "steep part of the adoption S-curve" to the "slow growth phase of a mature asset." The extrapolated growth rate from the logarithmic function is systematically higher than the actual growth rate, causing the price to linger below the center line long-term.
Altcoin Season Index & BTC Dominance: The Premise of "Fund Rotation" Has Changed
The Altcoin Season Index measures the percentage of the top 100 altcoins that have outperformed BTC over the past 90 days, with a value over 75 considered "altcoin season." BTC Dominance (the percentage of BTC's market cap relative to the total crypto market cap) is seen as a signal of funds flowing from BTC to altcoins when it falls below 50% or even 40%. In 2017, BTC Dominance fell from 85% to 33%, and in 2021, it dropped from 70% to the 40% range, both corresponding to massive altcoin rallies.
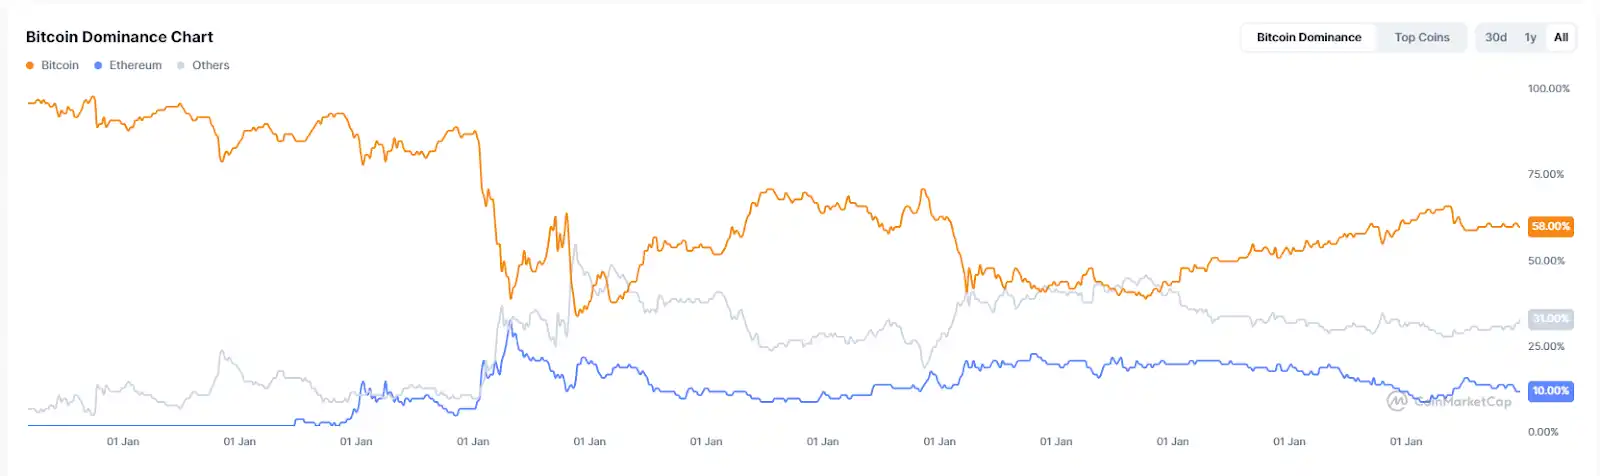
However, throughout 2025, the Altcoin Season Index remained below 30, consistently in "Bitcoin season." BTC Dominance reached a high of 64.34% and never fell below 50%. By early 2026, the so-called "Altseason" manifested more as localized rotations driven by specific narratives, benefiting only particular sectors like AI and RWA, rather than the broad-based rallies seen in the previous two cycles.
The deep-seated reasons for the failure of these two indicators also lie in the current market structure. With institutions and ETF funds becoming dominant, these funds show a significantly higher risk preference for Bitcoin compared to altcoins. Additionally, substantial funds are being siphoned off by the AI and precious metals frenzy, reducing the overall liquidity flowing into the crypto market. The incremental capital attracted by Bitcoin ETFs flows directly into BTC; structurally, these funds do not "rotate" into altcoins. ETF holders are buying a financial product, not an entry ticket to the crypto ecosystem. Moreover, the narrative exhaustion in the altcoin ecosystem and weakened liquidity support for new projects are also important reasons why the altcoin season has been slow to arrive.
Fear & Greed Index: Retail Sentiment Is No Longer the Decisive Force for Prices
The Crypto Fear & Greed Index synthesizes various factors like volatility, market momentum, social media sentiment, and Google Trends to produce a score from 0 to 100. The classic usage is contrarian: buy when there's extreme fear, sell when there's extreme greed.
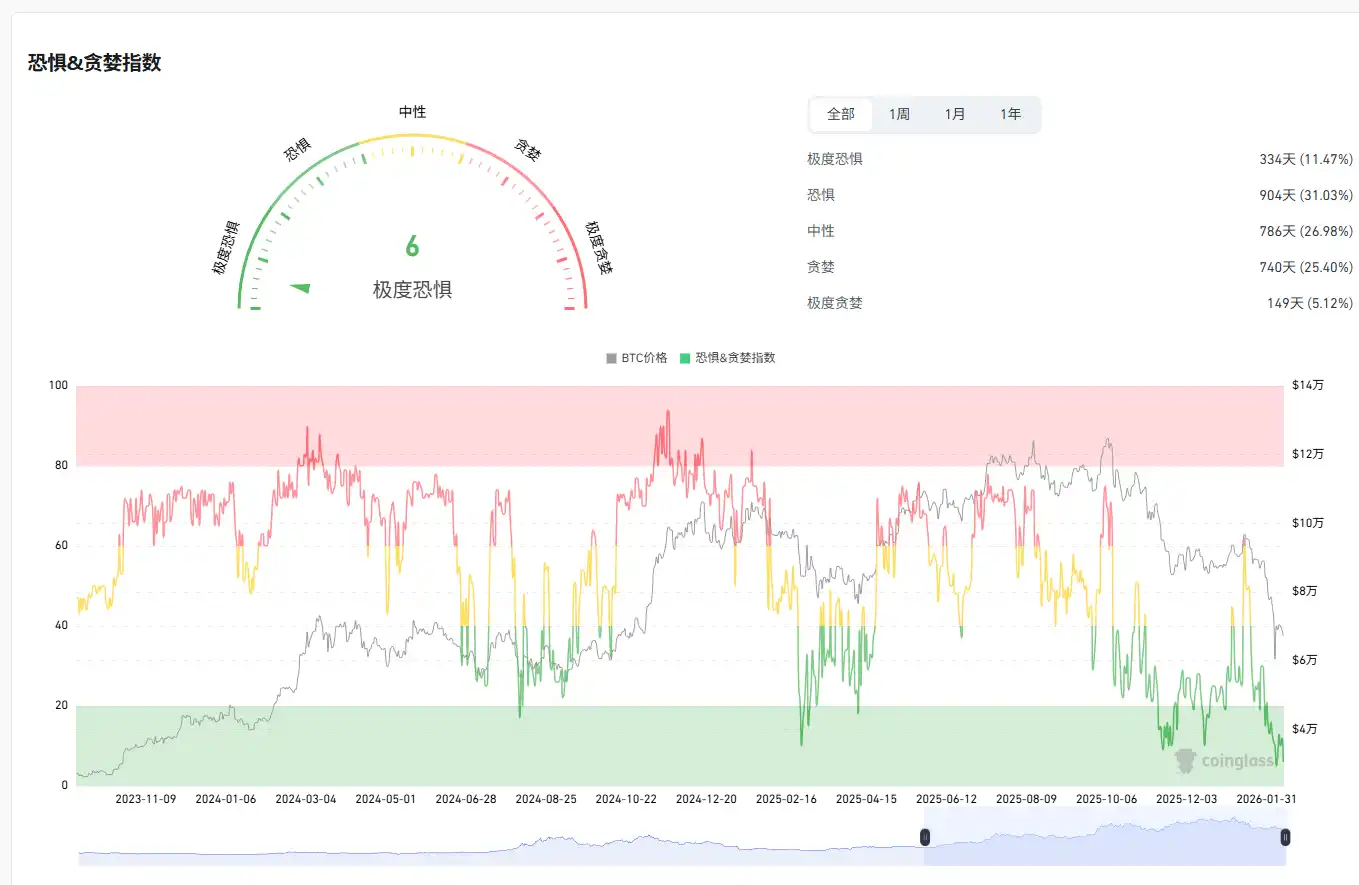
In April 2025, the index dropped below 10, lower than during the FTX collapse, but BTC did not experience the expected significant rebound thereafter. The 30-day average for the year was only 32, with 27 days spent in the fear or extreme fear zones. As a top signal, the indicator was equally unreliable; at the market peak in October 2025, the index was only around 70.
The core reason for the Crypto Fear & Greed Index's failure is that the transmission mechanism between sentiment and price has been interrupted by institutional funds. When retail is fearful, institutions might be buying the dip; when retail is greedy, institutions might be hedging with derivatives. This means retail sentiment is no longer the dominant force driving price movements.
NVT Ratio: On-Chain Transaction Volume No Longer Represents Real Economic Activity
The NVT Ratio, often called the "PE ratio for crypto," divides the network's market capitalization by the daily on-chain transaction volume. A high NVT might indicate overvaluation, while a low NVT might suggest undervaluation.
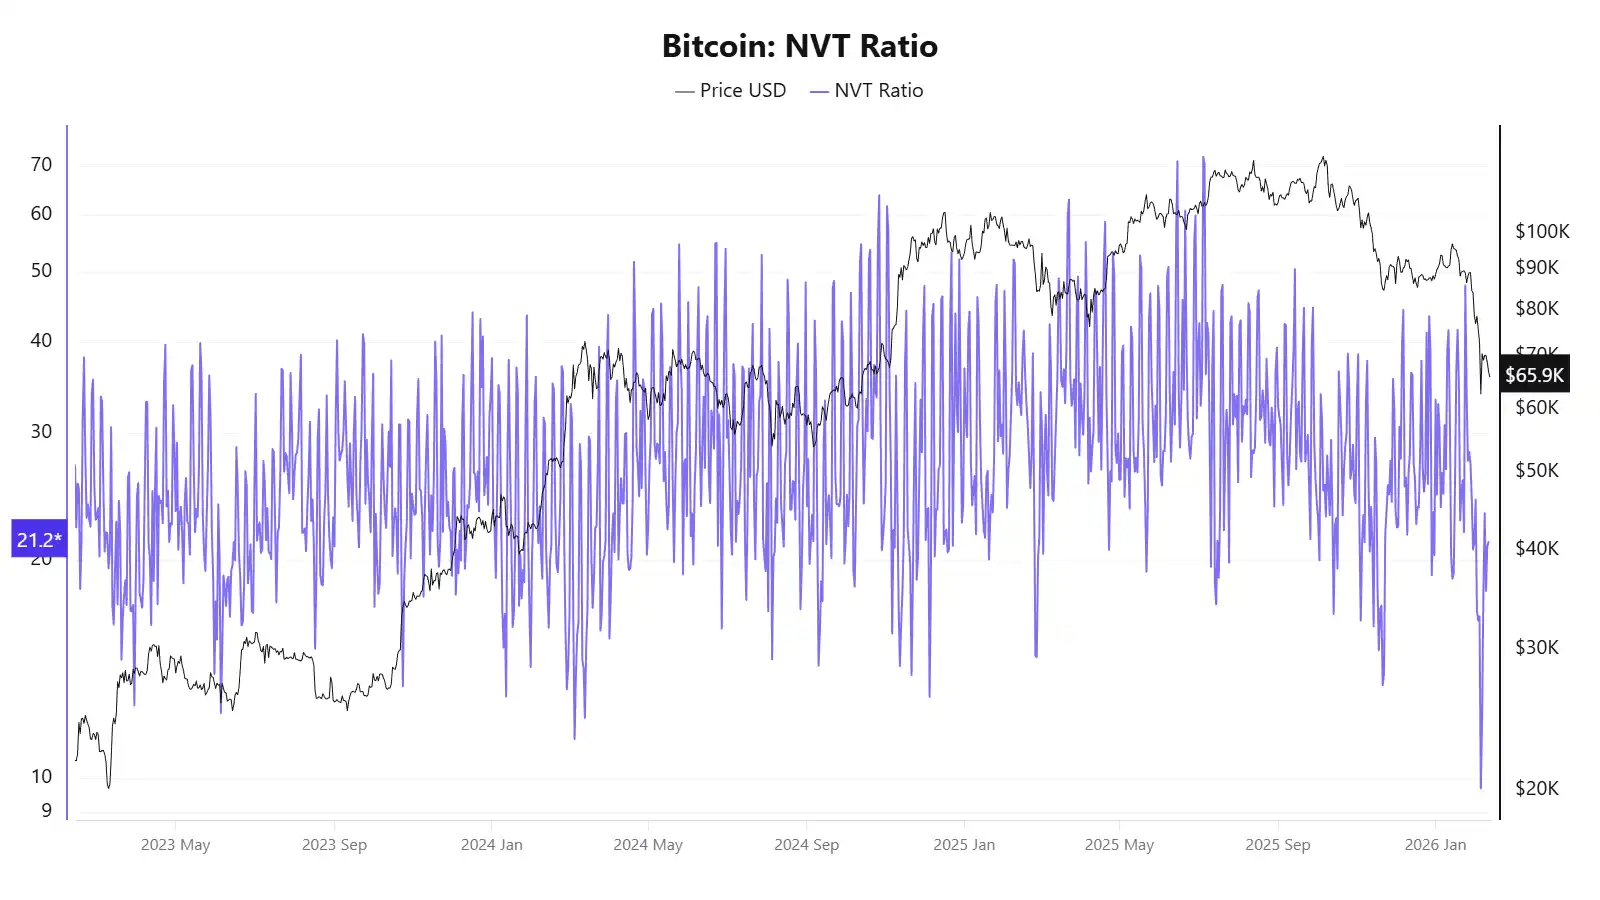
In 2025, this indicator showed contradictory signals. In April, before prices had risen significantly, the NVT Golden Cross was as high as 58, but by October, when prices reached around $120,000, it indicated that the price was undervalued.
The fundamental reason for NVT's failure lies in its denominator, the on-chain transaction volume, which can no longer represent the real economic activity of the Bitcoin network.
S2F Model: The Cost of Ignoring Demand While Focusing Only on Supply
The Stock-to-Flow (S2F) model was proposed by anonymous analyst PlanB in 2019. It borrows valuation logic from precious metals, using the ratio of Bitcoin's stock (existing supply) to its flow (annual new supply) to measure scarcity, and fits a price prediction curve through logarithmic regression. The core assumption is that after each halving, the S2F ratio doubles, and the price should rise exponentially.
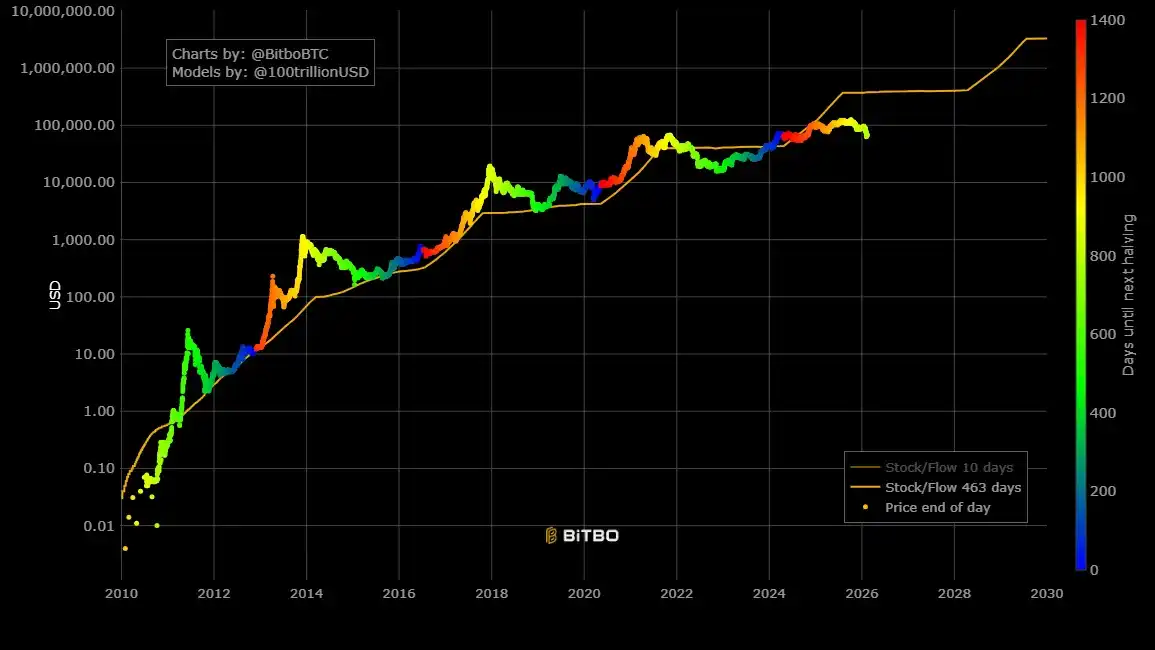
In terms of failure, in December 2021, the model predicted BTC should reach about $100,000, but the actual price was around $47,000, a deviation of over 50%. In 2025, the model target was $500,000, but the actual price was around $120,000, widening the gap to more than threefold.
The fundamental reason for S2F's failure is that it is a purely supply-side model, completely ignoring demand-side variables. Furthermore, as Bitcoin's market capitalization reaches trillions of dollars, exponential growth becomes increasingly physically unsustainable; diminishing marginal effects are an unavoidable reality.
What Failed Are Not Individual Metrics, But the Market Assumptions They Commonly Rely On
Examining the failure of these metrics together reveals that their失灵 (shīlíng - malfunction/failure) is not an isolated event but points to the same set of structural changes:
Institutionalization has changed the market microstructure: Bitcoin ETFs, corporate treasury allocations, CME derivatives, and pension fund entries have collectively altered the capital structure and price discovery mechanism. Institutions tend to buy the dip and hold long-term, smoothing out the剧烈波动 (jùliè bōdòng - violent fluctuations) previously driven by retail sentiment. This makes it difficult for all indicators reliant on extreme volatility or sentiment signals to operate in their original manner. Additionally, the siphoning of funds by AI and precious metals has reduced liquidity in the crypto market.
The structural decline in volatility is the direct technical reason for the failure of multiple metrics: Pi Cycle Top and the Rainbow Chart require extreme price increases to trigger signals; MVRV requires a huge deviation between market cap and cost basis; funding rates require extreme imbalances between long and short positions. When volatility drops from 100% to 50%, these conditions become harder to meet.
Bitcoin's "asset type" is migrating: From a digital commodity to a macro financial asset, Bitcoin's price drivers are shifting from on-chain variables (halvings, on-chain activity) to macro factors like Fed policy, global liquidity, and geopolitics. Indicators focused on analyzing on-chain data are facing a market increasingly dominated by off-chain factors.
The representativeness of on-chain data itself is declining: Layer 2 transactions, internal exchange settlements, and ETF custody models are eroding the data foundation of on-chain metrics, making it increasingly difficult for indicators like NVT and MVRV, which rely on on-chain transaction data, to capture the full picture.
Furthermore, most classic metrics are essentially curve fits based on 3-4 halving cycles, with an extremely small sample size, making them prone to failure when the market environment undergoes qualitative changes.
For ordinary investors, the collective failure of these metrics might convey a simpler signal: Understanding the assumptions and applicable boundaries of each metric might be more important than seeking a universal prediction tool. Over-reliance on any single indicator can lead to misjudgments. In a phase where the market's underlying rules are being rewritten, maintaining cognitive flexibility might be more practical than searching for the next "universal indicator."






