Venice Token [VVV] has surged 14.37% to $6.40 as trading volume climbs 26.54% to $23.12M, signaling strong demand expansion across the spot market.
This expansion shows that price is not drifting upward but rather advancing through strong spot demand.
As participation increases, the rally reflects conviction instead of low-liquidity spikes. The VVV price increase toward $6.40 highlights alignment between demand and price action.
However, volume expansion at this stage also suggests that traders are reacting to the breakout rather than anticipating it.
As a result, this phase often defines whether continuation can hold or begin to fade under pressure.
VVV breaks free as structure shifts upward
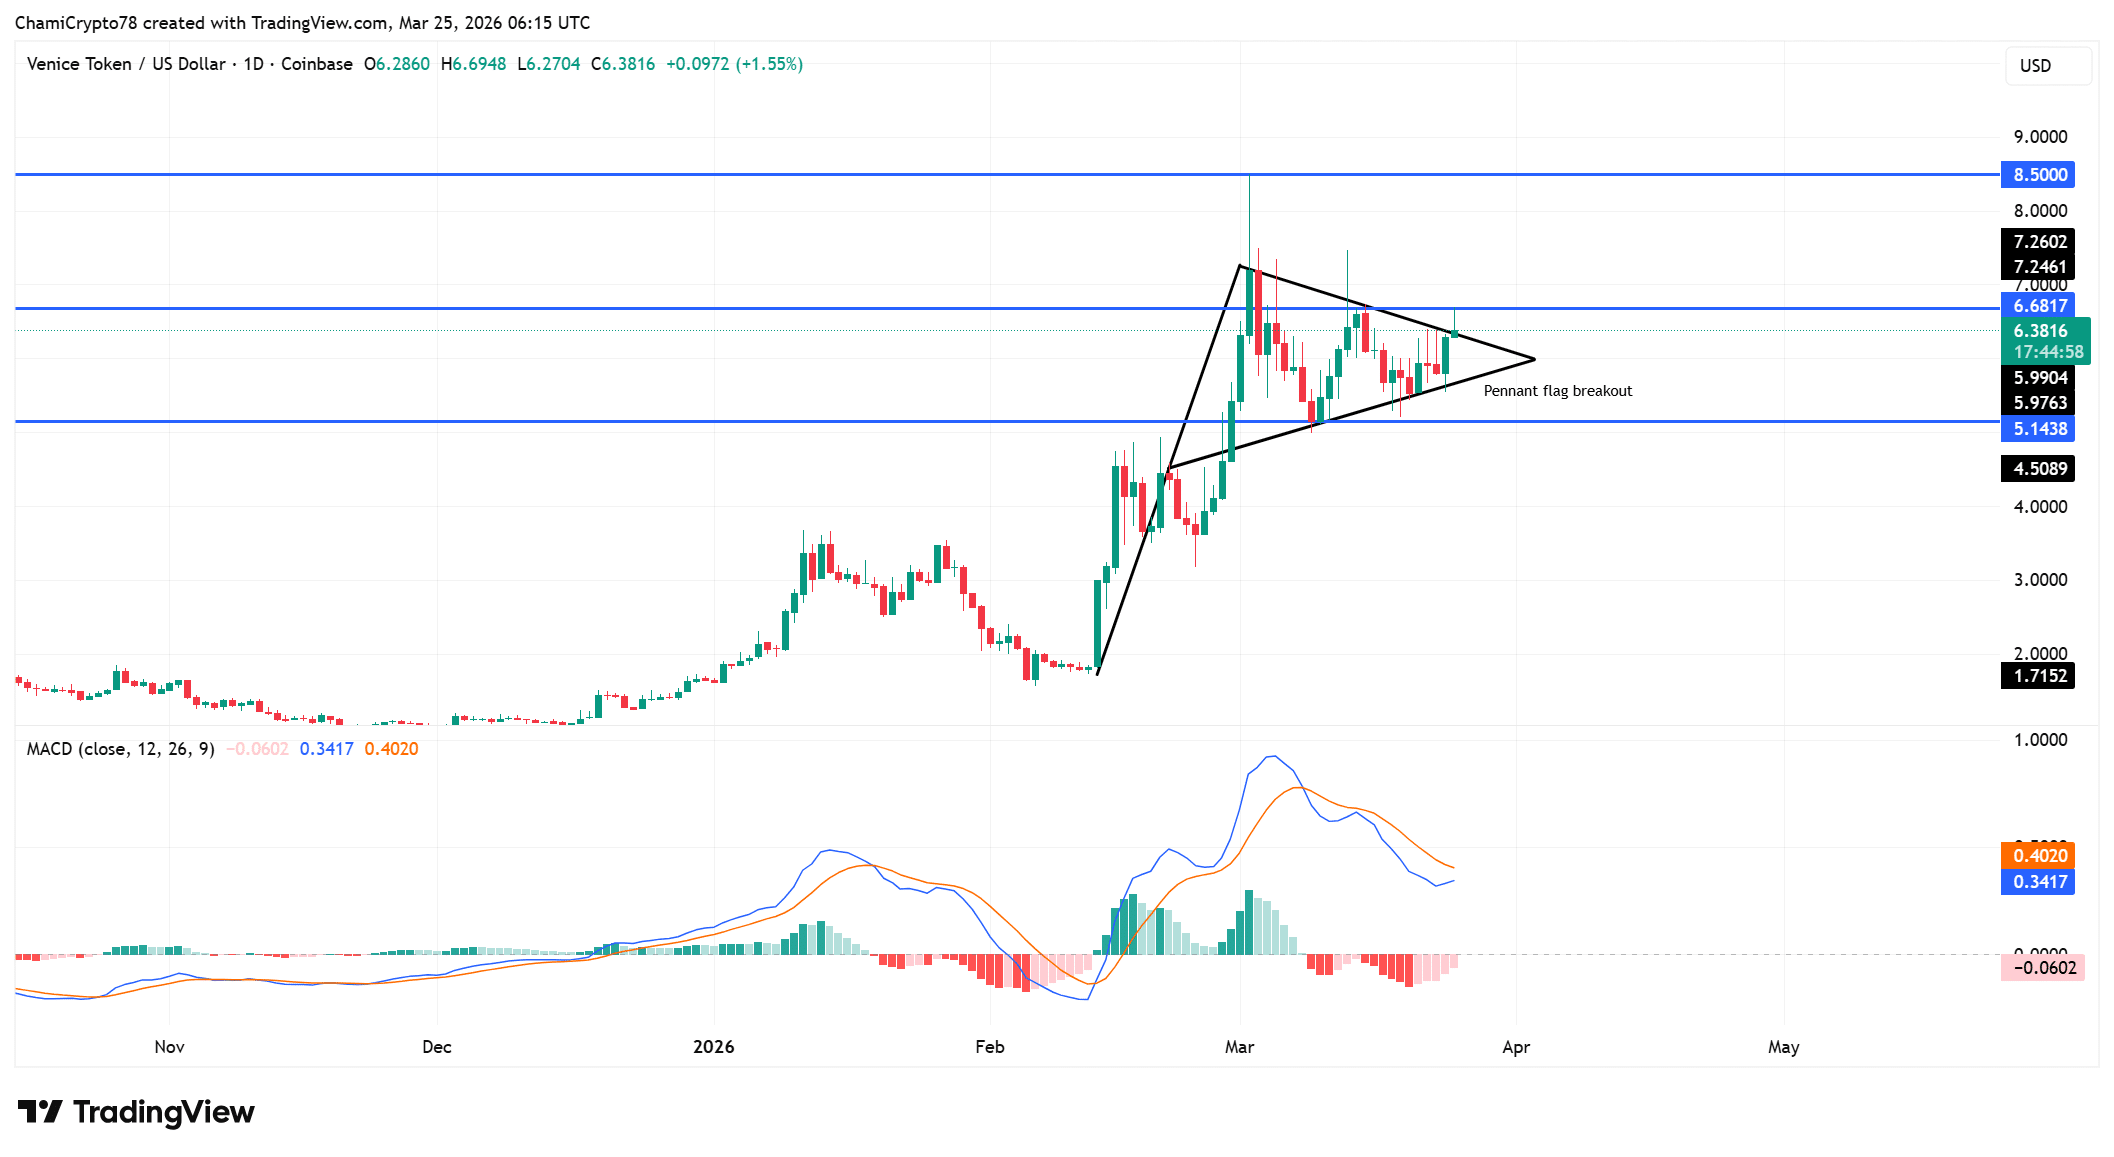
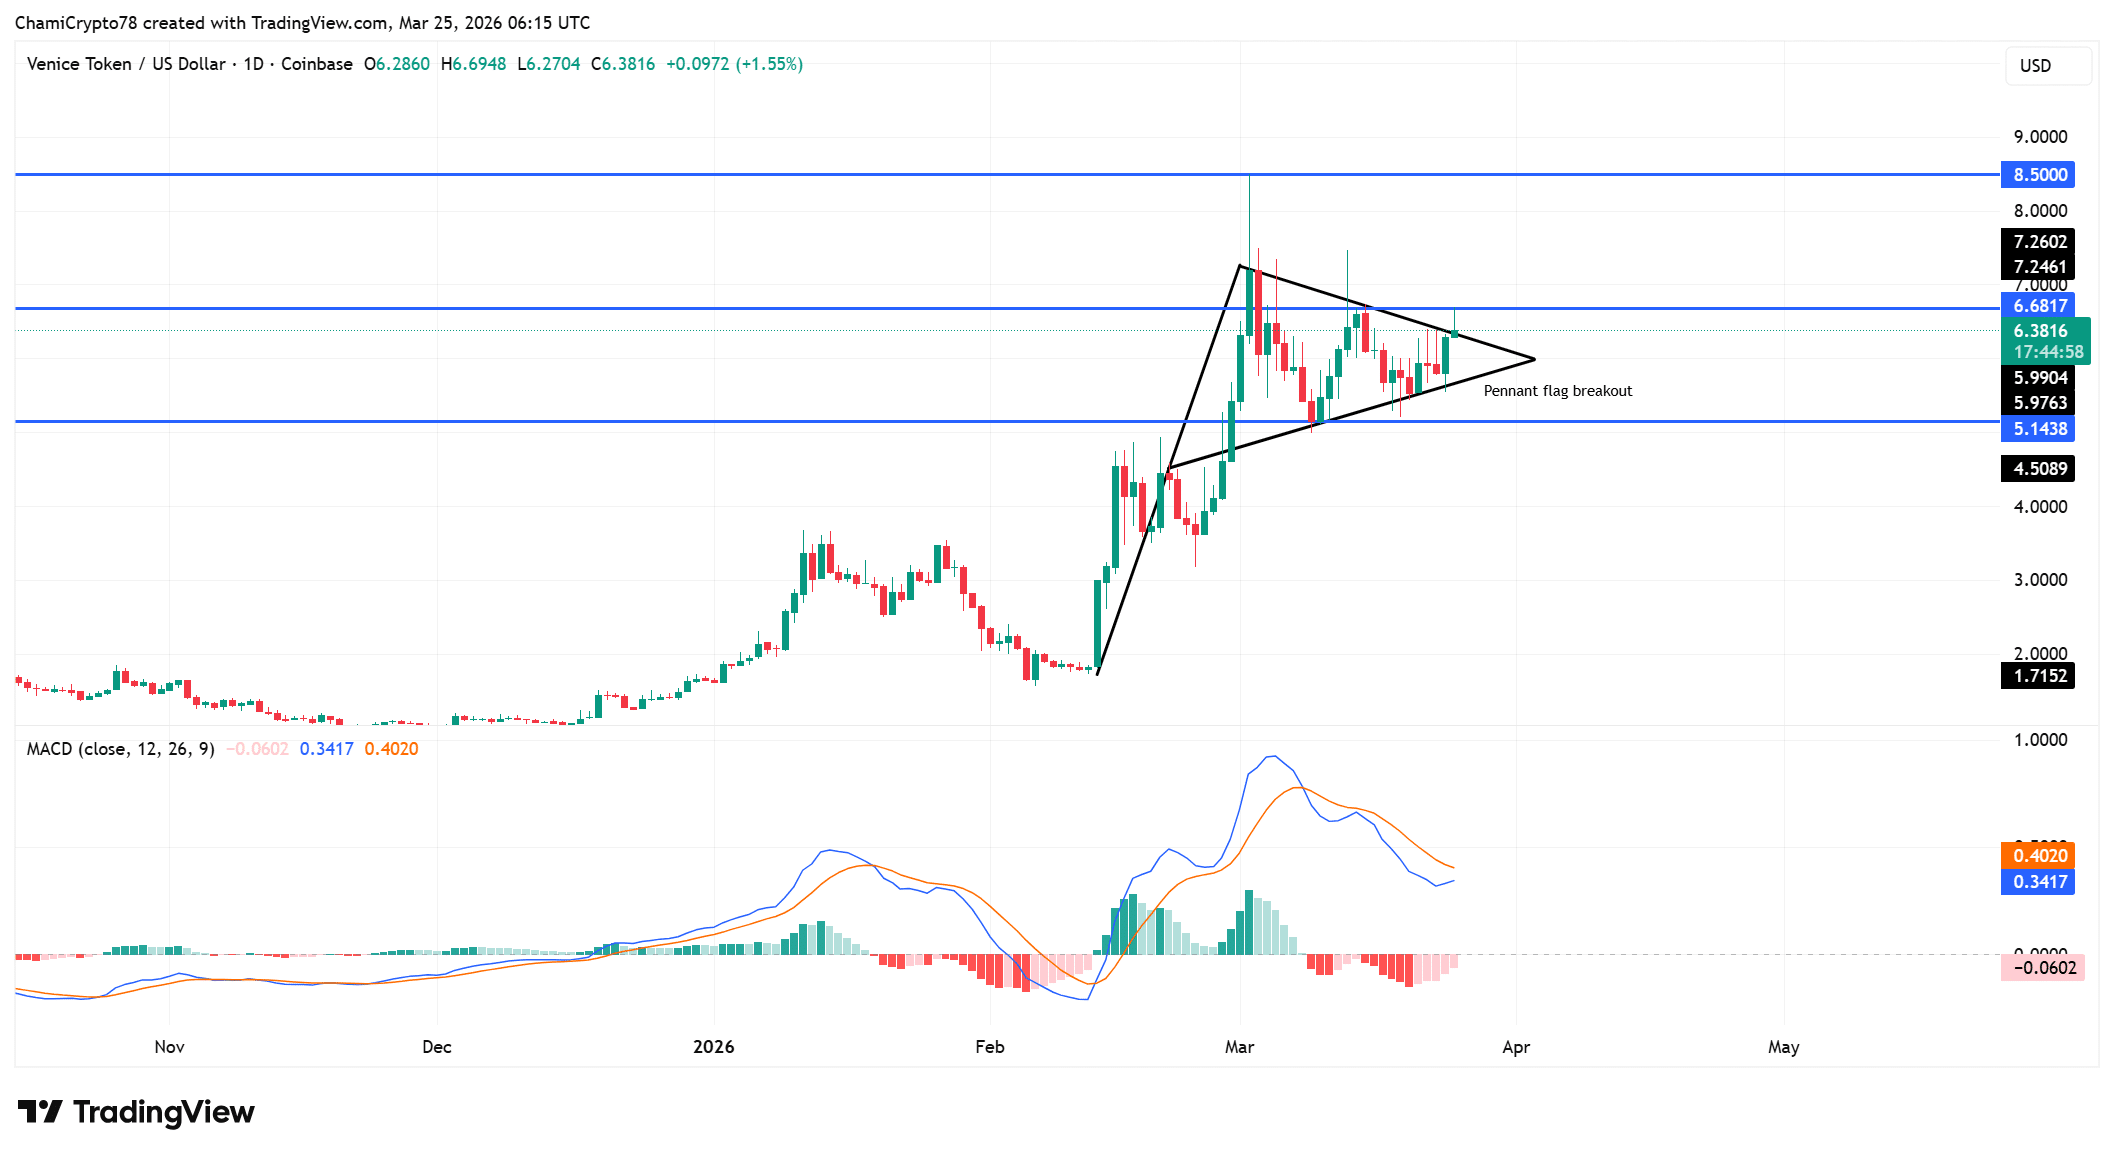
Price has broken out of the pennant flag, ending the prior compression phase and shifting structure toward expansion.
The breakout places immediate resistance at $6.68, while a broader target forms near $8.50 if continuation holds.
Besides, the former consolidation region around $5.14 now acts as a key support base. This transition reflects a shift from indecision into directional control.
However, price now approaches resistance zones where sellers may respond. As a result, holding above the breakout zone remains critical.
If price maintains this structure, the breakout could extend, but failure to hold support would quickly weaken the setup.
The MACD structure shows that bullish strength has not fully aligned with price action.
The indicator has not crossed above the signal line, which limits confirmation of sustained upside pressure.
Additionally, the histogram has turned negative, reflecting weakening strength after the breakout.
This divergence highlights a gap between structural expansion and internal strength. However, price continues holding above key levels, suggesting that buyers still defend the move.
As a result, the current setup reflects early-stage expansion rather than fully confirmed continuation.
CVD divergence exposes underlying sell pressure
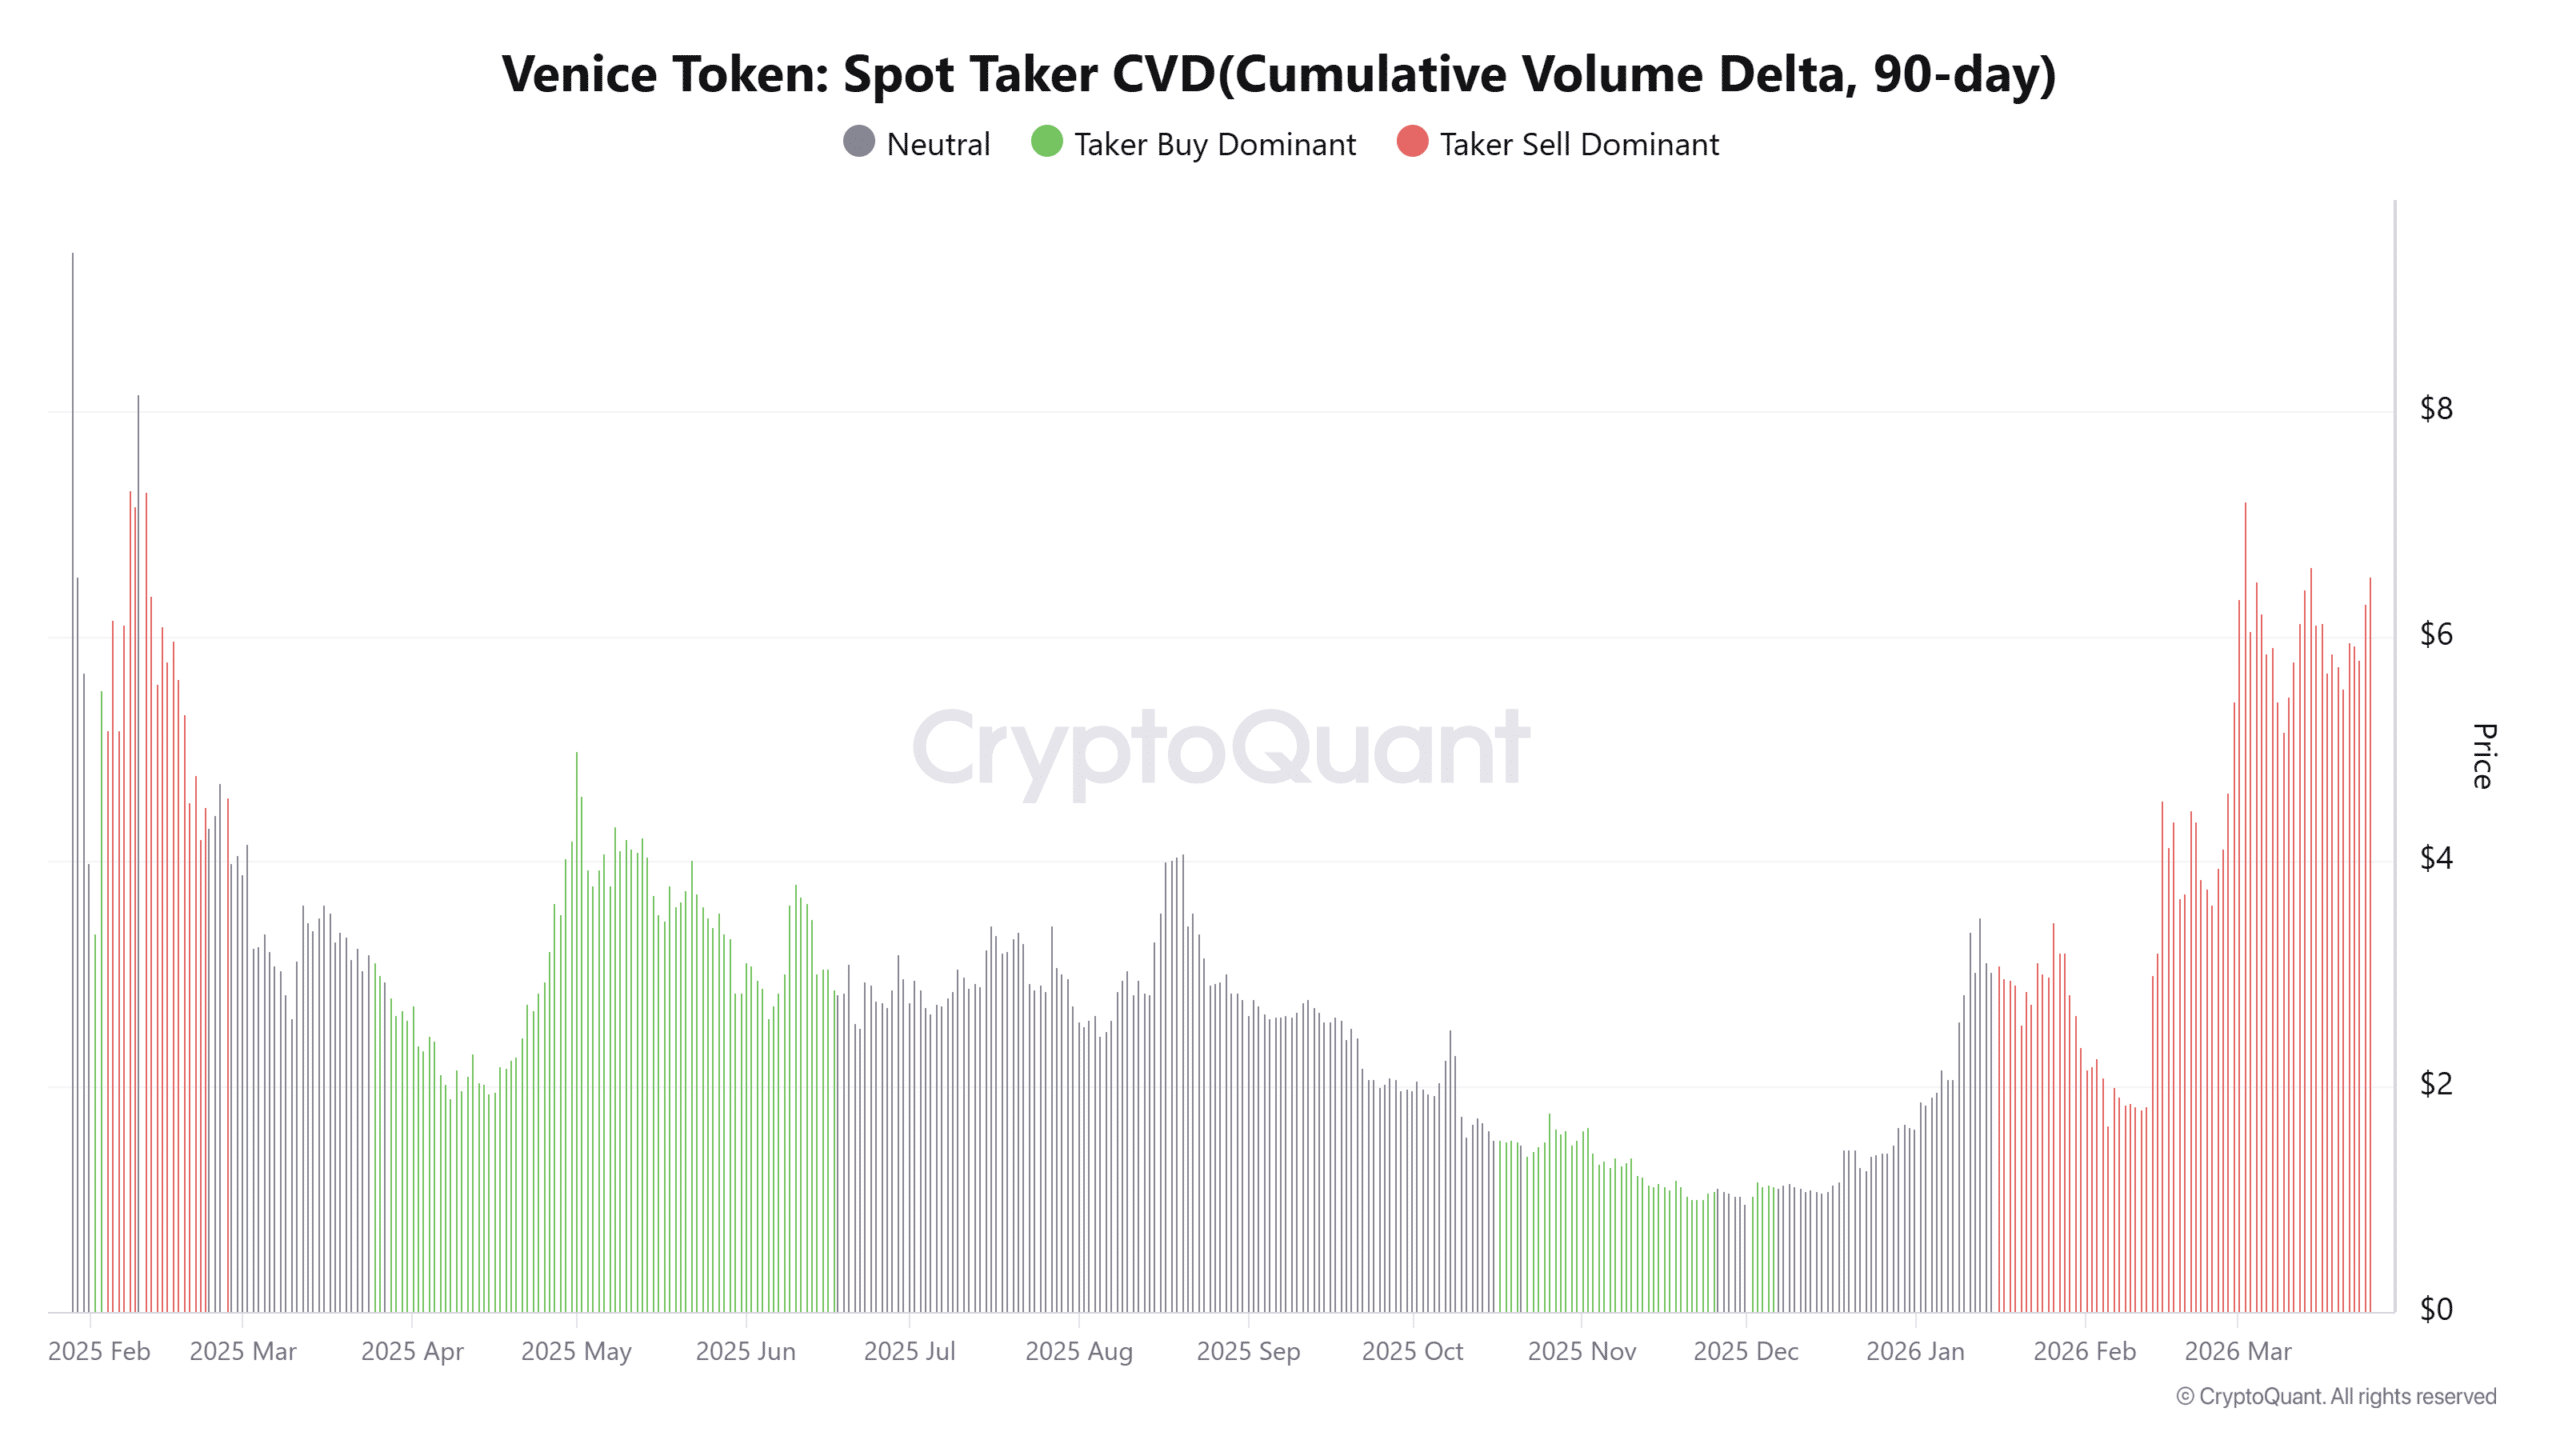
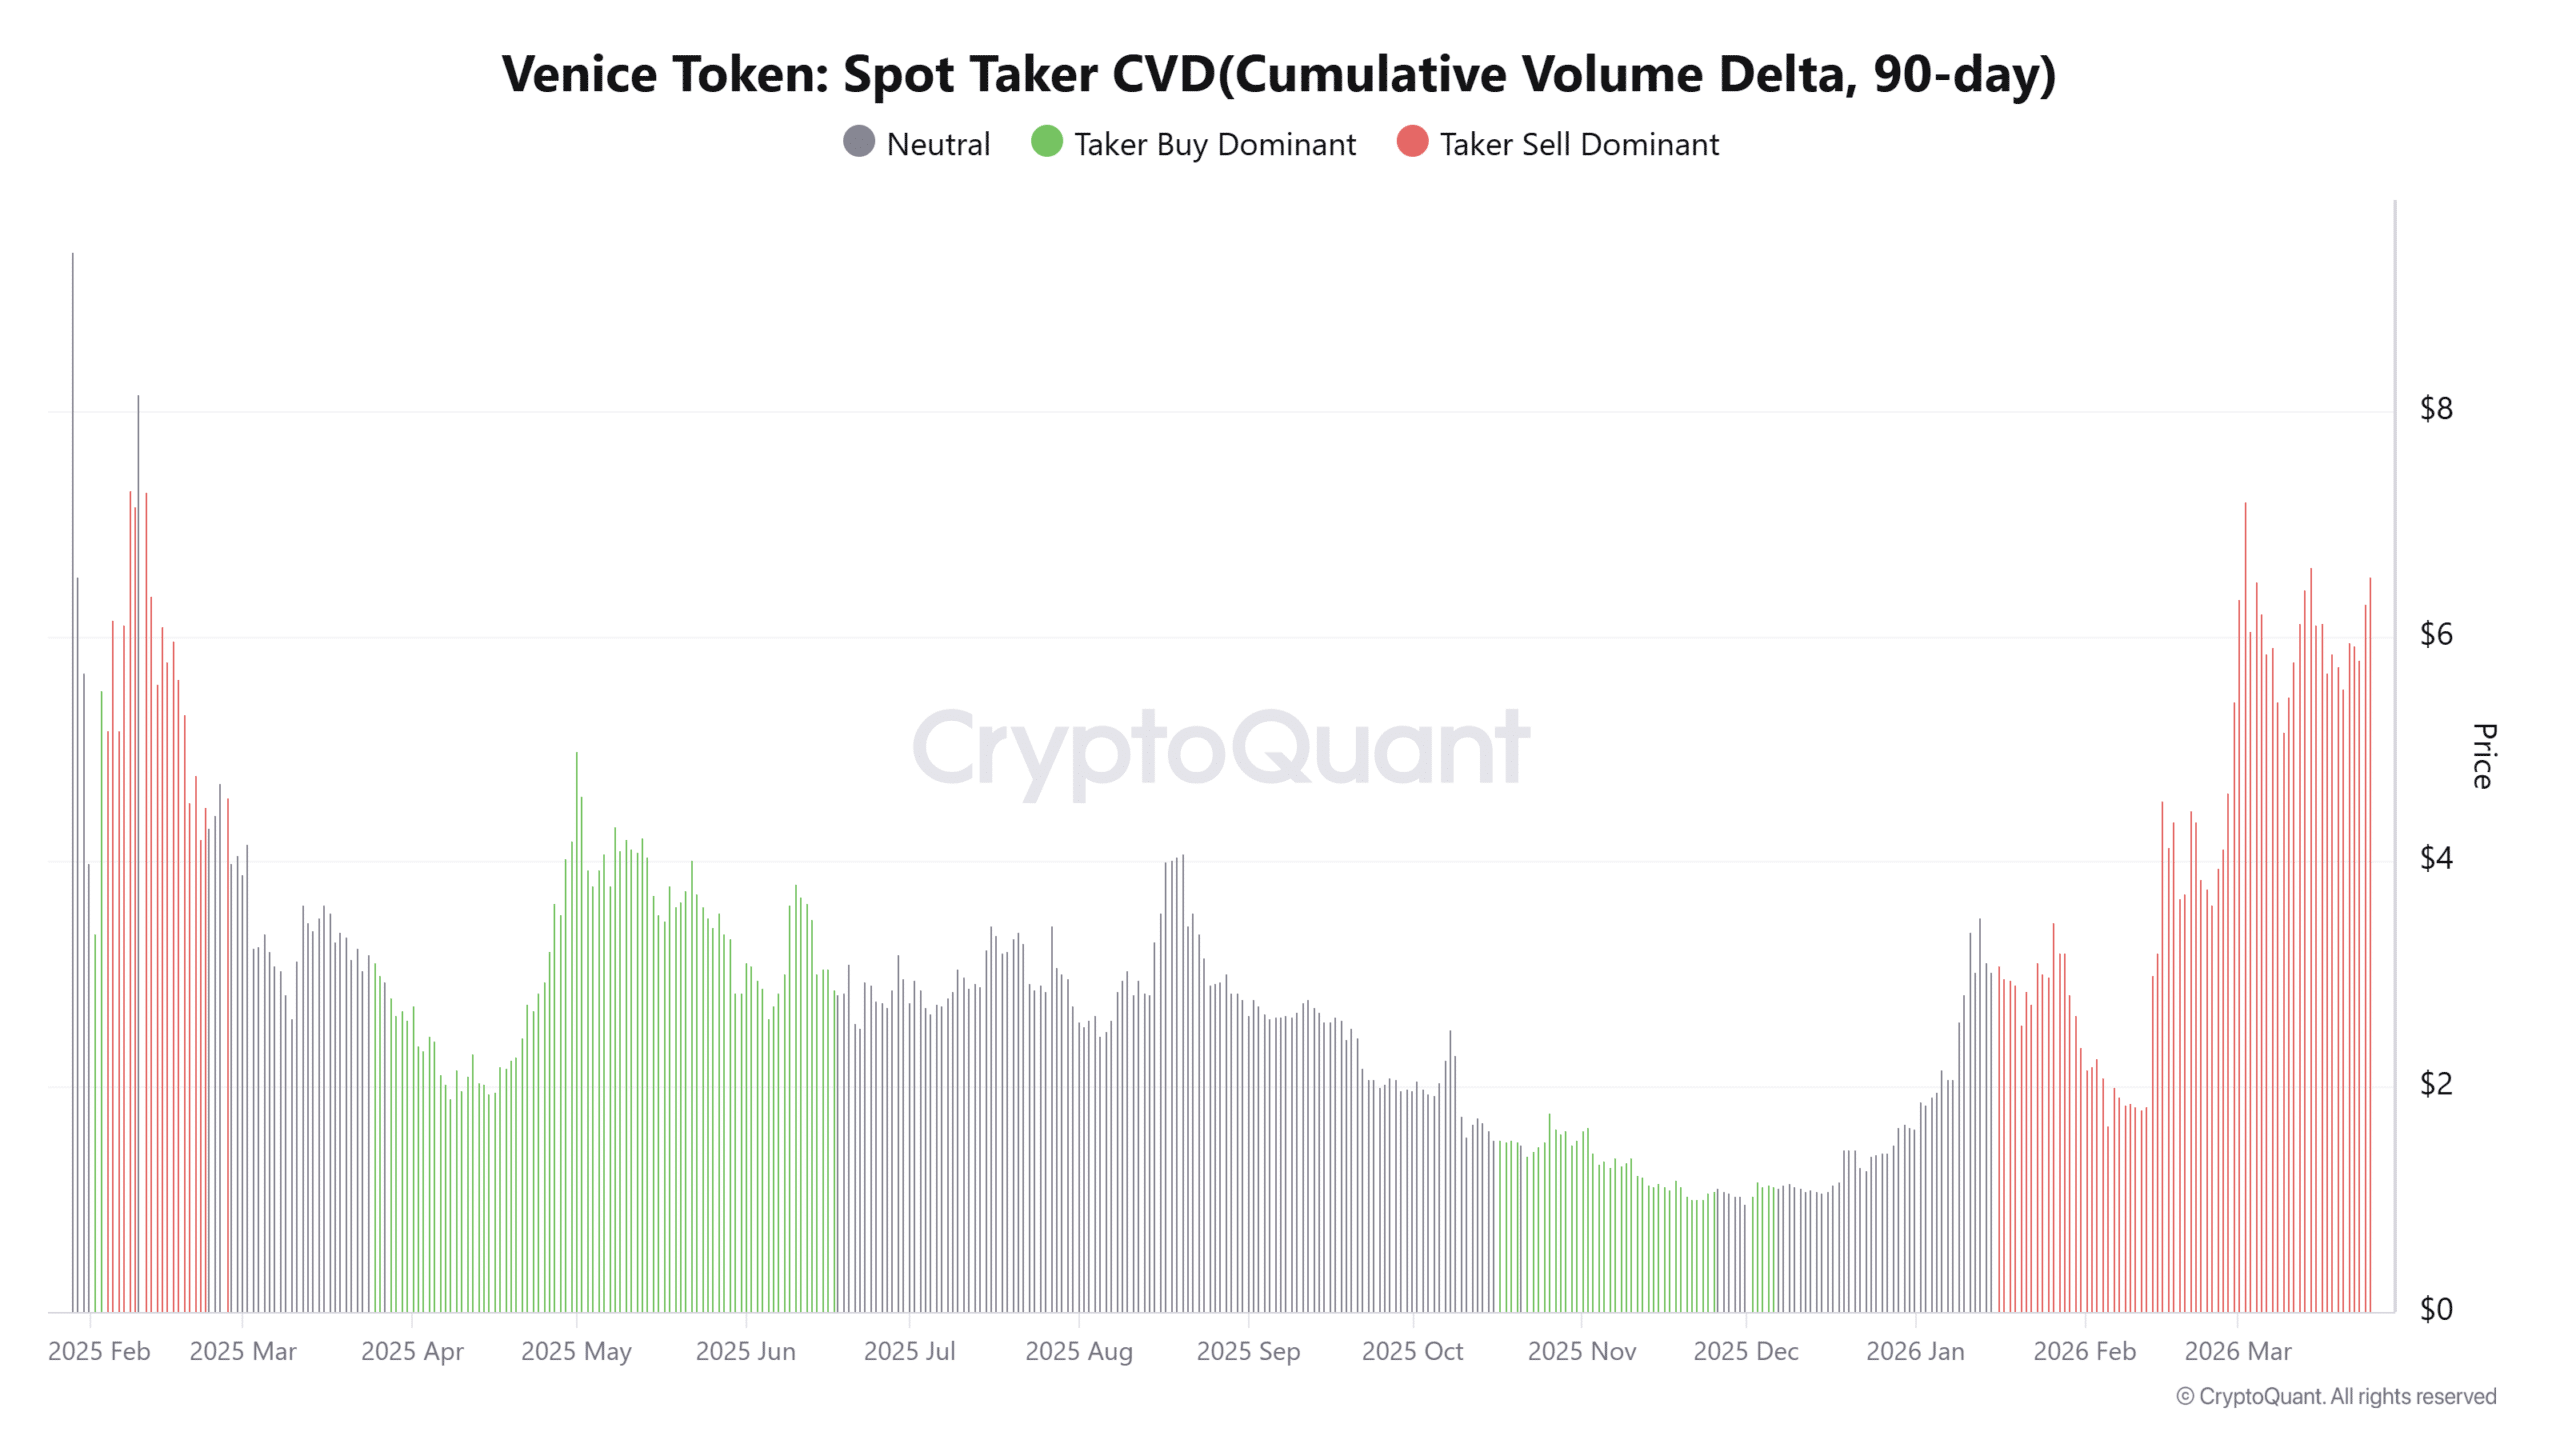
Spot Taker CVD remains sell-dominant over the past 90 days, revealing persistent aggressive selling beneath the rally.
This structure indicates that market participants continue executing sell orders even as price rises.
However, price has not declined, which suggests that larger buyers may be absorbing this supply.
This divergence highlights a key imbalance between visible selling and hidden demand. As a result, the rally depends on continued absorption to sustain upward movement.
If selling pressure intensifies without matching demand, the structure could weaken. However, as long as price holds, this absorption continues supporting the current trend.
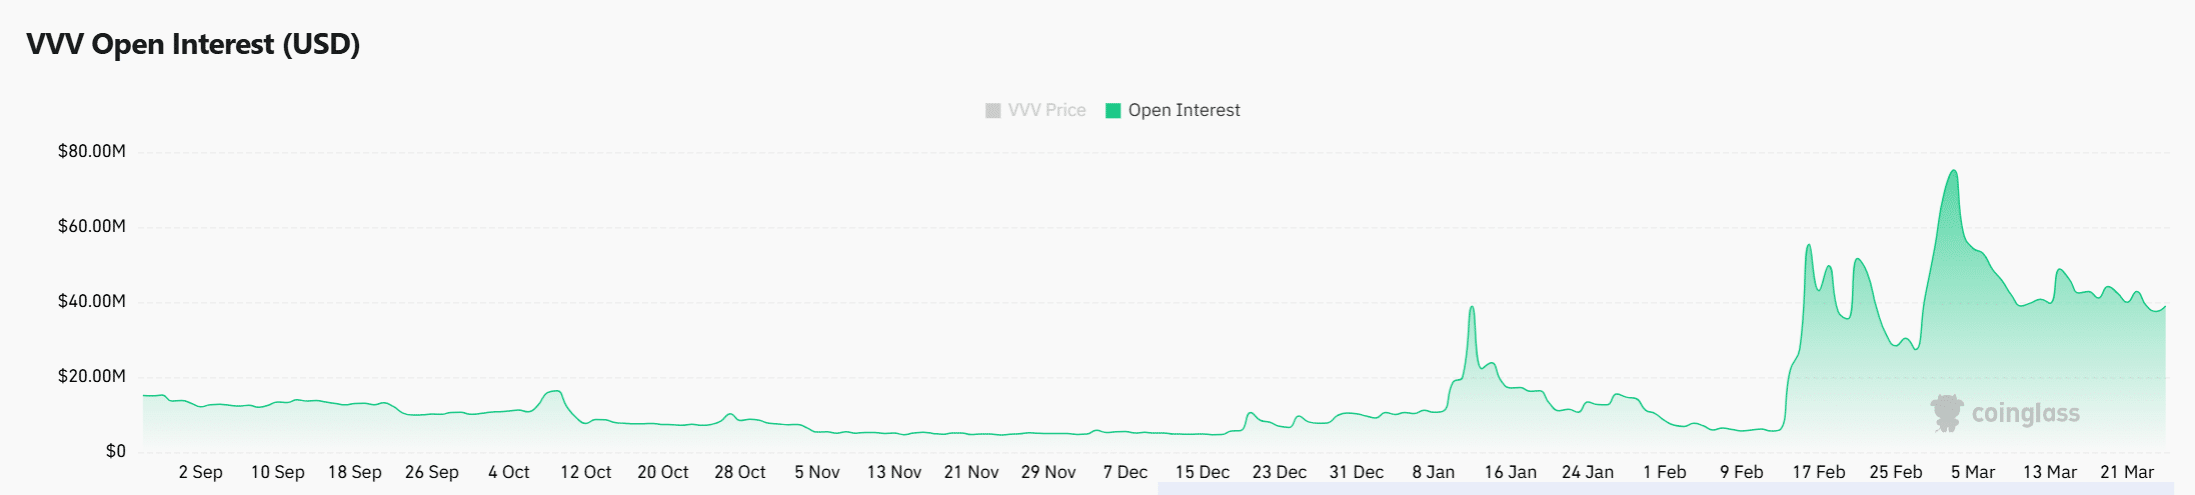
Open interest rise shows leveraged buildup into VVV breakout
Open interest has increased by 18.74% to $43.21M, reflecting growing participation in derivatives markets.
This rise shows that traders are positioning aggressively as price breaks out of consolidation. However, leveraged positioning introduces volatility, especially near resistance zones.
As positions build, the market becomes sensitive to rapid price movements in either direction. This setup often leads to sharp expansions once liquidity gets triggered.
At the same time, rising open interest without strong confirmation from other indicators increases risk.
If price continues higher, these positions could fuel continuation, but any reversal would quickly unwind these leveraged trades.
VVV has broken out with strong volume support, which strengthens its bullish structure. However, weakening MACD signals and persistent sell pressure create underlying tension.
The rally can sustain if buyers continue absorbing supply and hold above $5.14. If that support fails, the breakout would likely weaken quickly under pressure.
Final Summary
- VVV surged 14% to $6.40, backed by a 26% jump in Spot Volume. Breakout above the pennant shifted the structure from consolidation to expansion.
- Open Interest rose 18%, signaling aggressive leveraged positioning. Rising leverage increases the risk of sharp moves, especially near resistance






