"Uninvestable" U.S. Treasuries Might Be the Highest-Returning Asset of 2026

marsbit2026-01-20 tarihinde yayınlandı2026-01-20 tarihinde güncellendi

Özet

Amidst a shifting macroeconomic landscape in 2026, long-term U.S. Treasuries, particularly ETFs like TLT and TMF, are positioned to outperform equities. Key arguments include: gold's 200% rise signaling deflationary risks rather than sustained inflation; unsustainable U.S. interest expenses nearing $1.2 trillion annually; heavy short-term Treasury issuance increasing refinancing risks; and extreme short interest in long bonds creating potential for a squeeze. Additionally, cooling inflation, weak consumer sentiment, and rising trade tensions suggest a deflationary shock. Policy interventions, such as yield curve control or QE, are likely if long yields threaten growth or fiscal stability. With long-duration assets offering convexity and a 4.4–4.7% yield, a 100–200 bps decline in long-term rates could drive 15–45%+ returns, making long bonds a high-upside, asymmetric bet for 2026.

Author: Common Sense Investor (CSI)

Compiled by: Deep Tide TechFlow

Deep Tide Guide: With the dramatic changes in the macro environment in 2026, market logic is undergoing a profound shift. Veteran macro trader Common Sense Investor (CSI) presents a contrarian view: 2026 will be the year bonds outperform stocks.

Based on the U.S. government's heavy interest payment pressure, the deflationary signals released by gold, extremely crowded bond short positions, and imminent trade conflicts, the author believes that long-duration U.S. Treasuries (such as TLT) are at an inflection point with an "asymmetric game" advantage.

At a time when the market generally considers bonds "uninvestable," this article, through rigorous macro-mathematical deduction, reveals why long bonds could become the highest-returning asset of 2026.

Full article below:

Why I'm Overweight TLT and TMF — And Why Stocks Will Underperform in 2026

I do not write these words lightly: 2026 is destined to be the year bonds outperform stocks. This is not because bonds are "safe," but because macro mathematics, positioning, and policy constraints are converging in an unprecedented way—and this situation rarely ends with "Higher for Longer."

I have put my money where my mouth is.

TLT (20+ Year Treasury ETF) and TMF (3x Leveraged 20+ Year Treasury ETF) currently make up about 60% of my investment portfolio. This article compiles data from my recent posts, adds new macro context, and outlines a bullish upside scenario for long-duration bonds, particularly TLT.

Core Arguments at a Glance:

  • Gold's Movement: Gold's historical performance does not预示持续通胀—it预示通缩/deflation risk.
  • Fiscal Deficit: U.S. fiscal math is breaking down: ~$1.2 trillion in annual interest支出, and rising.
  • Issuance Structure: Treasury issuance is skewed short-term, quietly increasing systemic refinancing risk.
  • Short Squeeze: Long bonds are one of the most crowded short positions in the market.
  • Economic Indicators: Inflation data is cooling, sentiment is weak, labor market pressures are rising.
  • Geopolitics: Geopolitical and trade headlines are turning "Risk-off," not "Reflationary."
  • Policy Intervention: Policy always turns towards lowering long-end rates when something cracks.

This combination has historically been rocket fuel for TLT.

Gold Is Not Always an Inflation Alarm

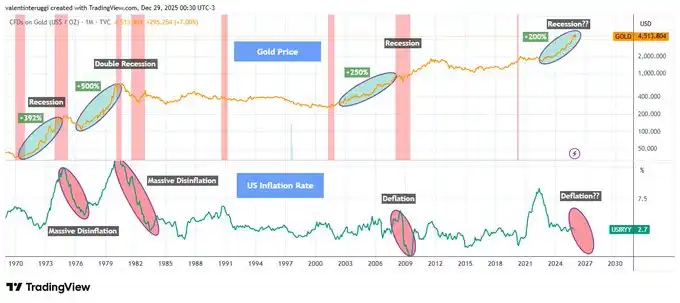
Whenever gold rallies over 200% in a short period, it signals not runaway inflation, but economic stress, recession, and falling real rates (see Chart 1 below).

Historical experience shows:

  • The 1970s gold surge was followed by recession + disinflation.
  • The early 1980s surge was followed by a double-dip recession; inflation was broken.
  • The early 2000s gold rise预示了 the 2001 recession.
  • The 2008 breakout was followed by a deflationary shock.

Since 2020, gold has again risen about 200%. This pattern has never ended in lasting inflation.

When growth flips, gold acts more like a safe-haven asset.

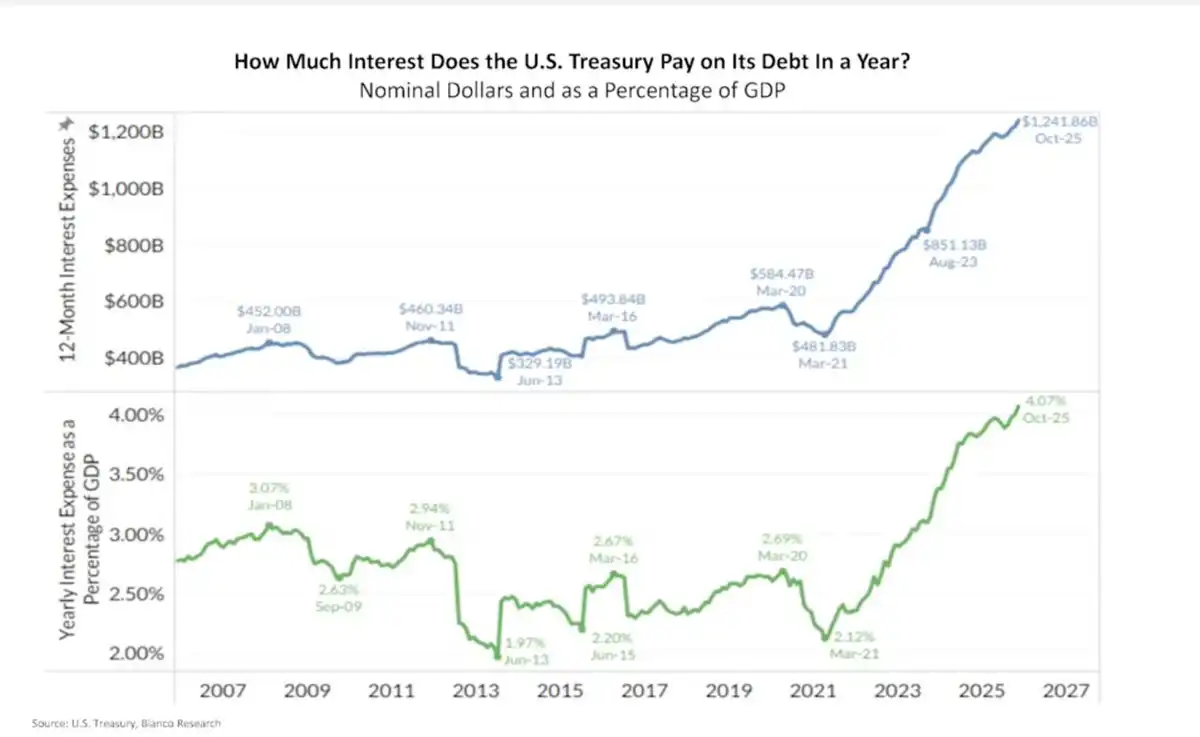
U.S. Interest支出 Is Compounding Explosively

The U.S. currently has annual interest支出 of about $1.2 trillion, roughly 4% of GDP (see Chart 2 below).

This is no longer a theoretical issue. This is real money flowing out—interest compounds rapidly when long-term yields stay high.

This is so-called 「Fiscal Dominance」:

  • High rates mean higher deficits
  • Higher deficits mean more debt issuance
  • More issuance leads to higher Term Premium
  • Higher Term Premium leads to higher interest支出!

This doom loop won't resolve itself with "Higher for Longer." It must be resolved through policy intervention!

Treasury's Short-Term Trap

To alleviate immediate pain, the Treasury has drastically cut long-bond issuance:

  • 20/30-year bonds now make up only ~1.7% of total issuance (see Chart 3 below).
  • The rest has been pushed into short-term Bills.

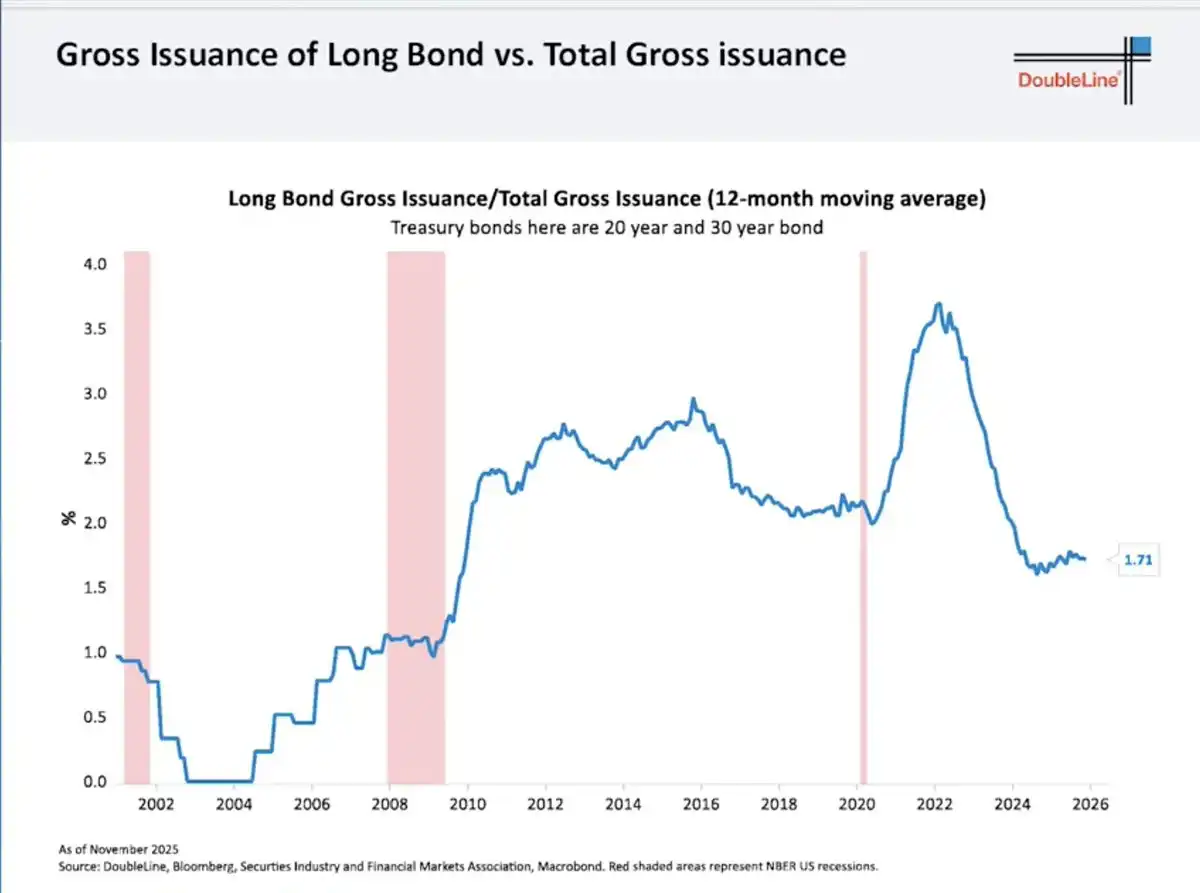
This doesn't solve the problem—it just kicks it down the road:

  • Short-term debt constantly rolls over.
  • Refinancing will happen at future rates.
  • The market sees the risk and demands a higher Term Premium.

Ironically, this is why long-end yields stay high... and why they will collapse violently if growth cracks.

The Fed's Trump Card: Yield Curve Control

The Fed controls the short end, not the long end. When long-end yields:

  1. Threaten economic growth
  2. Trigger explosive fiscal costs
  3. Disrupt asset markets

...the Fed has historically only done two things:

  1. Buy long bonds (QE)
  2. Cap yields (Yield Curve Control)

They won't act preemptively. They only act after stress appears.

Historical references:

  • 2008–2014: 30-year yield fell from ~4.5% to ~2.2% → TLT surged +70%
  • 2020: 30-year yield fell from ~2.4% to ~1.2% → TLT surged +40% in under 12 months

This isn't just theory—this has happened!

Inflation Is Cooling, Economic Cracks Appearing

Recent data shows core inflation falling back to 2021 levels (see Chart 4).

  • CPI momentum is fading.
  • Consumer confidence is at a decade low.
  • Credit pressures are building.
  • The labor market is starting to crack.

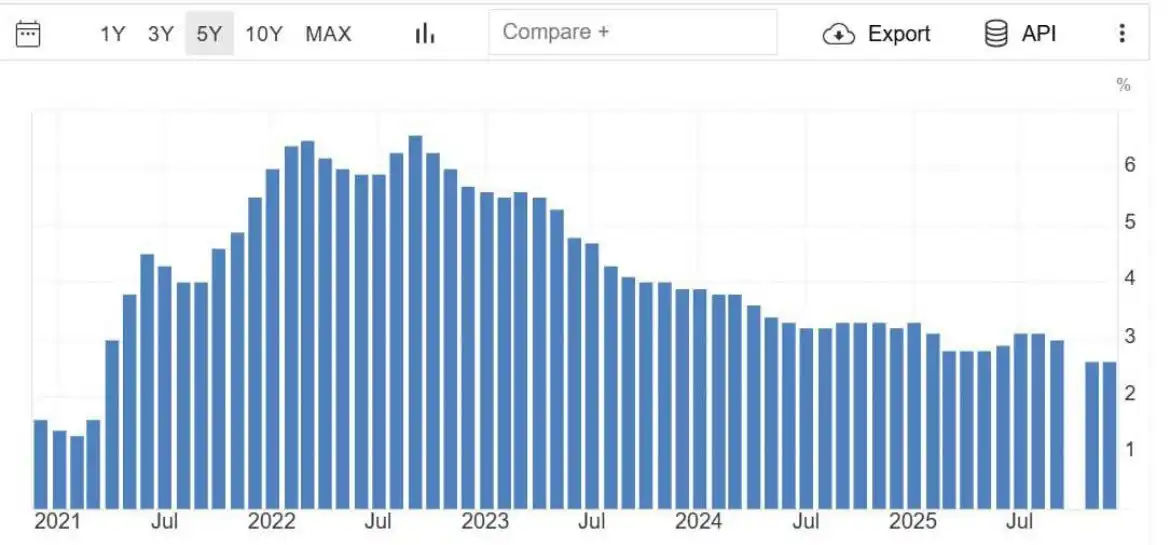
Markets are forward-looking. The bond market is already starting to smell this.

Extremely Crowded Short Position

TLT short interest is extremely high:

  • ~144 million shares sold short.
  • Days to cover exceeds 4 days.

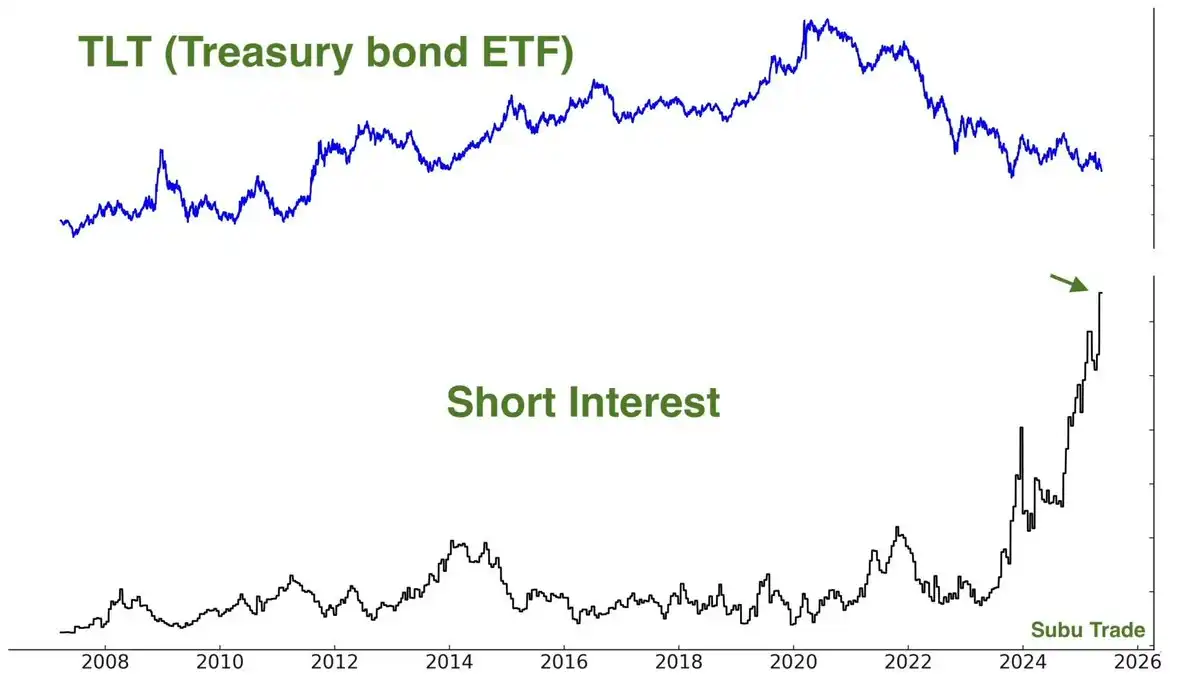
Crowded trades don't unwind slowly. They reverse violently—especially when the market narrative shifts.

And importantly:

"Shorts pile in AFTER the move, not before."

This is classic late-cycle behavior!

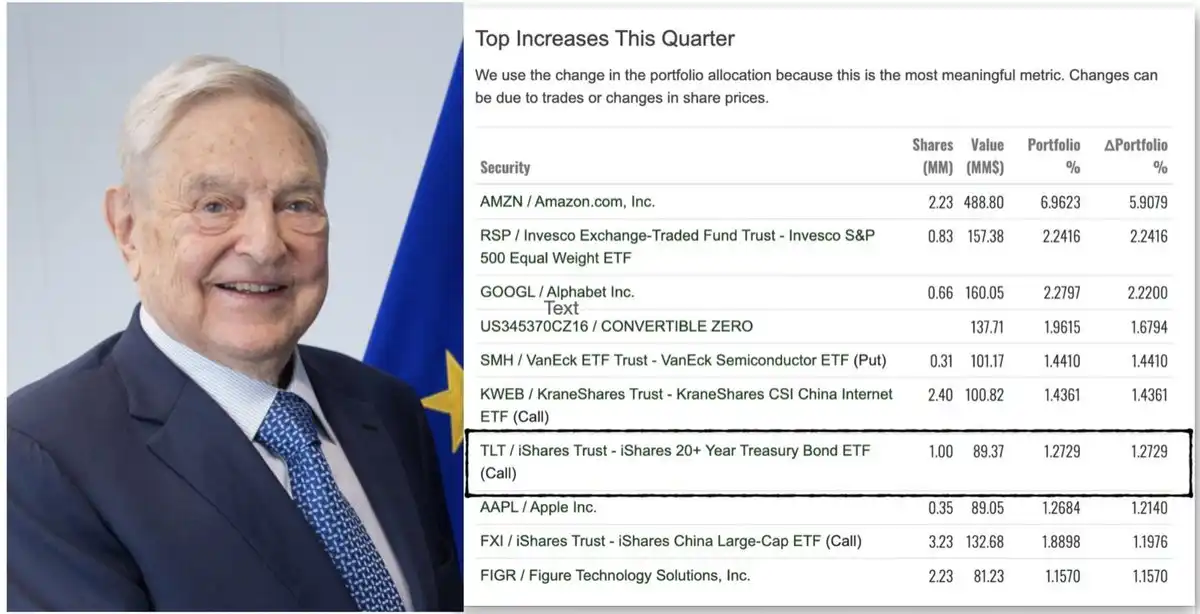
Smart Money Is Moving In

Recent widely circulated 13F institutional holding reports showed a large fund's quarterly increase list featured significant TLT call options.

Whoever it's attributed to, the message is simple: Sophisticated capital is starting to reposition for duration. Even George Soros's fund held TLT call options in its latest 13F disclosure.

Deflationary Shock from Tariff Friction

Recent news is reinforcing the "risk-off" logic. President Trump announced new tariff threats regarding the Denmark/Greenland dispute, and European officials are now openly discussing freezing or suspending participation in the EU-US tariff agreement in response.

Trade friction will:

  • Hit growth
  • Squeeze margins
  • Reduce demand
  • Push capital into bonds over stocks

This is not an inflationary impulse; it's a deflationary shock.

Valuation Mismatch: Stocks vs. Bonds

Today's stock pricing reflects:

  • Strong growth
  • Stable margins
  • Benign financing conditions

While bond pricing reflects:

  • Fiscal stress
  • Sticky inflation worries
  • Permanently high yields

If either of these narratives is wrong, returns will diverge violently.

Long-duration bonds have "convexity"; stocks do not.

$TLT Upside Case Analysis

TLT has:

  • ~15.5 years effective duration
  • You earn ~4.4–4.7% yield while you wait

Scenario Analysis:

  • If long-end yields fall 100 basis points (bps), TLT price return is +15–18%.
  • Fall 150 bps, TLT return is +25–30%.
  • Fall 200 bps (not extreme historically),意味着 it will surge +35–45% or more!

This doesn't include interest income, convexity bonuses, or the accelerating effect of short covering. This is why I see "asymmetric upside."

Conclusion

Honestly: After the惨状 of 2022, I swore I'd never touch long bonds again. Watching duration assets get crushed was a frustrating experience.

But the market doesn't care about your psychological trauma—it only cares about probabilities and price.

When everyone agrees bonds are "uninvestable," when sentiment bottoms, when shorts pile up, when yields are high and growth risks are rising...

That's when I start buying!

  • TLT + TMF are currently ~60% of my portfolio. I made 75% returns in the 2025 stock market and redeployed most of it into bond ETFs in November 2025.
  • I'm "getting paid to wait" (earning over 4% yield).
  • My position is based on policy and growth shifts, not虚无的 narrative.

2026 will finally be the "Year of the Bond."

İlgili Sorular

QAccording to the article, why does the author believe long-duration U.S. Treasuries (like TLT) could be the highest-returning asset in 2026?

AThe author believes a combination of factors creates an 'asymmetric bet' for long bonds: unsustainable U.S. interest expenses, gold price signaling deflationary risks, extremely crowded short positions in bonds, cooling inflation, emerging economic weaknesses, and the high probability of policy intervention (like QE or Yield Curve Control) to lower long-term rates, which would cause their prices to surge.

QWhat historical pattern does the author cite regarding gold's performance and what it has typically preceded?

AThe author states that historically, whenever gold has risen over 200% in a short period, it has not signaled persistent inflation but instead preceded economic stress, recession, and falling real interest rates (disinflation/deflation). Examples given are the 1970s, early 1980s, 2000s, and 2008.

QWhat is 'Fiscal Dominance' as described in the article, and why is it a problem for the U.S.?

A'Fiscal Dominance' is described as a vicious cycle where high interest rates lead to higher budget deficits, which require more government debt issuance. This increased issuance leads to a higher term premium (the extra yield investors demand for holding long-term bonds), which in turn leads to even higher interest expenses, creating a self-reinforcing loop that is unsustainable.

QHow does the current structure of U.S. Treasury debt issuance create a 'short-term trap'?

AThe Treasury has drastically reduced the issuance of long-term bonds (20/30-year) to about 1.7% of total issuance, pushing most of the borrowing into short-term bills. This doesn't solve the debt problem; it merely kicks it down the road. These short-term bills must be constantly refinanced at future (potentially higher) rates, increasing systemic refinancing risk and keeping long-term yields high due to the market's perceived risk.

QWhat specific market positioning factor does the author highlight as a potential catalyst for a rapid price increase in long-term bond ETFs like TLT?

AThe author highlights the extremely crowded short interest in TLT, with approximately 144 million shares sold short and a high 'days to cover' ratio. This creates the conditions for a violent short squeeze, where a shift in market narrative would force short sellers to buy back shares rapidly, accelerating any upward price move.

İlgili Okumalar

Has the 'Digital Gold' Narrative for BTC Failed?

**Title: Has the "Digital Gold" Narrative for Bitcoin Failed?** The article argues that Bitcoin's "digital gold" narrative remains valid despite a recent sharp price decline (from a peak near $126k in Oct 2025 to briefly under $61k in Feb 2026). It presents a long-term investment framework based on three core points: **1. Viewing Bitcoin as an Asset:** Bitcoin is presented as a superior potential store of value compared to gold. Key arguments are its absolute scarcity (21 million cap), superior portability, and transparent auditability via its public ledger. While acknowledging its current use in early, volatile stages (~3-4% global adoption), the author draws parallels to the early, disruptive phases of the internet and e-commerce. **2. Understanding the Recent Downturn:** The current ~50% correction is framed as a predictable, consensus-driven cycle following its post-halving peak (the 2024 halving preceded the Oct 2025 high). A crucial factor is a historic "changing of hands": the influx of new institutional buyers via ETFs allowed early, low-cost holders (miners, OG believers) to take profits. The author notes that while severe, Bitcoin's historical drawdowns (e.g., 93% in 2011, 77% in 2021-22) have been progressively smaller, suggesting maturing holder structure and decreasing volatility over time. **3. The Long-Term Perspective:** The long-term thesis hinges on Bitcoin capturing a portion of gold's market value. With Bitcoin's market cap at ~$1.4 trillion (at $70k) versus gold's ~$20 trillion, significant upside potential exists if the "digital gold" narrative is partially realized. However, the author strongly cautions that short-term risks remain, the bottom is unpredictable, and high volatility is inherent. The real risk is not Bitcoin failing but poor personal position management (over-leverage, wrong capital) and a lack of deep understanding, which can force investors out during severe downturns. The conclusion uses Amazon's 95% crash post-2000 dot-com bubble and subsequent 42x recovery as an analogy. The ultimate question is not if Bitcoin's price will rise, but if an investor's strategy and conviction can withstand the volatility to see the long-term play out. The recent divergence (gold up, Bitcoin down) is posed not as a narrative failure, but as potential evidence of this ongoing, painful transition from a speculative asset to a mainstream allocation.

marsbit6 saat önce

Has the 'Digital Gold' Narrative for BTC Failed?

marsbit6 saat önce

Has BTC's 'Digital Gold' Narrative Failed?

The article discusses Bitcoin's "digital gold" narrative, its recent price drop, and long-term outlook through the perspective of "Jason". It argues the narrative is not a failure but that Bitcoin represents a superior, new asset class due to its fixed supply (21 million), portability, and auditability. The piece compares its current ~3-4% global adoption rate to early internet/e-commerce, suggesting significant growth potential. Regarding the 2025-2026 price decline (from ~$126k to briefly under $61k), the author views it as a predictable, consensus-driven sell-off within Bitcoin's ~4-year cycle post-halving, exacerbated by a major "handover" from early, low-cost holders to new institutional buyers via ETFs. A key observation is that historical peak-to-trough drawdowns have lessened over time (e.g., 93% in 2011 to ~50% in 2026), indicating maturing volatility as holder structure changes. For the long term, the author uses a simple framework: Bitcoin's total market cap (~$1.4T at $70k) is only about 7% of gold's (~$20T). Even capturing 30-50% of gold's value would imply substantial upside. However, the article strongly cautions against viewing this as investment advice, emphasizing extreme volatility and the critical importance of risk management, position sizing, and deep fundamental understanding to survive severe drawdowns. It concludes by drawing a parallel to Amazon's 95% crash in 2000 and subsequent 42x recovery, stressing that the key is surviving market cycles to realize long-term potential.

链捕手6 saat önce

Has BTC's 'Digital Gold' Narrative Failed?

链捕手6 saat önce

From Code to Cognition: A Ten-Thousand-Word Guide to the Evolution of the Robot Brain

"From Code to Cognition: The Evolution of Robot Brains" The journey of robotic intelligence has shifted dramatically from manually coded systems to AI-driven brains. For decades, robots relied on layered software stacks—perception, state estimation, planning, control—each handcrafted. While predictable, they lacked adaptability. The 2010s saw deep learning revolutionize perception (e.g., object detection) and control (via reinforcement learning), but learned skills remained narrow. The arrival of Large Language Models (LLMs) marked a turning point. LLMs acted as high-level planners, interpreting natural language instructions and generating sequences of actions for traditional robotic systems to execute. However, true integration came with Visual-Language-Action (VLA) models, which fused vision, language, and motion prediction into a single network. Pioneered by models like RT-2 and open-source projects like OpenVLA, VLAs enable robots to reason and act directly from visual input and commands. The most advanced humanoid robots now employ a "dual-brain" architecture: a slow-thinking, large VLA (System 2) for reasoning and planning, and a fast-reacting, small network (System 1) for high-frequency motion control, sometimes with an even lower-level System 0 for balance. This split balances cognition with the physics of real-time movement. Computation is split between onboard hardware (e.g., NVIDIA Jetson) for safety-critical control loops and cloud/edge servers for non-critical tasks like learning and interfaces. A crucial driver is the open-source ecosystem—models like GR00T and OpenVLA allow startups to build upon pre-trained brains and fine-tune them with their own data, accelerating development. Despite progress, current systems struggle with recovery from errors, sample inefficiency, and long-horizon tasks. This has spurred the rise of **World Models**—neural networks that predict the consequences of actions. By simulating possible futures before acting (like NVIDIA Cosmos or Meta V-JEPA), robots can plan, recover, and generalize better. This represents the next frontier: shifting intelligence from learned reactions to an internal model of physics and cause-and-effect. The field is rapidly evolving. While not yet at its "ChatGPT moment," the convergence of cheaper hardware, scalable simulation, and world models points toward robots that are increasingly capable, adaptive, and useful. The question is shifting from "what can robots do?" to "what *should* they do?"

marsbit6 saat önce

From Code to Cognition: A Ten-Thousand-Word Guide to the Evolution of the Robot Brain

marsbit6 saat önce

İşlemler

Spot
Futures
活动图片