The Advancing MM 3: Statistical Edge and Signal Design

深潮2025-12-28 tarihinde yayınlandı2025-12-28 tarihinde güncellendi

Özet

Title: The Attack of MM 3: Statistical Edge and Signal Design Author: Dave This article, the third in the "Attack of MM" series, explores how market makers (MMs) actively gain a "micro alpha" advantage through statistical edges and signal design, rather than just passively adjusting quotes. Micro alpha refers to a conditional probability shift in predicting short-term price movements (within ~100ms to ~10s), such as the direction of the next price change, mid-price drift, or trade asymmetry. It is not about forecasting trends but detecting probabilistic biases that allow MMs to act preemptively—buying before likely price increases, withdrawing bids before declines, or reducing exposure during risky periods. Key signals discussed include: - **Order Book Imbalance (OBI)**: Measures the normalized volume difference between buy and sell orders near current prices. - **Order Flow Imbalance (OFI)**: Tracks aggressive taker orders that drive price changes. - **Queue Dynamics**: Analyzes order queue behavior, including hidden orders (icebergs) and spoofing (fake large orders to manipulate perception). - **Cancel Ratio (CR)**: Indicates liquidity withdrawal rates, signaling market instability. The article emphasizes that speed is MMs' absolute advantage. Lower latency enables faster reaction to market events, facilitating latency arbitrage by executing orders before competitors. In crypto exchanges, some players even get priority execution rights, highlighting th...

Author: Dave

"The Advancing MM 1: Market Maker Inventory Quoting System"

"The Advancing MM 2: Market Maker Order Book and Order Flow"

The first two parts discussed order flow and inventory quoting, making it sound like market makers can only adjust passively. But do they have proactive methods? The answer is yes. Today, we introduce statistical edge and signal design, which are the "micro alpha" pursued by market makers.

1. Market Maker's Alpha?

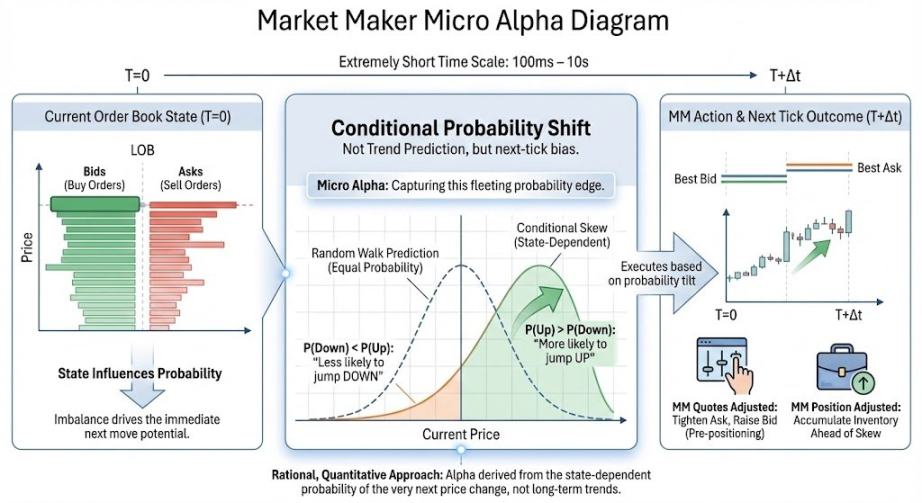
Micro alpha refers to the "conditional probability shift" in the direction of the next price movement / mid-price drift / trade asymmetry on an extremely short time scale (~100ms to ~10s). It's important to note that the alpha in the eyes of market makers is not about trend prediction or guessing price changes; it only requires a probability shift, which is different from the alpha we commonly talk about. Let me explain in simpler terms:

A market maker's statistical edge can be understood as whether, within an extremely short time window, the order book state is "inclined" to move the price in a certain direction first. If a market maker successfully calculates the probability of the next millisecond's price movement using some indicators, they can: 1. Be more willing to buy before a likely price increase. 2. Withdraw buy orders faster before a likely price drop. 3. Reduce exposure during risky moments.

The financial basis for predicting the next price direction is: Due to factors like order flow, order volume, and order book cancellation ratio (which we'll discuss later), the market is not a "random walk" Brownian motion in a short instant but has a direction. The above statement is the financial translation of the mathematical concept of "conditional probability."

With this alpha, market makers can directionally operate on prices. The "market makers" finally earn money from price movements, not just service fees like spreads.
2. Classic Signals Introduction

2.1 Order Book Imbalance: OBI

OBI measures which side has "more people standing" near the current price level. It is a standardized volume differential statistic.
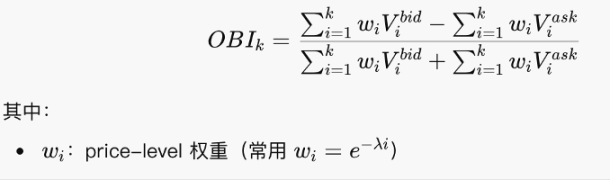
The formula is actually not difficult; it's just a proportional logic of summation. It checks whether there are more buy or sell orders. An OBI approaching 1 indicates almost all are buy orders, with a thick bottom. Approaching -1 indicates a thick top. Approaching 0 suggests a relatively symmetric buy-sell balance.

Note that OBI is a "static snapshot." It's a classic indicator but not very effective alone; it must be used with cancellation ratios, order book slope, etc.

2.2 Order Flow Imbalance (OFI)

OFI measures who has been actively attacking in a recent short period. OFI is the first-order driving factor of price changes because prices are pushed by taker orders, not by placed orders.
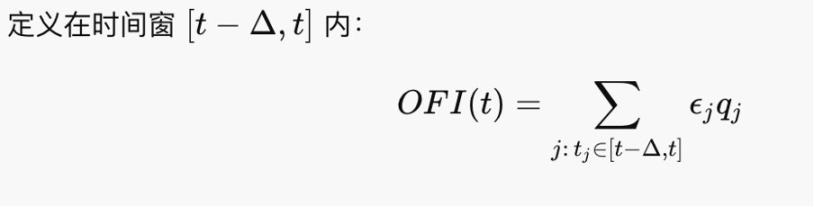
It feels like net buying/selling volume. In the Kyle (1985) framework, ΔP ≈ λ ⋅ OFI, where λ is tick depth. Thus, OFI is the factor driving price changes.

2.3 Queue Dynamics (Queue)

Most exchanges now use continuous auction rules based on best price and first-come-first-served (FCFS) principles, so submitted orders queue up to be filled. The queue represents the order placement situation, which determines the order book state. Abnormal order book states (including order replenishment and cancellation)暗示 directional price changes, i.e., micro alpha.

Two situations to note in the queue:

1. Iceberg: Hidden Orders

Example: Only 10 lots are shown on the surface, but every time they are filled, another 10 lots are immediately replenished. The real intention might be 1,000 lots. The method I introduced in Part 1 for annoying market makers to lower costs is essentially manually creating an iceberg. In practice, some players use iceberg orders to conceal their true volume.

2. Spoof (Fake Orders)

Placing a large order on one side to create a "false pressure illusion" and canceling it quickly before the price approaches. Spoofing pollutes OBI, slope, etc., making the queue artificially thicker and increasing movement risk. Additionally, large spoofs can intimidate the market and potentially manipulate prices. For instance, the London Stock Exchange caught someone manipulating forex in 2015 using spoofing. In crypto, we can also manually spoof to annoy market makers, but if you actually get filled, your exposure becomes significant.

2.4 Order Book Cancellation Ratio (Cancel Ratio)

The cancellation ratio is an estimate of the "disappearance rate" of liquidity:
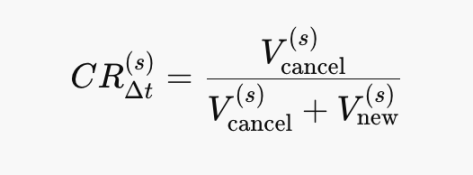
Cancel↑ ⇒ Slope↓ ⇒ λ↑ ⇒ ΔP more sensitive. It is an instability signal领先于 OFI. CR→1: Almost pure cancellations. CR→0: Almost pure order replenishment. The mathematical formulas in this part are very simple; you can interpret them by looking at the diagrams.

CR↑ ⟹ The passive side perceives future risk increasing. CR is also not used alone; it is used together with OFI and other indicators.

The above might just be some old-school order book games. The evolution of market making is rapid, and with stocks moving on-chain, market makers like JS might need to engage in on-chain market making. However, these indicators are still very useful and inspiring.

3. The Absolute Domain of Market Makers: Speed

We often hear in movies that a certain fund has faster internet speed, making it more powerful. Many market makers even move their server rooms closer to exchange servers. Why is that? Finally, let's talk about the advantages of physical equipment and the unique "trading advantages" of crypto exchanges.

Latency Arbitrage is not about predicting future prices but executing buy/sell orders at more favorable prices before others "react." In theoretical models: Prices are continuous, and information is synchronized. But in reality: The market is event-driven, and information arrives asynchronously. Why does information arrive asynchronously? Because receiving price signals from the exchange and sending order instructions to the exchange both take time—a limitation of the physical world. Even in fully compliant markets: Different exchanges, data sources, matching engines, and geographical locations cause delays. Thus, market makers with more advanced equipment have the initiative.

This tests the market maker's own capabilities and has little to do with other players, so I consider it their absolute domain.

A simple example: Suppose you want to sell a certain amount. You quote at the best selling price in the market, which should theoretically get filled. But I also want to sell. Since I see the price and quote faster than you, I get my order filled first. Your inventory cannot be sold, preventing your position from returning to neutral. Real situations are much more complex.

An interesting point: Since there are no regulatory laws yet, almost all crypto exchanges can directly grant priority filling rights to designated accounts. This means allowing certain accounts to jump the queue. This is especially common in smaller exchanges. It seems that being an "insider" in crypto is as important as in research. Whether you can execute trades safely is a crucial step from alpha theory to practice.
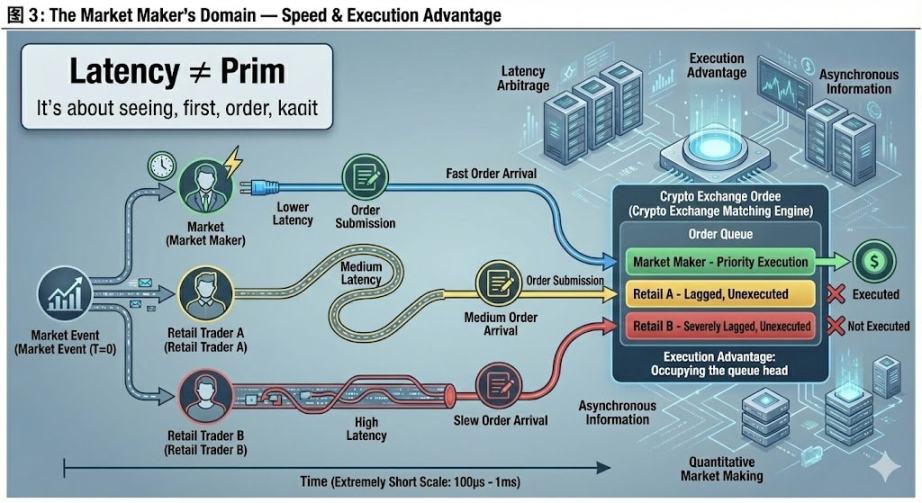
This part attempts to write from the perspective of a market maker. Actual operations are certainly more complex. For example, dynamic queue alone has many details to consider in practice. Welcome for comments from experts.

Postscript: There is a regret with this article. I originally wanted to use the title "Domain Expansion in Market Making" to discuss dynamic hedging and options, as I believe this is the conceptually most challenging part of market making, worthy of the big move "Domain Expansion." But after working on it for a day, I couldn't figure out how to explain it systematically, so I switched to discussing micro alpha. Teacher @agintender has an article mentioning many professional hedging concepts; I encourage everyone to take a look.


İlgili Sorular

QWhat is the concept of 'micro alpha' from a market maker's perspective, and how does it differ from traditional alpha?

AMicro alpha refers to a conditional probability shift in the direction of the next price movement, mid-price drift, or trade asymmetry over extremely short time scales (~100ms to ~10s). It is not about trend prediction or guessing price changes like traditional alpha, but rather about short-term probabilistic advantages derived from order flow, order book state, and cancellation ratios.

QHow does Order Book Imbalance (OBI) function as a signal, and what are its limitations?

AOBI measures the normalized volume difference between buy and sell orders near the current price level, indicating which side has more liquidity. It approaches 1 if buy orders dominate, -1 if sell orders dominate, and 0 if balanced. However, OBI is a static snapshot and is ineffective alone; it must be combined with other metrics like cancellation ratios and order book slope for practical use.

QWhat role does Order Flow Imbalance (OFI) play in price movement, and how is it mathematically related to price changes?

AOFI measures which side is actively attacking by tracking the net flow of taker orders over a short period. It is a primary driver of price changes, as prices are pushed by taker activity rather than passive orders. In the Kyle (1985) framework, the price change ΔP is approximately proportional to OFI multiplied by the tick depth (λ), i.e., ΔP ≈ λ · OFI.

QWhy is speed considered the 'absolute domain' of market makers, and how does latency arbitrage work?

ASpeed is critical because market information arrives asynchronously due to physical constraints like data transmission delays and geographical distances. Market makers with faster infrastructure can execute trades at favorable prices before others react, exploiting latency arbitrage. This involves acting on price signals and submitting orders more quickly than competitors, ensuring priority in trade execution.

QHow do spoofing and iceberg orders affect queue dynamics and market maker strategies?

AIceberg orders hide large order sizes by displaying only a small portion, replenishing after execution, which masks true intent. Spoofing involves placing large fake orders to create false pressure, which are canceled before execution. Both tactics distort signals like OBI and order book slope, increasing movement risk and complicating market makers' ability to gauge true liquidity and direction.

İlgili Okumalar

Must-Watch Events Next Week|CLARITY Act Could Face Senate Vote; SpaceX, Circle to Report Earnings (8.3-8.9)

**Summary: Key Events and Developments to Watch (August 3-9)** The upcoming week is marked by significant financial disclosures, key legislative deadlines, and notable product updates. **Major Financial Events:** Several companies are scheduled to release their Q2 2026 earnings. American Bitcoin (ABTC) will report on August 3, followed by SpaceX and Hut 8 Mining Corp. on August 4, and Circle on August 5. Notably, a significant portion of SpaceX shares (up to 12% of total shares) will be unlocked on August 6 following their earnings release. **Key Legislative Deadline:** The U.S. Senate faces an August 7 deadline to secure 60 votes for the CLARITY Act, a bipartisan bill aiming to establish a federal regulatory framework for cryptocurrencies. The Senate may hold a full vote on the bill during the week. **Economic Data:** The U.S. July Non-Farm Payrolls report will be released on August 7, providing crucial labor market data. **Technology & Product Updates:** * **Shutdowns:** DeFi portfolio tracker Zapper and wallet app Ctrl Wallet will cease operations on August 3. * **Upgrades:** LayerZero will deprecate its v1 relayers on August 3. XRP Ledger's new version 3.3.0, featuring five new functions, is expected next week. * **AI:** Elon Musk announced that the advanced Grok 4.6 AI model is set for release around August 7. * **Bitcoin:** The BIP-110 forced signaling for a potential Bitcoin network change is scheduled to begin around August 8. **Other Notable Events:** Chinese robotics firm Unitree Tech has set its preliminary price inquiry for its IPO for August 5. South Korean exchange Upbit will delist AQT and AERGO tokens on August 3.

marsbit22 dk önce

Must-Watch Events Next Week|CLARITY Act Could Face Senate Vote; SpaceX, Circle to Report Earnings (8.3-8.9)

marsbit22 dk önce

Stocks Are Plummeting More Sharply Than Cryptocurrencies. Where Has the Money Gone?

Stock Markets Plunge Deeper Than Cryptocurrencies: Where Did the Money Go? In late July, Seoul's Kospi index triggered circuit breakers for two consecutive days, plummeting over 40% from its June high. The collapse was led by heavyweight stocks like SK Hynix, whose record profits still disappointed investors, and devastating leveraged ETFs, with one major product losing over 83% of its value. This signaled a global, forced deleveraging targeting the most crowded trades. Interestingly, while stocks exhibited extreme volatility akin to crypto markets, Bitcoin rose nearly 15% in July after a prior steep drop. Analysis shows the money fleeing equities did not flow into Bitcoin. Instead, Bitcoin had already absorbed its sell-off in May-June, when U.S. spot Bitcoin ETFs saw historic outflows. The true safe-haven beneficiary was gold, whose price rose over 20% year-on-year, highlighting a decoupling between Bitcoin and gold as "digital gold." The sell-off was a targeted unwinding of leveraged positions in tech and semiconductors, accelerated by broker-dealer risk management and shifts in the AI narrative, including new competition from Chinese memory chipmakers. The retreat path was clear: from high-valuation tech stocks to cash and U.S. Treasuries, then to gold. For Bitcoin to attract sustained institutional inflows, conditions like eased global liquidity pressure, a "soft-landing" Fed rate cut, and U.S. regulatory clarity via legislation like the stalled CLARITY Act are needed. Currently, Bitcoin is not a safe haven but an already-cleared asset. Its low correlation with tech stocks, however, makes it a potential diversification play for institutional portfolios once the storm passes. The money isn't here yet, but the positioning is underway.

marsbit22 dk önce

Stocks Are Plummeting More Sharply Than Cryptocurrencies. Where Has the Money Gone?

marsbit22 dk önce

In Conversation with Ray Dalio: We Are Currently in an AI Bubble, with 1% of My Portfolio in Bitcoin

Ray Dalio, founder of Bridgewater Associates, warns in an interview that the current AI boom shows classic bubble characteristics, which could lead to significant economic downturns as seen in past cycles like 1929 or 2000. He explains that speculative enthusiasm, fueled by debt and overvaluation, often precedes a crash when rising rates or taxation force asset sales, causing widespread losses and recession. Dalio also outlines his "Big Cycle" theory, describing an approximate 80-year pattern where widening wealth gaps, massive government deficits, and shifting geopolitical power (like China's rise) create internal conflict and global instability. He emphasizes that we are in a late-cycle, transitional phase where traditional powers like the US and UK face decline. For personal wealth protection, Dalio advises diversification beyond cash into assets like stocks, bonds, real estate, and particularly gold, which he prefers over Bitcoin. While he holds about 1% of his portfolio in Bitcoin as a non-printable hard asset, he views gold as more secure from technological or governmental threats. Regarding AI's impact, Dalio believes it will disproportionately benefit capital owners, worsening inequality by replacing both physical and cognitive labor. He suggests that human intuition and emotional intelligence, combined with AI, will be key for future workers. On taxation, Dalio argues that wealth taxes are impractical and risk triggering asset sell-offs, reducing productive investment. He points to the UK as a cautionary example of debt, low productivity, and political strife. Geopolitically, Dalio foresees a more regionalized world, with the US showing weakness in prolonged conflicts like with Iran, akin to past imperial declines. The ideal outcome, he suggests, is coexisting powerful blocs (e.g., Americas, China-Asia Pacific) without major war.

marsbit4 saat önce

In Conversation with Ray Dalio: We Are Currently in an AI Bubble, with 1% of My Portfolio in Bitcoin

marsbit4 saat önce

Daily 7.2 Trillion KRW: Foreign Capital's Record Net Buying on Friday! Wall Street Says Headwinds for Korean Stock Fund Flows Have Subsided

South Korean stock market sees a dramatic shift in fund flows. On July 31, foreign investors made a record net purchase of approximately KRW 7.2 trillion in KOSPI stocks, marking a fundamental reversal from the persistent large-scale net outflows seen in previous months. This contributed to a significant narrowing of foreign net selling in July to KRW 9.8 trillion, down sharply from KRW 48.4 trillion in June and KRW 44.5 trillion in May. Simultaneously, domestic institutional pressure eased. South Korean pension funds and asset managers turned to a net buying position in July, purchasing KRW 1.0 trillion worth of KOSPI shares, contrasting with net sales in May and June. Market volatility is expected to be dampened by new financial regulations. Effective July 31, the Financial Services Commission tightened access for retail investors to single-stock leveraged ETFs by raising the minimum cash deposit requirement. Trading volumes for these products subsequently dropped to about 50% of their monthly average. Citigroup Research maintains its year-end KOSPI target of 10,000 points. The firm cites several supportive factors: the substantial easing of headwinds from capital outflows, a robust fundamental outlook for the semiconductor sector, historically low market valuations, strong economic fundamentals, and the potential for policy support from financial authorities if needed.

marsbit4 saat önce

Daily 7.2 Trillion KRW: Foreign Capital's Record Net Buying on Friday! Wall Street Says Headwinds for Korean Stock Fund Flows Have Subsided

marsbit4 saat önce

İşlemler

Spot
活动图片




