Strategy Watch #2

insights.glassnode2026-03-24 tarihinde yayınlandı2026-03-24 tarihinde güncellendi

Özet

Strategy Watch #2 provides institutional analysis of digital asset fund performance and allocation trends. The report covers six key areas: institutional capital flows, fund performance, macro strategies, on-chain vault returns, manager sentiment, and allocation updates. In February and early March, Bitcoin and Ethereum saw significant net outflows (-$9.6B and -$3.2B respectively), while stablecoins attracted inflows (+$6.2B), suggesting a defensive shift toward lower-risk assets. BTC ETF flows turned positive in March, though institutional conviction remains cautious. DeFi Total Value Locked (TVL) on Ethereum declined sharply, with peak outflows of -$23.7B in February, indicating reduced participation in on-chain yield strategies. CME basis yields continued to tighten, reflecting lower institutional leverage and softer derivatives demand. The report also highlights performance trends, with only one strategy type generating positive returns in February. Over 300 managers shared their three-month market outlook, and a new $750M fund of funds was announced.

The full report is freely available in PDF format.

Download PDF version

Welcome to Strategy Watch #2

Strategy Watch was built to address a clear demand for high-signal, impartial analysis of fund-level performance and allocation trends in digital assets.

The inaugural edition confirmed this demand, reaching a broad audience of key decision makers, from leading global asset managers, hedge funds, major investment banks, top-tier crypto-native funds and Fund of Funds.

Building on this early momentum, our objective is straightforward — to make Strategy Watch a must-read monthly publication for the digital asset investment community.

This publication is strengthened by direct input from market participants. Funds and allocators that contribute data and insights help shape a more complete and valuable view of the landscape.

If you have insights, data, or allocation updates worth sharing, we welcome your contribution.

Present your latest initiatives and updates to a curated audience of institutional allocators.

Share updates ↗

Inside the Latest Strategy Watch

The report is structured across six core sections, each focused on a distinct dimension of institutional activity in digital assets:

01 Institutional Flow Monitor |

02 Fund and SMA Performance | February was a bloodbath, check this section to see the only strategy type that returned positively last month.

03 Strategy Deep Dive: Macro Strategies | Hear firsthand from a macro portfolio manager on how they are navigating the current geopolitical challenges. 

04 On-chain Vault Performance | Are ETH curators underperforming ETH staking yield?

05 Manager Monitor | Find out how more than 300 managers are expecting the crypto market to perform over the next three months.

06 Allocation Updates | New USD 750m Fund of Funds is launching. Check this section to learn more.

in partnership with

The Premier Digital Assets Allocator Platform. Learn more


Institutional Flow Monitor

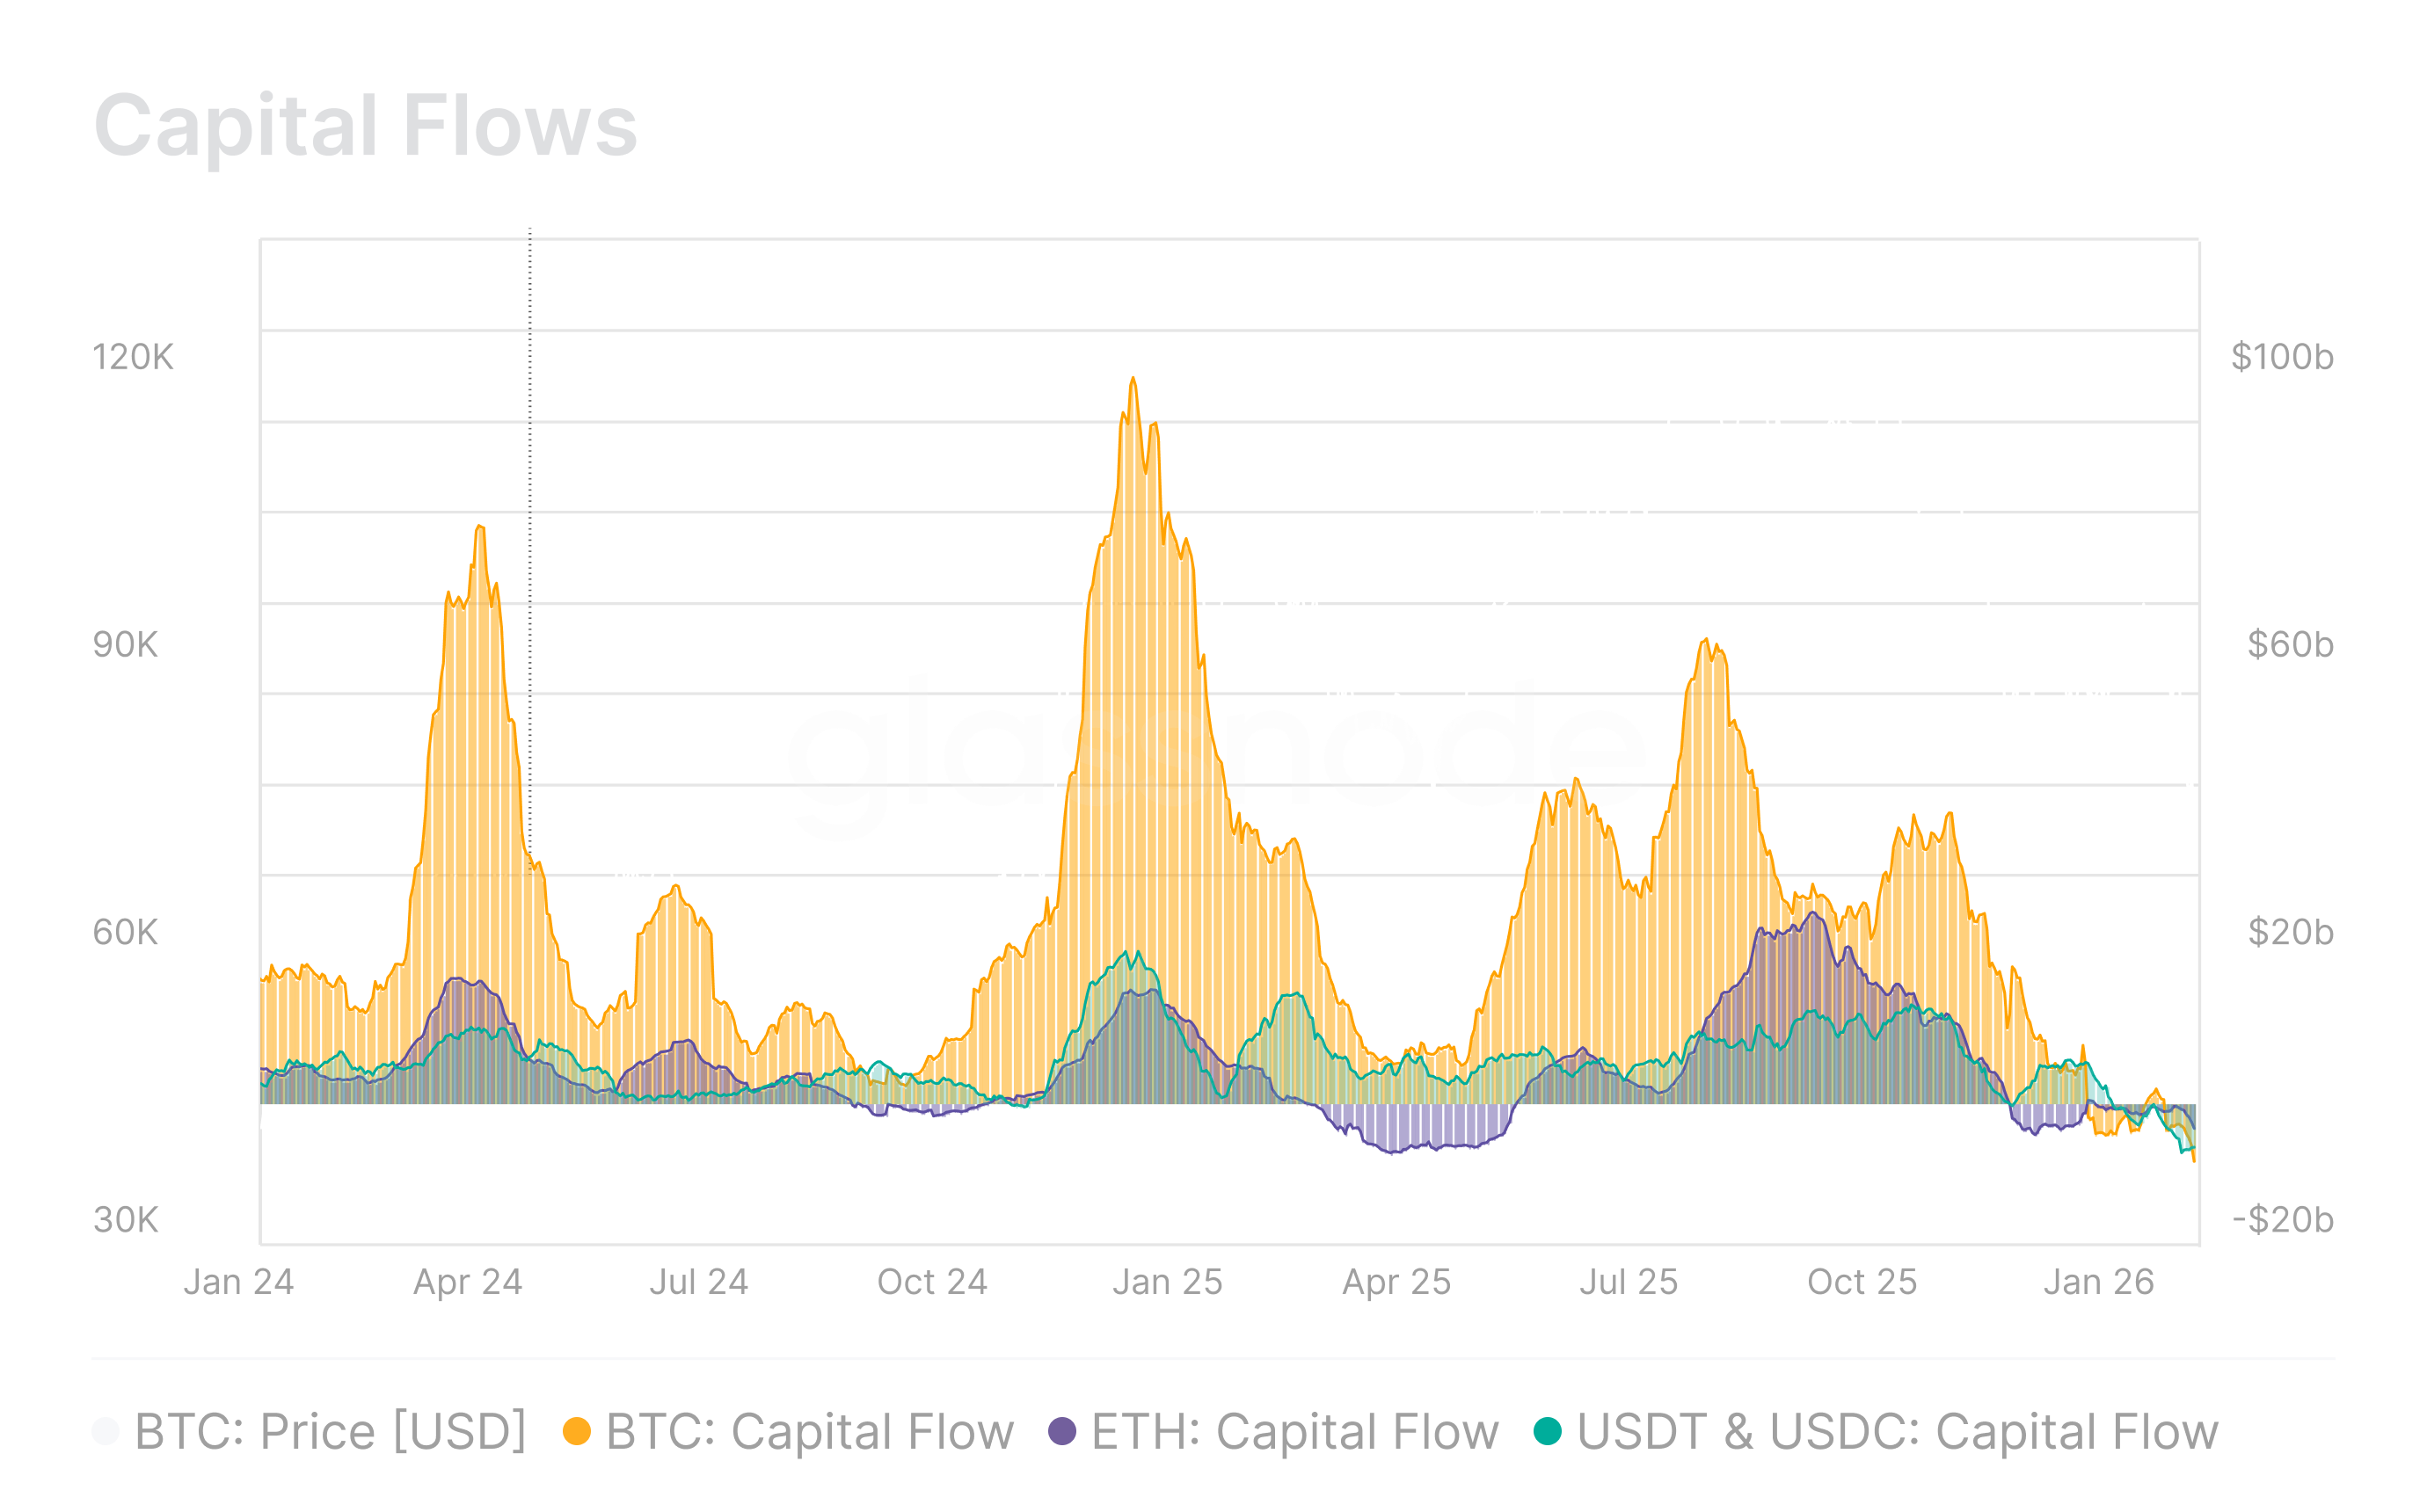
Capital flows into BTC and ETH remained deeply negative through February and into March, with stablecoins turning net positive in early March as investors rotated toward lower-risk positioning.

Bitcoin and Ethereum continued to experience sustained net outflows, with BTC and ETH capital flows registering -$9.6B and -$3.2B. However, stablecoins broke from the broader negative trend, flipping to +$6.2B in net inflows. Rather than signaling a broad return of risk appetite, this rotation likely reflects a defensive repositioning, with capital migrating into dollar-denominated on-chain instruments while conviction in spot crypto assets remains under pressure heading into mid-Q1 2026.
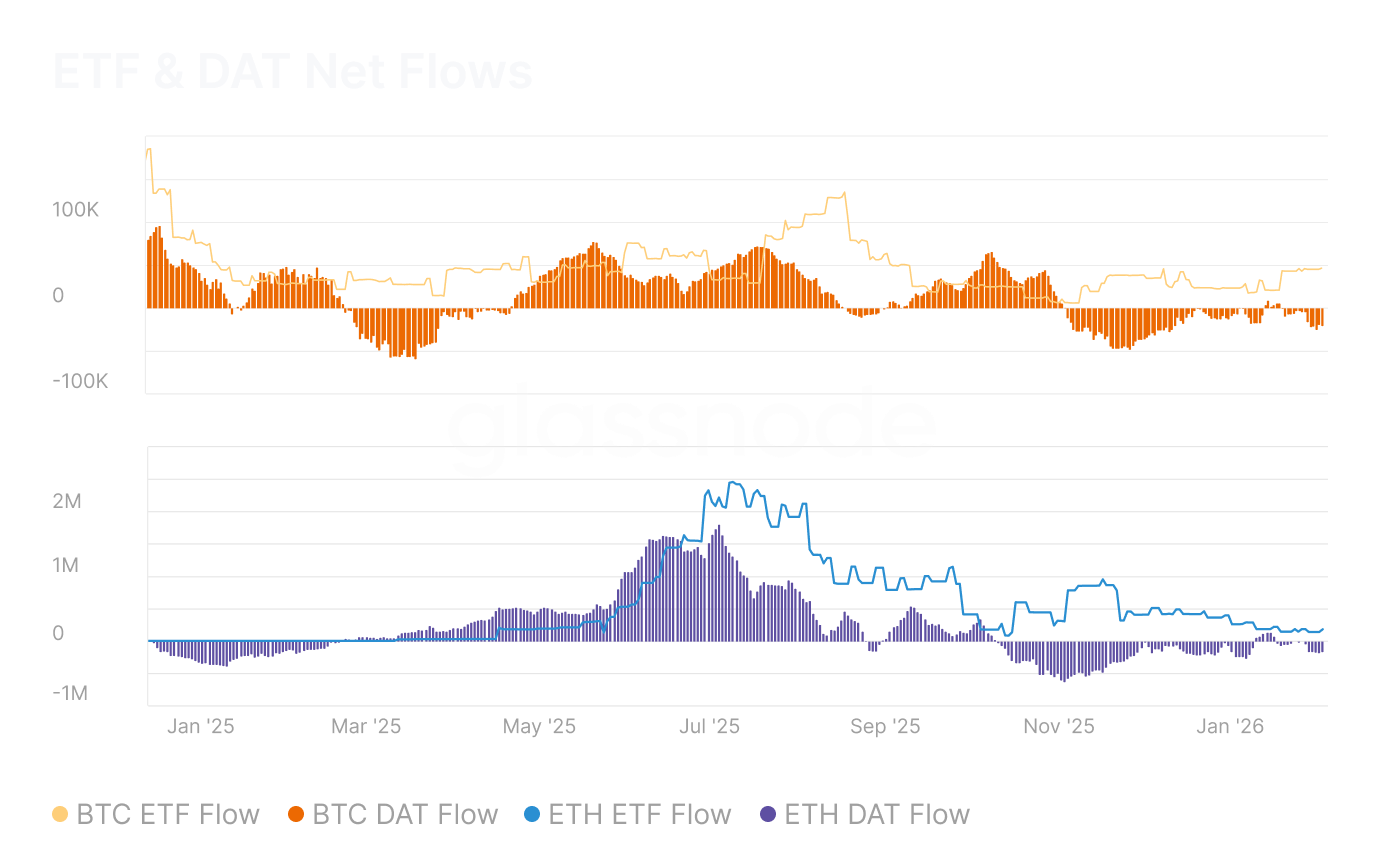
ETF & DAT Net Flows

After sustained February outflows, BTC ETF and DAT flows returned to positive, while ETH institutional flows showed early signs of stabilization.

After sustained February outflows, Bitcoin ETF and DAT flows returned to positive territory, recovering to +28k BTC and +46.8k BTC respectively. Ethereum flows were more measured, with ETF flows near neutral at +46.5k ETH and DAT flows stabilizing at +295.8k ETH. While the directional shift is encouraging, the recovery remains early-stage and uneven, and it would be premature to characterize this as a broad resumption of institutional conviction.
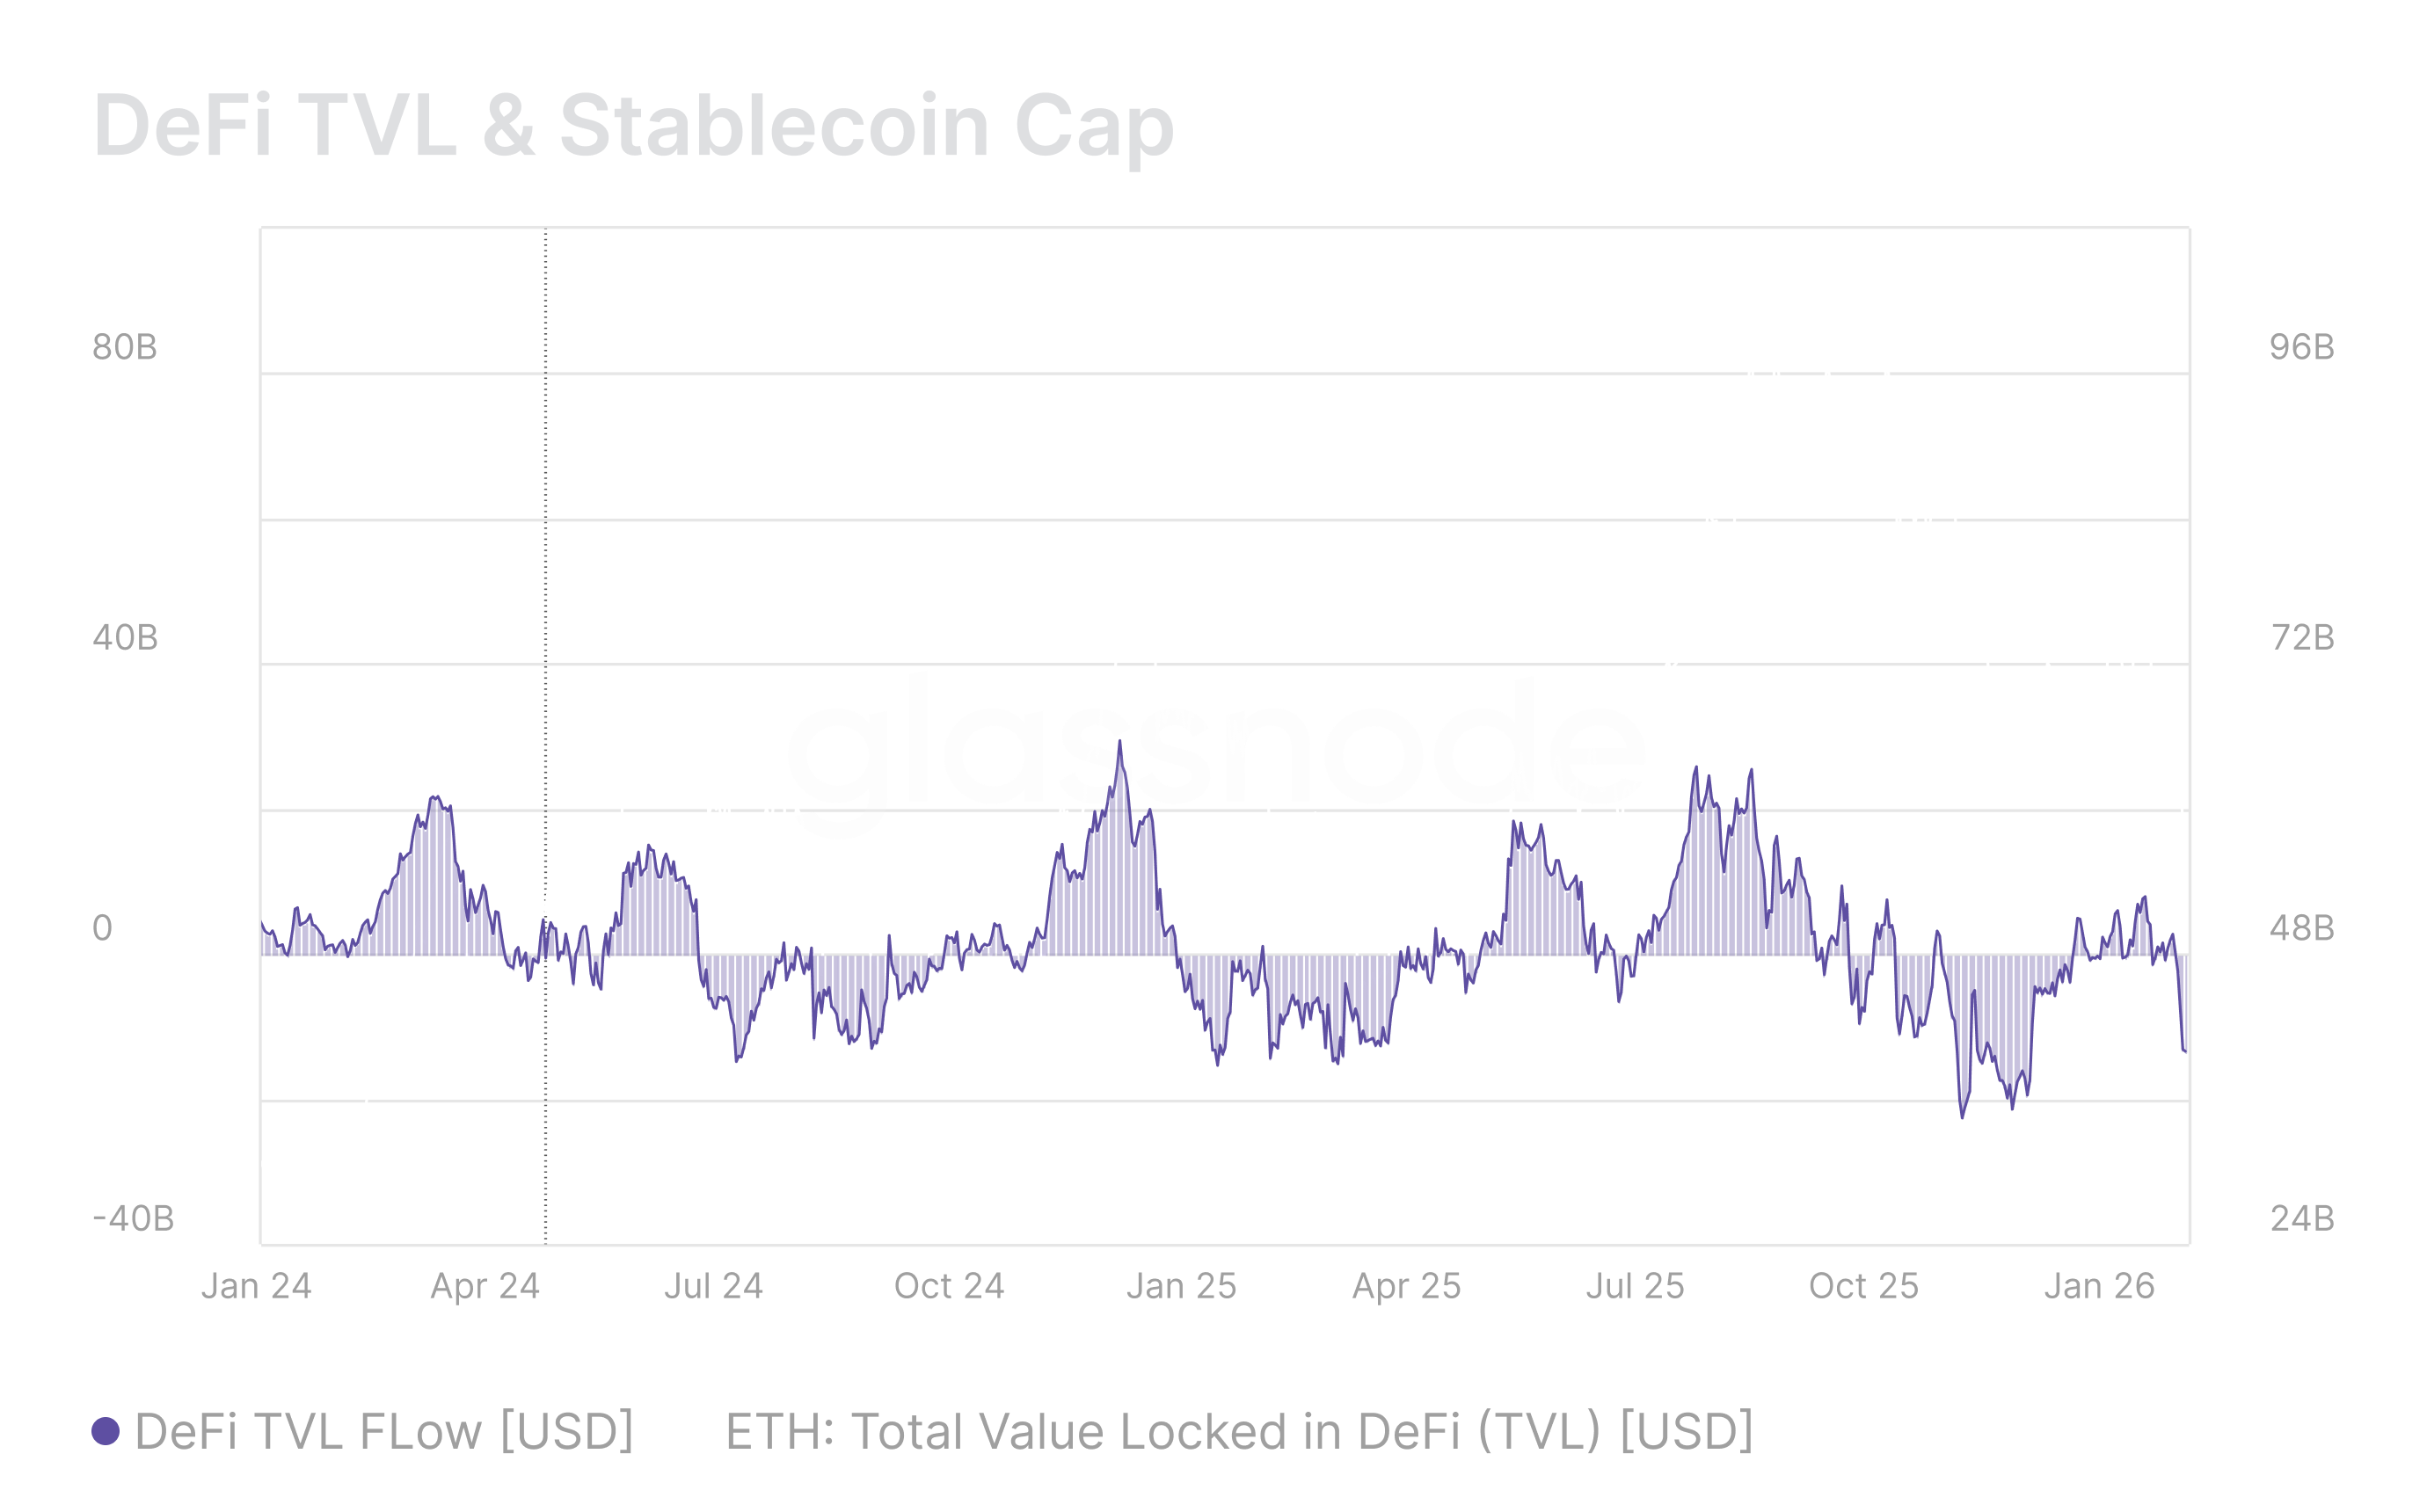
DeFi TVL & Stablecoin Cap

DeFi TVL on Ethereum saw sharp contraction through February before showing early signs of stabilization in March, though the broader declining trend since August 2025 remains intact.

Total Value Locked on Ethereum recorded peak outflows of -$23.7B per month in February, implying sustained withdrawal by larger allocators from on-chain activities such as liquidity provisioning and yield strategies. This slowdown alone is insufficient to signal a reversal, and diminished conviction in DeFi risk-adjusted returns continues to point to shallower liquidity depth across the ecosystem.
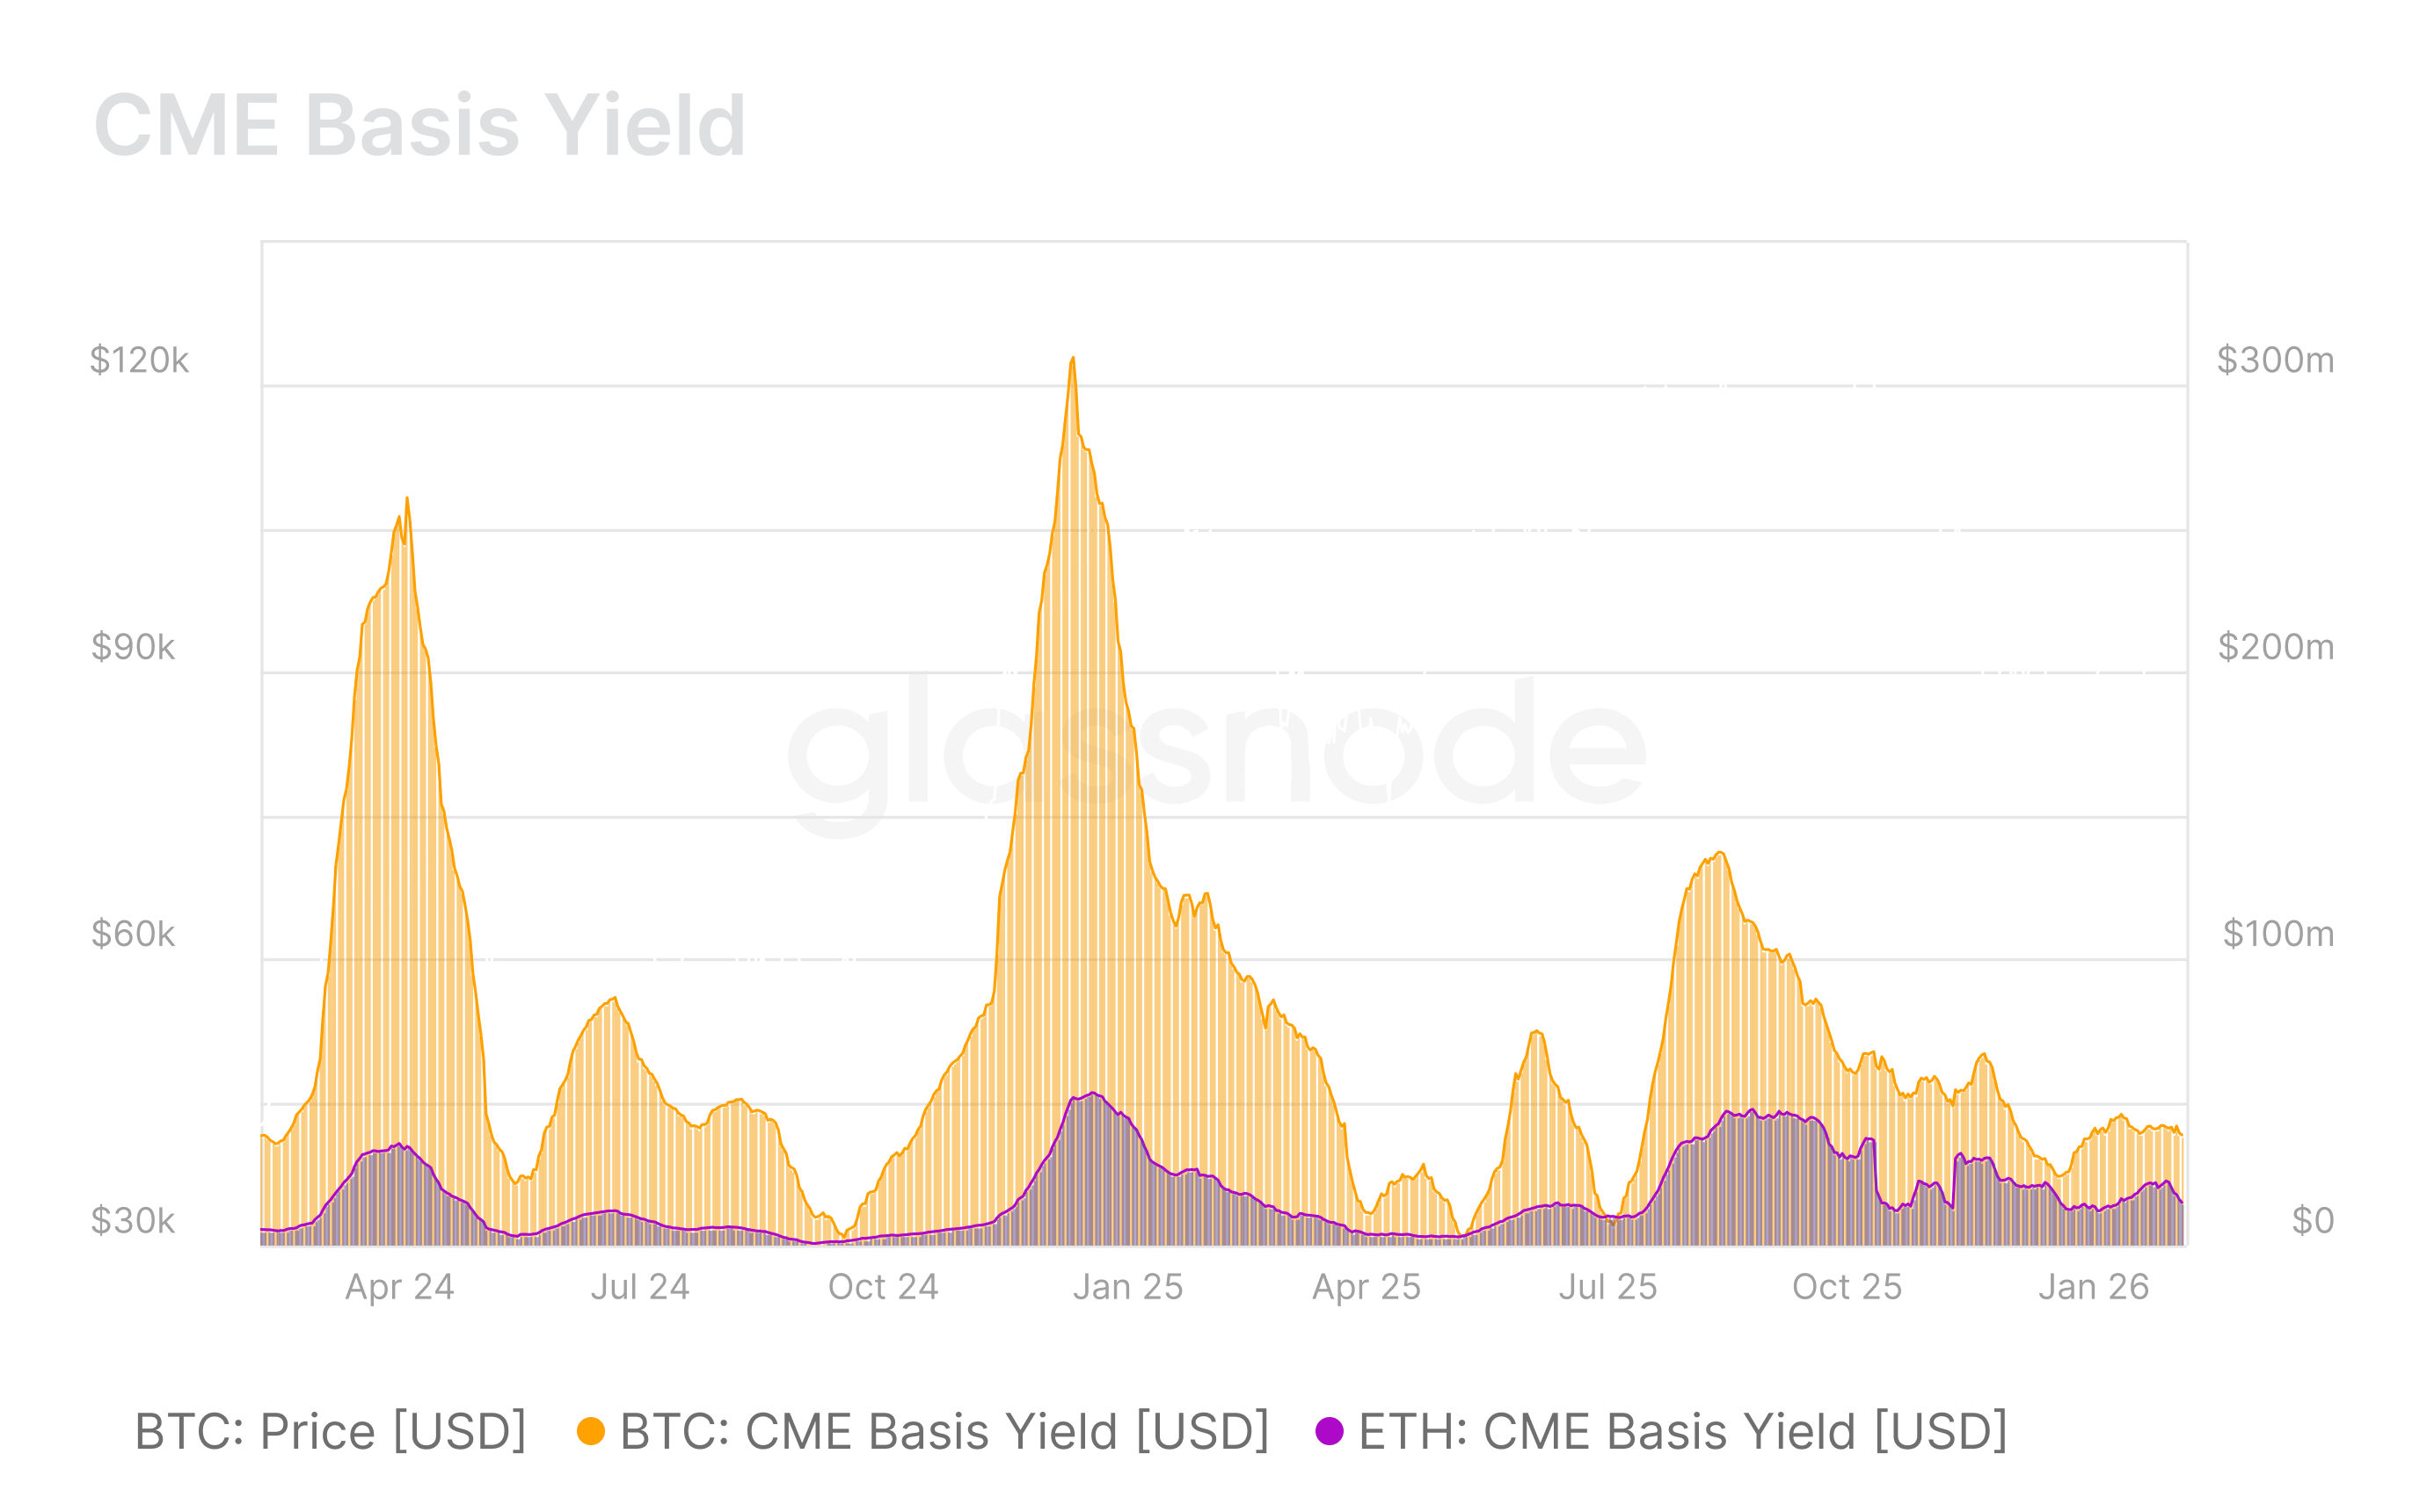
CME Basis Yield

CME Basis Yield compressed even further in February, reinforcing waning incentives for market-neutral strategies compared to January.

The monthly dollar value captured by institutions via cash-and-carry trades declined notably for both Bitcoin and Ethereum, building on the sharp compression seen since August 2025. This tightening basis reflects reduced leverage deployment, softer futures demand, and continued pullback in balance-sheet commitment amid tighter liquidity conditions persisting from January into early March 2026.


Disclaimer: This report does not provide any investment advice. All data is provided for information and educational purposes only. No investment decision shall be based on the information provided here and you are solely responsible for your own investment decisions.
Exchange balances presented are derived from Glassnode’s comprehensive database of address labels, which are amassed through both officially published exchange information and proprietary clustering algorithms. While we strive to ensure the utmost accuracy in representing exchange balances, it is important to note that these figures might not always encapsulate the entirety of an exchange’s reserves, particularly when exchanges refrain from disclosing their official addresses. We urge users to exercise caution and discretion when utilizing these metrics. Glassnode shall not be held responsible for any discrepancies or potential inaccuracies. Please read our Transparency Notice when using exchange data.

İlgili Sorular

QWhat is the primary purpose of the Strategy Watch publication?

AStrategy Watch was built to address a clear demand for high-signal, impartial analysis of fund-level performance and allocation trends in digital assets, aiming to be a must-read monthly publication for the digital asset investment community.

QWhich was the only strategy type that returned positively in February according to the report?

AThe report indicates that readers should check the 'Fund and SMA Performance' section to see the only strategy type that returned positively in February, though the specific strategy name is not stated in the provided text.

QWhat was the trend in capital flows for Bitcoin (BTC) and Ethereum (ETH) through February and into March?

ACapital flows into BTC and ETH remained deeply negative, with BTC and ETH capital flows registering -$9.6B and -$3.2B, respectively.

QHow did stablecoin capital flows behave in contrast to BTC and ETH in early March?

AStablecoins broke from the broader negative trend, flipping to +$6.2B in net inflows, which likely reflects a defensive repositioning into lower-risk, dollar-denominated on-chain instruments.

QWhat does the sharp compression in CME Basis Yield indicate about market conditions?

AThe compression in CME Basis Yield reflects reduced leverage deployment, softer futures demand, and a continued pullback in balance-sheet commitment amid tighter liquidity conditions, indicating waning incentives for market-neutral strategies.

İlgili Okumalar

Within Strategy's Framework, STRC's Dividend Yield Remains at 12% as Share Price Stays Below Par Value

Michael Saylor, Executive Chairman of Strategy (MSTR), confirmed that the dividend rate for its STRC perpetual preferred shares will remain at 12.00% through August 2026. The rate has increased from 9% at its July 2025 launch to the current high via a "ratchet" mechanism, which permanently raises the rate by 0.5% whenever the share price falls below $95. This mechanism is intended to push the price back toward its $100 par value and support Strategy's "at-the-market" (ATM) program for issuing new shares to fund Bitcoin purchases. However, the mechanism has not worked as intended. STRC shares closed at $89.46 on July 31, remaining about 10-11% below par value despite the record-high dividend. Competition from rival Strive's higher-yielding SATA securities has pressured demand. The persistent discount has forced Strategy to suspend new STRC issuances via its ATM program, limiting this funding channel for Bitcoin acquisitions. STRC's struggles reflect Bitcoin's own volatility, as the preferred shares historically move in tandem. Analysts have warned the ratchet structure carries long-term, one-way risk. A law firm is investigating Strategy's ability to maintain dividend payments if Bitcoin's price stays low. Retail investors own roughly 83% of outstanding STRC shares, a group seen as prone to panic selling during downturns. In response, Strategy has established financial reserves, including a liquidity cushion covering about 26 months of dividend/interest obligations, and a $2 billion share buyback program alongside a Bitcoin monetization framework, though the company emphasized it is not obligated to sell any Bitcoin.

cryptonews.ru10 dk önce

Within Strategy's Framework, STRC's Dividend Yield Remains at 12% as Share Price Stays Below Par Value

cryptonews.ru10 dk önce

Analyst: Bitcoin's Price Will Drop to $60k in August, Then Rebound to $70k

Financial analyst Andrey Poroshin has provided a new forecast for Bitcoin's price dynamics in August. Poroshin, an analyst at the Bitbanker exchange, expects the cryptocurrency market to experience a downturn this month, with prices retesting the $60,000 level due to a lack of supportive macroeconomic catalysts. He noted that the recent US Federal Reserve decision to hold interest rates did not significantly impact the market, while inflation remains above the 2% target. Poroshin stated that Bitcoin is ending July under pressure from moderate volatility and a lack of new macroeconomic stimuli, leading to continued market caution. According to his base scenario, Bitcoin will drop to a range of $60,000 to $62,000 before recovering to $70,000. He pointed out that even $70,000 remains below the cost of mining in the US, which has prompted some miners to shift towards AI data center operations. Poroshin cited the winding down of BitMEX's operations as a potential catalyst for a price rebound, suggesting the exit of weaker players often coincides with market reversals and reduced short-term selling pressure. He believes Bitcoin is currently less susceptible to geopolitical shocks, such as the Iran-US conflict, and does not expect significant market changes in August related to the pending CLARITY Act. Looking ahead, Poroshin forecasts that September will bring more active price fluctuations driven by potential Fed rate decisions and possible discussions or approval of the CLARITY Act.

cryptonews.ru10 dk önce

Analyst: Bitcoin's Price Will Drop to $60k in August, Then Rebound to $70k

cryptonews.ru10 dk önce

İşlemler

Spot
活动图片





