Stablecoin Market Sees Significant Contraction for First Time in Four Years

cryptonews.ru2026-07-28 tarihinde yayınlandı2026-07-28 tarihinde güncellendi

Özet

For the first time in four years, the stablecoin market's total capitalization has contracted significantly, dropping by over $10 billion from its May peak to around $310 billion in late July. This represents the largest monthly outflow since the collapse of Terra in May 2022. Paradoxically, while the supply shrank, adjusted transaction volume in June 2026 surged to a record $1.79 trillion, a 63% monthly increase. A key driver of this divergence is the **$GENIUS Act**, passed in July 2025, which prohibited stablecoin issuers from paying interest on payment-focused stablecoins. This did not eliminate the demand for yield but redirected capital towards alternatives like tokenized U.S. Treasury funds, DeFi lending protocols, and offshore stablecoin issuers. The shift is evidenced by the rapid growth of the Real-World Asset (RWA) sector, where tokenized Treasury funds grew from $11 billion to $16 billion in five months. The changing dynamics have reshaped the competitive landscape. **$USDC** has become the dominant instrument for institutional transactions, accounting for approximately 70% of transaction volume in the first half of 2026 and $1.21 trillion in adjusted transfer volume for June. Meanwhile, **$USDT** retains its lead in overall market capitalization, serving as a "savings account" in developing economies. The industry's fundamental economics are transforming: the old issuer model reliant on yield from reserves is diminishing; revenue is shifting towards infrastruc...

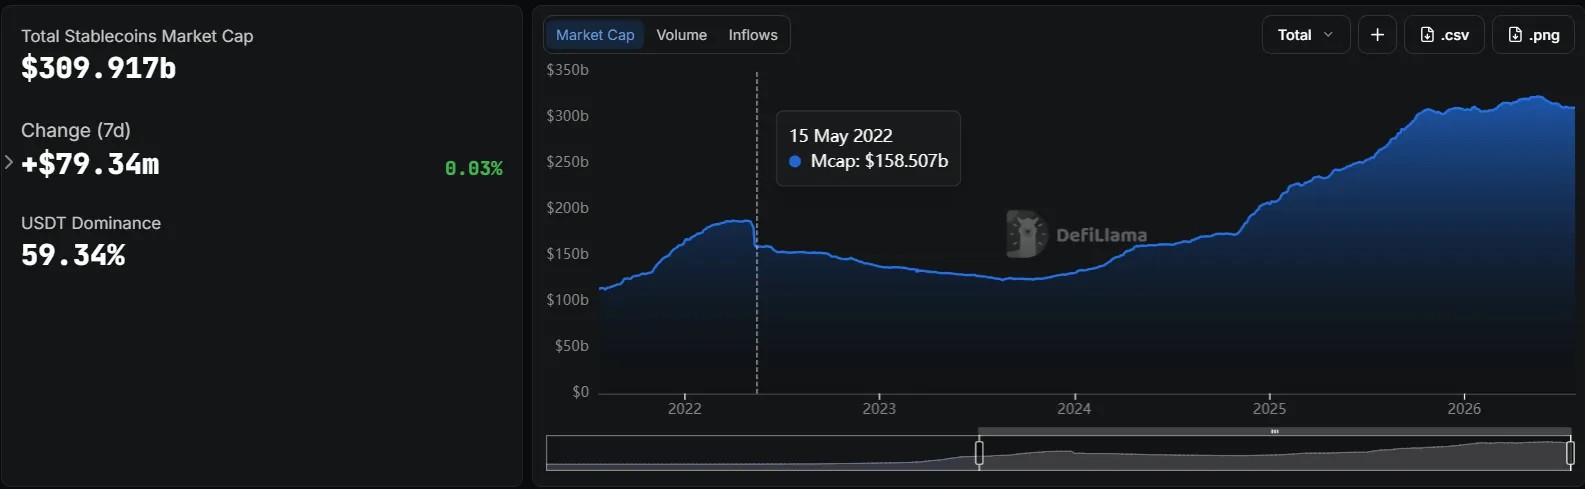
On July 28, according to data from DeFiLlama, the total market capitalization of stablecoins fell by more than $10 billion from its May peak, reaching approximately $310 billion. This outflow marked the largest monthly decline since the Terra collapse in May 2022.

Against this backdrop, the adjusted transaction volume for June 2026 hit a historical high, reaching $1.79 trillion, an increase of about 63% over the month.
Source: DeFiLlama.

Where Are Capital and Yields Going?

A key factor in the divergence between falling market cap and growing volumes is the $GENIUS Act, passed in July 2025. It prohibits issuers from paying interest on payment stablecoins.

Professor of Finance David Krause from Marquette University explained this dynamic:

"The complication is that the ban didn't destroy the underlying demand for yield—it merely shifted it. Investors who want a digital dollar with a yield close to the U.S. Treasury bill rate simply found other products with the legal right to offer it."

According to him, tokenized treasury funds, DeFi lending protocols, and offshore stablecoin issuers are ready to absorb the demand. Treasuries place idle dollars in a tokenized fund paying 4% and hold stablecoins only for the time needed to execute the actual payment. Capital is leaving the asset, while operational balances remain and turn over faster, reflected in the declining supply against record-high volumes.

"The rule [$GENIUS Act], intended to protect banks and preserve monetary control, has instead pushed capital into instruments that regulators understand less and control less strictly."

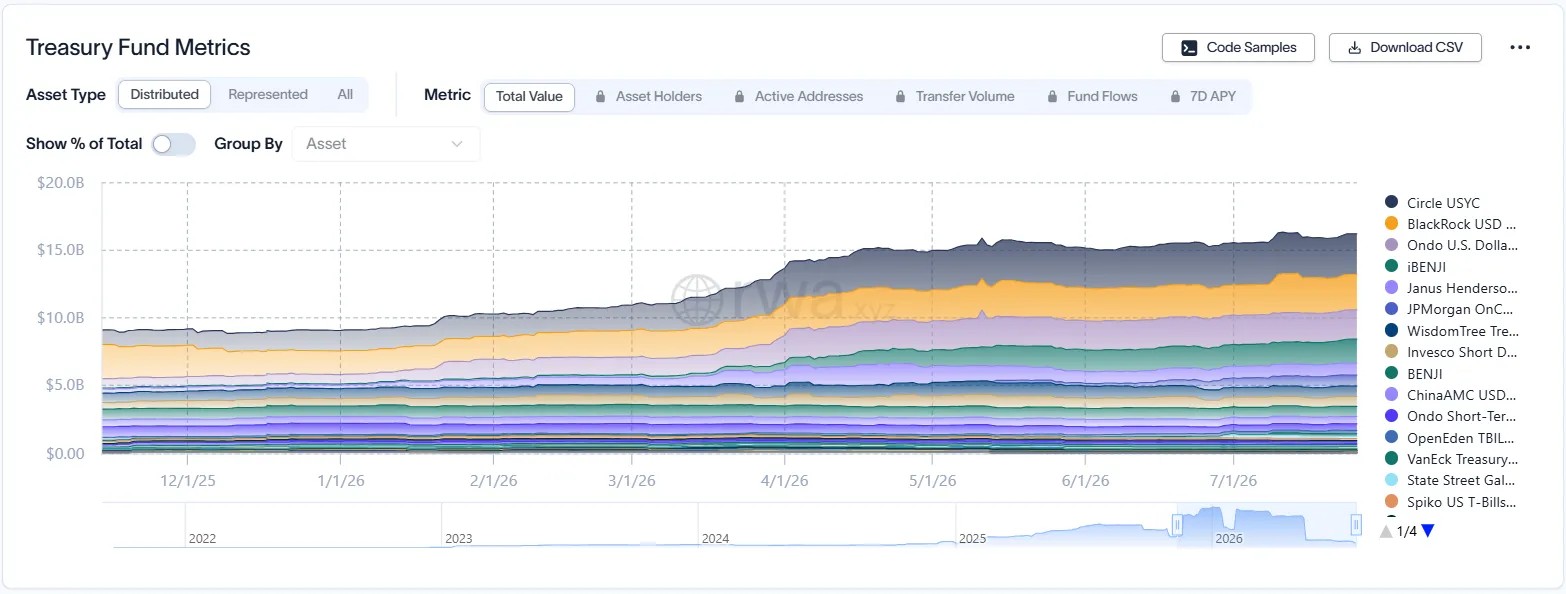
Thus, large players have moved funds into the RWA sector—tokenized U.S. Treasury bond funds, whose total volume grew from $11 billion to $16 billion over five months. This, according to data from aggregator RWA.xyz, is reflected in the leadership shift within the segment: Circle's USYC fund surpassed BlackRock's BUIDL, and a similar product from JPMorgan grew by 87% in just one month.
Source: RWA.xyz.
How Euro-Stablecoins Lost the Battle Before It Began

$USDC Seizes Initiative and Changes the Industry's Business Model

The growth in transactional activity has reshuffled the balance of power. According to Visa, the velocity of stablecoin circulation in Q4 2025 reached 13.56, outpacing the dollar M1 aggregate's rate of 1.65 by almost eight times.

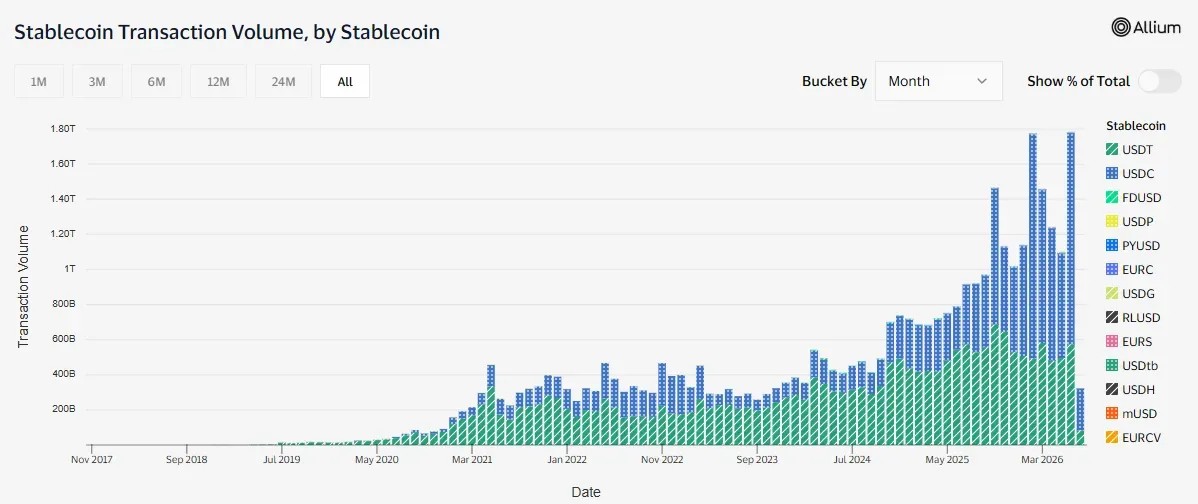
In this race, $USDC has become the primary tool for institutions. According to data from Visa's Allium-based analytics dashboard, $USDC accounted for about 70% of transactions in the first half of 2026.

For June, the adjusted transfer volume in $USDC amounted to $1.21 trillion (approximately 67.6%), while USDT's figure was at $576 billion (about 32%). Despite trailing in volume, Tether maintains absolute leadership in market capitalization, retaining its status as a "savings account" in developing countries.
Share of transaction volume by various stablecoins. Source: Visa.

The growth in velocity amidst stagnant supply is changing the fundamental economics of the crypto sector:

  • A blow to the old issuer model. Relying solely on interest from reserve assets, which was the core business model in 2021, is ceasing to be the primary financial driver.
  • The triumph of infrastructure. The main revenue stream is shifting to payment networks, processing services, and blockchains that charge transaction fees. Traditional giants like Visa no longer assess the market by asset capitalization, focusing solely on clearing volumes.
  • Dominance of the corporate sector. According to a joint study by McKinsey and Artemis, only about 1% of the movement in 2025 came from identifiable real-world payments—roughly $390 billion, of which $226 billion was in the B2B sector. The share is small, but it is thirty times larger than two years ago.

In June, experts explained the ban on CBDC issuance for the U.S. Federal Reserve.

Fiat Against Crypto: Why Corporations Need Their Own Stablecoins
end-content

İlgili Sorular

QWhy did the stablecoin market experience its largest monthly outflow since the Terra collapse in 2022?

AThe primary driver was the implementation of the GENIUS Act in July 2025, which banned stablecoin issuers from paying interest on payment-focused stablecoins, causing investors to seek yield in other products like tokenized treasury funds and offshore stablecoins.

QAccording to the article, what explains the divergence between falling stablecoin market capitalization and rising transaction volumes?

AThe divergence is due to investors moving their capital for yield purposes into instruments like tokenized treasury bond funds, while keeping stablecoins only for actual payment execution. This leads to a higher velocity of stablecoins (faster turnover) for payments despite a lower total supply held as investment.

QWhich stablecoin became the dominant tool for institutional transactions in the first half of 2026 according to Visa data?

AUSDC became the dominant tool for institutional transactions, accounting for approximately 70% of stablecoin transaction volume in the first half of 2026.

QWhat are the three major shifts in the crypto sector's basic economics highlighted as a result of increased transaction velocity and stagnant supply?

A1. A blow to the old issuer model reliant on interest from reserve assets. 2. The triumph of infrastructure, shifting the main revenue stream to payment networks and blockchains charging transaction fees. 3. The dominance of the corporate (B2B) sector, which now represents the vast majority of identifiable real-world payments.

QWhat was a key consequence of the GENIUS Act, according to Professor David Krause's commentary in the article?

AProfessor Krause stated that instead of protecting banks and preserving monetary control, the GENIUS Act pushed capital into instruments that regulators understand less and control less strictly, such as tokenized bond funds and offshore stablecoins.

İlgili Okumalar

Observation of Data on the Top Six Cryptocurrency Protocols: Revenue Continues to Grow, So Why Aren't Token Prices Rising?

Despite generating impressive revenue, many top cryptocurrency protocols struggle to translate this success into token price appreciation. This analysis of six major protocols (Aave, Aerodrome, Hyperliquid, Pump, Sky, Uniswap) examines the disconnect, focusing on revenue generation, distribution, and tokenomics. While these protocols collectively earned over $726 million in the first half of 2026, token performance largely lagged due to factors like imbalanced token emissions, unclear value capture mechanisms, and equity-token separations that disadvantage holders. Key findings reveal that not all revenue is equal for token holders. Protocols differ significantly in how they allocate income. Hyperliquid, for instance, directs 100% of its revenue to holders via buybacks and burns, correlating with strong token performance. Others, like Aerodrome, Sky, and Uniswap, showed negative net token flows when accounting for high token emissions used for incentives, offsetting holder benefits. The article highlights two primary value capture methods: buybacks/burns and direct fee distribution (e.g., ve-tokenomics models). The analysis concludes that high revenue alone doesn't guarantee token growth. Investors must scrutinize a protocol's sustainable revenue sources, how that value is shared with token holders, and the associated token release schedules and supply pressures. The future points towards greater alignment between protocol success and tokenholder rewards, but only for projects that seriously address all three pillars: revenue, distribution, and emissions.

marsbit32 dk önce

Observation of Data on the Top Six Cryptocurrency Protocols: Revenue Continues to Grow, So Why Aren't Token Prices Rising?

marsbit32 dk önce

September 1st, A Major Chip Price Hike

On July 29, 2026 (US time), Qualcomm reported its Q3 FY2026 (Q2 CY) results. Revenue reached $9.95 billion, up 4% and beating estimates, but net profit fell 25% YoY to $2 billion. The "revenue up, profit down" trend is attributed to rising costs across semiconductor manufacturing, testing, packaging, and materials. In response, CEO Cristiano Amon announced price increases for all chip products, effective September 1, to pass on costs and restore historical profit margins. The stock fell over 5% in after-hours trading due to weaker-than-expected Q4 profit guidance. Qualcomm's core chip business (QCT) revenue was $8.5 billion, down 5% YoY. Handset revenue dropped 20% to $5.09 billion, reflecting a weak global smartphone market with declining shipments. In contrast, Automotive revenue surged 61% to $1.59 billion, marking 23 consecutive quarters of double-digit growth, and IoT revenue grew 9% to $1.83 billion. The licensing division (QTL) revenue was $1.28 billion, down 3%. Facing smartphone headwinds and a reduced component share in future iPhones, Qualcomm is aggressively diversifying. It is betting heavily on the data center AI market, maintaining a target of $5 billion in data center revenue for FY2027. The company completed the acquisition of AI software firm Modular to build an open software platform for generative AI. For Q4 FY2026, Qualcomm forecasts revenue between $9.7B and $10.5B, roughly in line with expectations. However, non-GAAP EPS guidance of $2.05-$2.25 fell short of the $2.36 analyst consensus. Management expects the chip price increases to gradually improve margins after September 1, but near-term profitability pressure from costs and the weak handset market persists.

marsbit33 dk önce

September 1st, A Major Chip Price Hike

marsbit33 dk önce

İşlemler

Spot
活动图片