Stable tests $0.025 support – Can it reach $0.039 next?

ambcrypto2026-03-25 tarihinde yayınlandı2026-03-25 tarihinde güncellendi

Özet

Stable token gained 10% in 24 hours, testing a key support level at $0.025. While trading above the 20-day EMA suggests short-term bullish momentum, it remains below the 50-day EMA, indicating resistance. A break above the 50-day EMA could confirm a trend continuation toward the next target of $0.039. Momentum indicators like the Stochastic RSI show a potential reversal from oversold conditions. Funding rates suggest undervaluation, leaving room for upside. On-chain data shows a steady increase in holders to 6.2k and a flattening circulating supply, supporting long-term stability. The key level to watch remains $0.025 for sustained bullish momentum.

Momentum returned to the market over the last 24 hours, with Stable among the notable movers.

The token recorded a 10% daily gain. At press time, it tested a key demand zone near $0.025. That level stood as a key decision point for traders and investors.

The daily chart reflected a tug-of-war between buyers and sellers.

Stable traded above the 20-day EMA, indicating short-term bullish strength. However, it remained below the 50-day EMA.

This positioning suggested overhead resistance was still capped upside.

A sustained move above the 50-day EMA could confirm trend continuation. Even so, failure to break higher may extend consolidation.

Source: TradingView

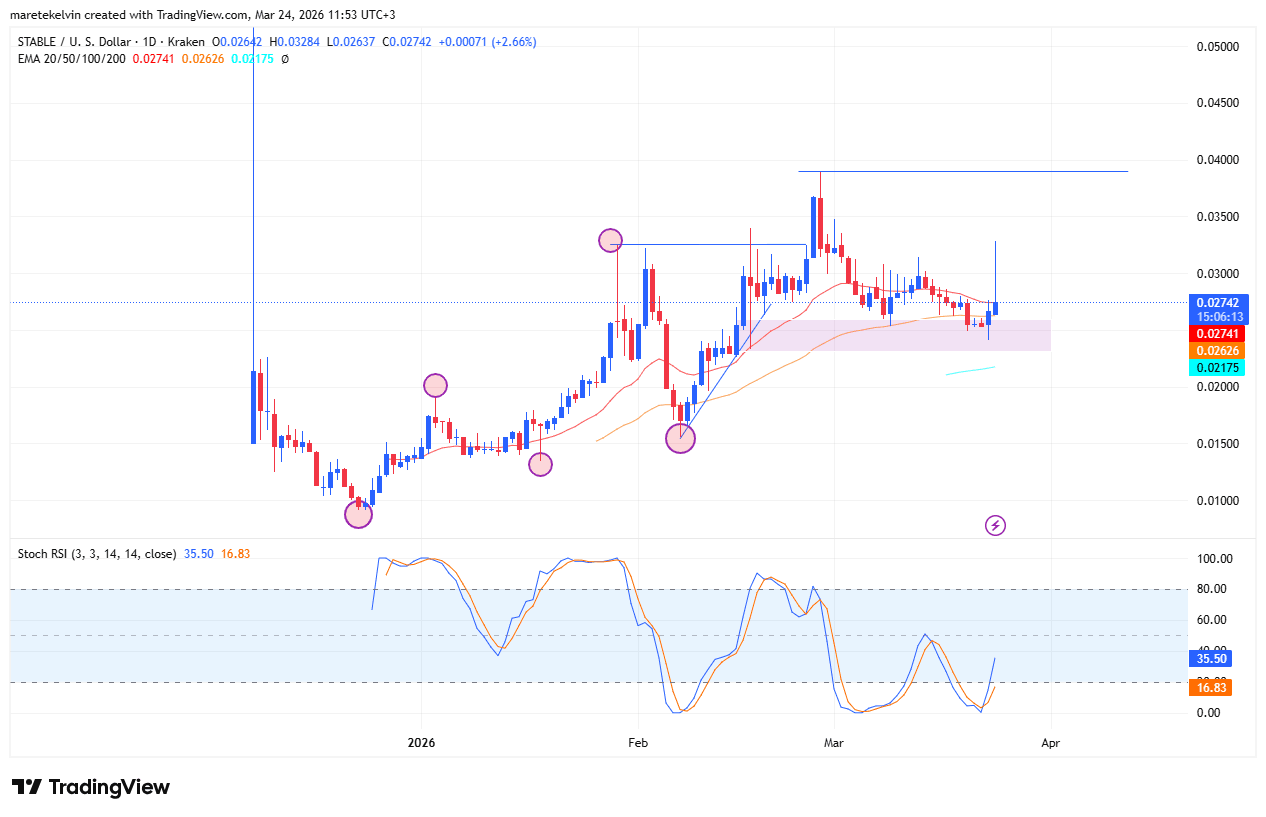
Momentum hints at a reversal

Momentum indicators began shifting.

The Stochastic RSI bounced from the oversold region, signaling a possible reversal. That move aligned with the price reacting at the demand zone.

In fact, the broader structure shifted three weeks ago.

Since then, the price has formed a more constructive base, with bulls gaining control. Such setups often preceded momentum expansion.

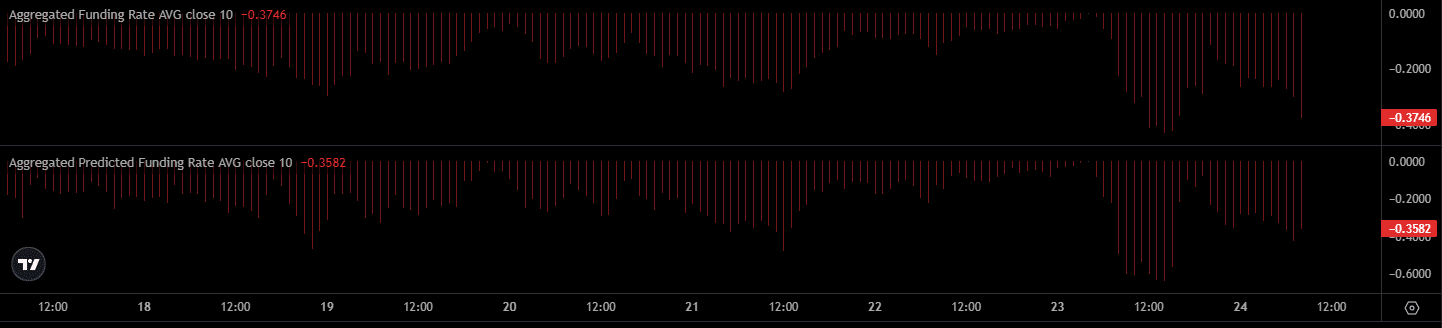
Funding Rates suggests undervaluation

Derivatives data added weight to the bullish case.

Stable Funding Rates remained below expected levels, suggesting undervaluation relative to positioning.

When Funding Rates lag rising prices, sentiment typically remained cautious. That gap often left room for further upside if confidence improved.

Source: Coinalyze

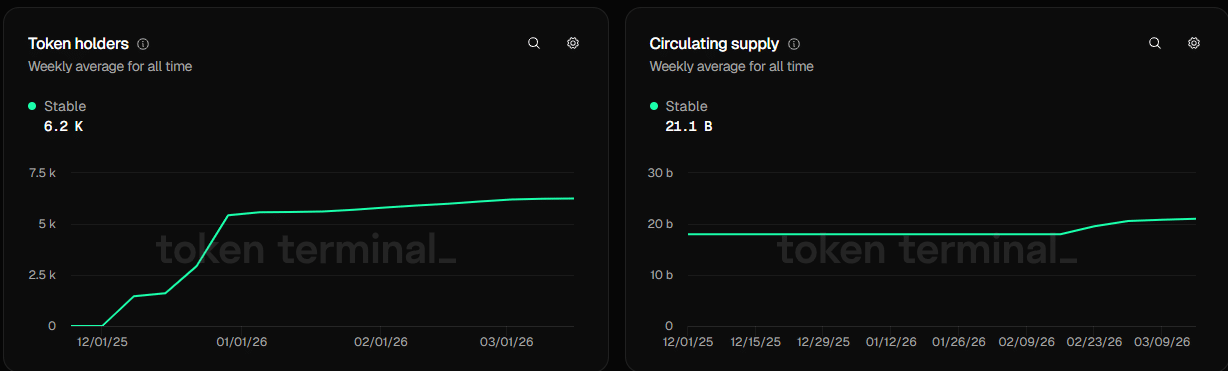
On-chain data remains steady.

The number of Stable token holders has been gradually increasing over time. This trend highlights consistent accumulation.

From past observations, rising holder count often reflected a growing network confidence. The surge also supports long-term price stability as more investors are playing the long game.

The holder’s behaviour goes hand in hand with the stale supply. Stable circulating supply has also flattened, presenting a net demand surge given the recent holders surge.

At press time, the networks had 6.2k holders and the circulating supply amounted to 21.1 billion.

Source: Token Terminal

$0.039 emerges as the next key target

Attention now shifted to the next resistance.

If momentum held, the next key level stood near $0.039, marking a liquidity zone.

A break above this level could signal further upside. However, failure to hold gains may delay the move and extend consolidation.

As it stood, $0.025 remained the key support to watch.


Final Summary

  • Stable gained 10% and tested a key demand zone near $0.025. Price held above the 20-day EMA but faced resistance below the 50-day EMA.
  • Holder count rose to 6.2k while supply flattened, signaling steady accumulation.

İlgili Sorular

QWhat is the current key support level for Stable token mentioned in the article?

AThe current key support level for Stable token is $0.025.

QWhat does the Stochastic RSI bouncing from the oversold region signal for the Stable token?

AIt signals a possible price reversal.

QWhat does the article suggest about Stable's Funding Rates and its implication?

AThe Funding Rates remained below expected levels, suggesting the token is undervalued and may have room for further upside if confidence improves.

QWhat on-chain metric is provided as evidence of growing network confidence and long-term stability?

AThe gradual increase in the number of token holders, which reached 6.2k, along with a flattening circulating supply.

QWhat is the next key resistance target for Stable token if the current momentum holds?

AThe next key resistance target is $0.039.

İlgili Okumalar

How Risky is the "Death Spiral" of MSTR and STRC?

Summary: This article explores the perceived "death spiral" risk between MicroStrategy (MSTR), its Bitcoin holdings, and its perpetual preferred stock (STRC), drawing comparisons to the LUNA-UST collapse. While both systems feature price anchors, high yields for holders, and potential feedback loops, their core mechanisms differ fundamentally. The MSTR-STRC structure relies on continuous financing to sustain its high dividend payouts, primarily through stock ATM offerings. A negative feedback cycle could occur: falling MSTR stock price makes raising equity capital harder, increasing pressure to sell Bitcoin, which undermines STRC confidence and further depresses MSTR. However, unlike LUNA-UST's automated, direct linkage, the MSTR-STRC loop is weaker and has brakes: STRC dividends can be deferred or rates lowered, and STRC holders have a $100/share liquidation preference in bankruptcy, providing a price floor. The company's sustainability hinges on its ability to continue financing. Its current ~$900 million USD reserves cover only about 6.3 months of its ~$1.71 billion annual interest/dividend burden. The next six months are critical, aligning with both the potential bottom in Bitcoin's four-year cycle and the depletion timeline of its reserves. While a LUNA-style catastrophic collapse is deemed highly unlikely due to structural differences, the key question is whether MicroStrategy can navigate this period through healthy deleveraging to restart its capital engine.

Foresight News12 dk önce

How Risky is the "Death Spiral" of MSTR and STRC?

Foresight News12 dk önce

How Much Debt Does Strategy Really Have? Is There a Risk of Implosion?

MicroStrategy's Debt Risk: A Turning Point in the "Never Sell" Strategy As of June 3, 2026, MicroStrategy holds 843,706 bitcoins (valued at ~$53.1B) but faces significant financial obligations. Its capital structure includes $6.75B in convertible notes and $15.48B in perpetual preferred stock (led by the $8.5B STRC series), creating an annual payout burden of ~$1.71B. With software revenue at only ~$500M, interest and dividend obligations far exceed operating income. A critical shift occurred in late May 2026 when the company sold 32 bitcoins for ~$2.5M to cover dividends, breaking CEO Michael Saylor's long-standing "never sell" pledge. This symbolic move triggered a sharp decline in both Bitcoin's price and MSTR stock, reflecting market fears about cash flow sustainability. The core of the strain is the STRC perpetual preferred stock, designed as a "permanent loan" with no maturity date but requiring high monthly dividends (currently 11.5%). Its business model relies on a three-part cycle: issuing new STRC shares, using proceeds to buy more Bitcoin and fund a USD reserve, and using that reserve to pay dividends. This cycle depends on continuous investor demand for STRC and Bitcoin's price appreciation. Analysis shows Bitcoin needs to appreciate at least 2.3% annually to cover the $1.71B in yearly obligations at current holdings. With Bitcoin price down ~22% from March 2026 highs, this pressure has intensified. The company's $900M USD reserve can only cover about 7 months of payments if STRC issuance stalls. Key risks are not immediate bankruptcy or forced Bitcoin liquidation (as BTC is not collateral), but rather: 1) The erosion of MSTR's premium to its Bitcoin holdings (mNAV), which would cripple its ability to raise cheap capital; 2) A vicious cycle where stagnant Bitcoin prices reduce STRC demand, draining the USD reserve and forcing BTC sales, further depressing prices. The period from February 2027 to September 2028 is a crucial test, with over $5.9B in convertible notes facing put options or maturity. In essence, MicroStrategy has evolved from a simple Bitcoin holder into a complex financial entity acting like a "private Bitcoin bank," leveraging its BTC holdings to create layered financial products. Its survival depends on maintaining Bitcoin's price trend, its stock premium, and market appetite for its preferred shares. The recent token sale marks not a betrayal of its Bitcoin thesis, but an admission that the leveraged strategy must eventually be paid for.

marsbit23 dk önce

How Much Debt Does Strategy Really Have? Is There a Risk of Implosion?

marsbit23 dk önce

Anthropic Cries Wolf: Is the AGI Threat Real, or Just an IPO Story?

Anthropic has published an article titled "When AI builds itself," discussing the emerging concept of "recursive self-improvement," where AI begins to actively participate in designing, training, testing, and optimizing its own subsequent versions. The company presents internal data showing that by May 2026, over 80% of code merged into its codebase was written by Claude, its AI model. Claude's capabilities have expanded to handling complex, open-ended engineering tasks, achieving a 76% success rate in such areas, and even contributing to research processes, such as optimizing code performance and conducting AI safety experiments. Anthropic outlines an evolution from human-driven development to AI-assisted workflows, culminating in the current stage where AI agents can autonomously write, run, and delegate code. The company cautions that the path toward a "closed loop," where AI continuously improves itself, is becoming visible. It calls for coordinated global mechanisms to potentially slow or pause frontier AI development to allow safety research and societal structures to catch up. However, the timing of this warning coincides with Anthropic's preparations for an IPO, framing the narrative not just as a safety concern but also as a demonstration of Claude's advanced capabilities and its integral role in accelerating Anthropic's own R&D—creating a potential "flywheel" effect for competitive advantage. This contrasts with OpenAI's recent, more policy-oriented discussion of the same risks, highlighting the competitive dynamics in the AI industry as companies position themselves in both the technological and regulatory landscape.

marsbit1 saat önce

Anthropic Cries Wolf: Is the AGI Threat Real, or Just an IPO Story?

marsbit1 saat önce

İşlemler

Spot
Futures
活动图片