Semiconductor Mid-Game Check-in: How Much Left in the Tail-End Rally?

marsbit2026-08-20 tarihinde yayınlandı2026-08-20 tarihinde güncellendi

Özet

Semiconductor Mid-Game Review: How Much is Left in the Rally? This analysis compares the current semiconductor market trend to NVIDIA's trajectory in 2024, drawing lessons on identifying market tops and bottoms. In July-August 2024, NVIDIA's stock fell 33%, triggered by a combination of "fundamental rumors" (Blackwell delays, antitrust probes) and "macro-driven asset selling" (BOJ rate hike leading to carry-trade unwinding). The low was marked by extreme panic selling across global markets. Key characteristics of a TOP include: Technical patterns like double tops or failure to break highs; Overcrowded and leveraged positioning (e.g., excessive retail and ETF inflows into a single stock like NVDA); High fragility where even a minor fundamental disappointment (e.g., a slight margin dip in stellar earnings) triggers a sharp correction. The practical action is to reduce exposure upon seeing technical warning signs combined with crowded trades. Key characteristics of a BOTTOM include: Technical reversal signals like a high-volume bullish engulfing pattern after a steep drop; Panic indicators hitting extremes (e.g., record VIX, major index crashes) signaling selling exhaustion; The downturn being driven by macro or systemic shocks unrelated to the company's core business fundamentals, creating a mispricing that quality companies eventually recover from. The conclusion is that while the current semiconductor rally may be in its later stages ("fish tail"), understanding these pa...

Author: XinGPT

The current semiconductor market trend somewhat resembles the script from Nvidia in 2024. Let's review what happened then:

From July 11 to August 5, 2024, Nvidia fell from around $134 to $90.94, a drop of 33%.
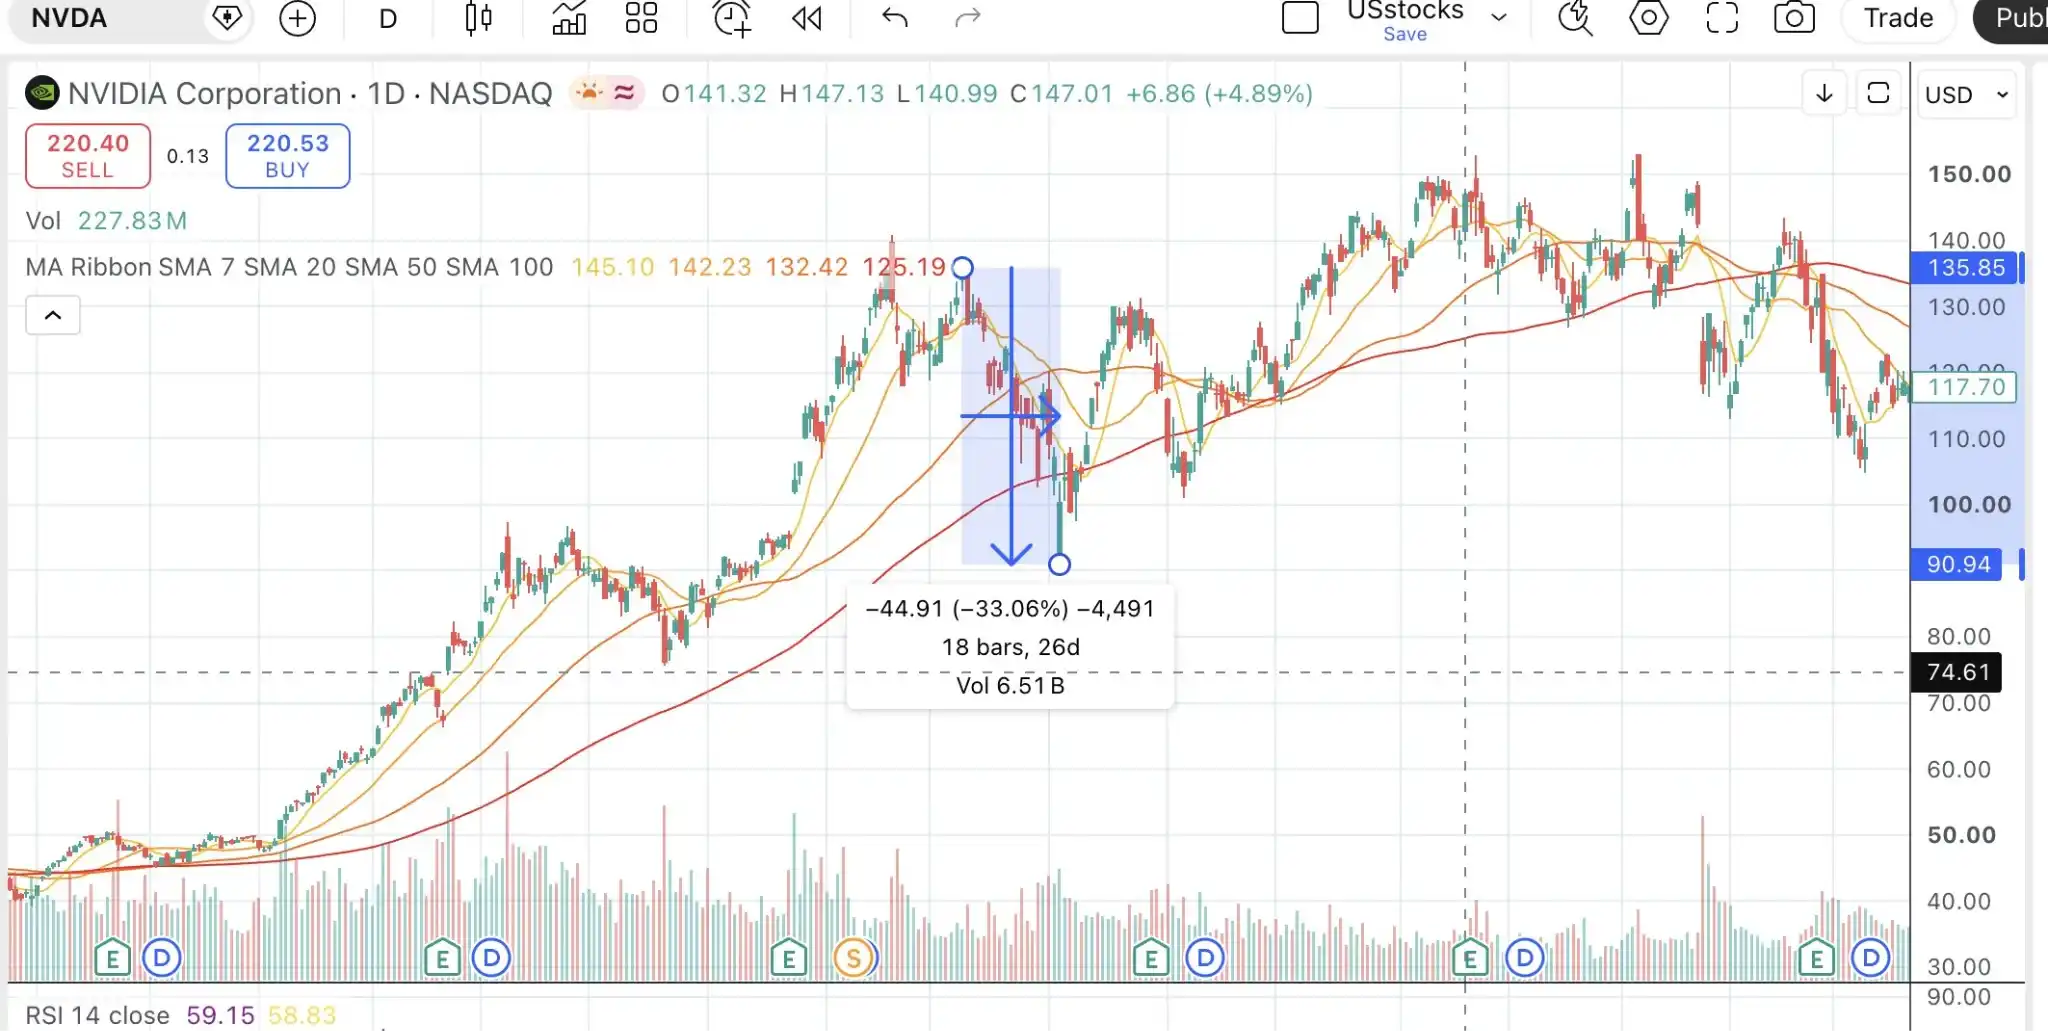
On the news front, triggers for the decline included rumors of Blackwell delays starting in July, reports of a US Department of Justice antitrust investigation, and finally, the Bank of Japan's interest rate hike on August 5th, which triggered carry trade unwinding and a panic sell-off in global risk assets, hitting the low. In other words, "a mix of fundamental rumors/small stories + macro-driven asset sell-off."

From August 8th to September 6th, over the course of a month, the stock rebounded from being oversold, coupled with some policy easing on the macro front; but it didn't surpass the previous high. Nvidia's "good but not perfect" earnings report triggered another decline.

Subsequently, on September 11th, Nvidia announced that Blackwell had entered full production and shipments would begin in Q4. Nvidia's stock rose 8% that day. Coupled with the Fed's first 50bp rate cut in 4 years, Nvidia's stock price broke to a new all-time high again on November 8th.

What can we learn from history?

1. What are the characteristics of a阶段性 (stage-wise) top?

Technical: Double top or failure to break through the previous high resistance level; simultaneously, candlestick patterns show bearish engulfing patterns;

Crowded positioning + high leverage: In June 2024, 70% of fund managers believed being long the Mag7 was the most crowded trade, while small-cap short interest approached historical records. The entire market was crowded on one side of the boat;

In the five trading days leading up to August 27, 2024, during another top interval for Nvidia's stock price, retail investors net bought $1.4 billion worth of NVDA. In the same period, the second-place, Tesla, was only at the $100-200 million level, a nearly tenfold difference. NVDL (the 2x Long NVDA ETF) had net inflows of $3.5 billion for the year and repeatedly became the most actively traded instrument intraday.

Fundamentals: On August 28th, Nvidia's earnings report showed revenue and guidance exceeding expectations, but because gross margin fell by 3%, the stock dropped nearly 7% after hours.

So, it's not hard to see that the characteristics of a stage-wise top are the emergence of topping patterns on the technical side, coupled with increased fragility in positioning (high concentration, high leverage). Once there's any hint of trouble in fundamentals or news, the stock price will immediately plummet.

The practical approach is: once technical characteristics appear for identification, and if positioning shows excessive leverage and concentration, one should immediately reduce holdings to hedge risks. Once the downtrend is confirmed, sell.

2. Bottom characteristics

Technical: On August 5th, a long-bodied candlestick after a gap down open, with sufficient volume — 553 million shares was the highest single-day trading volume in that period, exceeding all surrounding trading days. On August 6th, it closed above the previous day's body, confirming an engulfing pattern. On the 7th, a pullback did not break the previous low.

These three days formed the technical signal for a bottom.
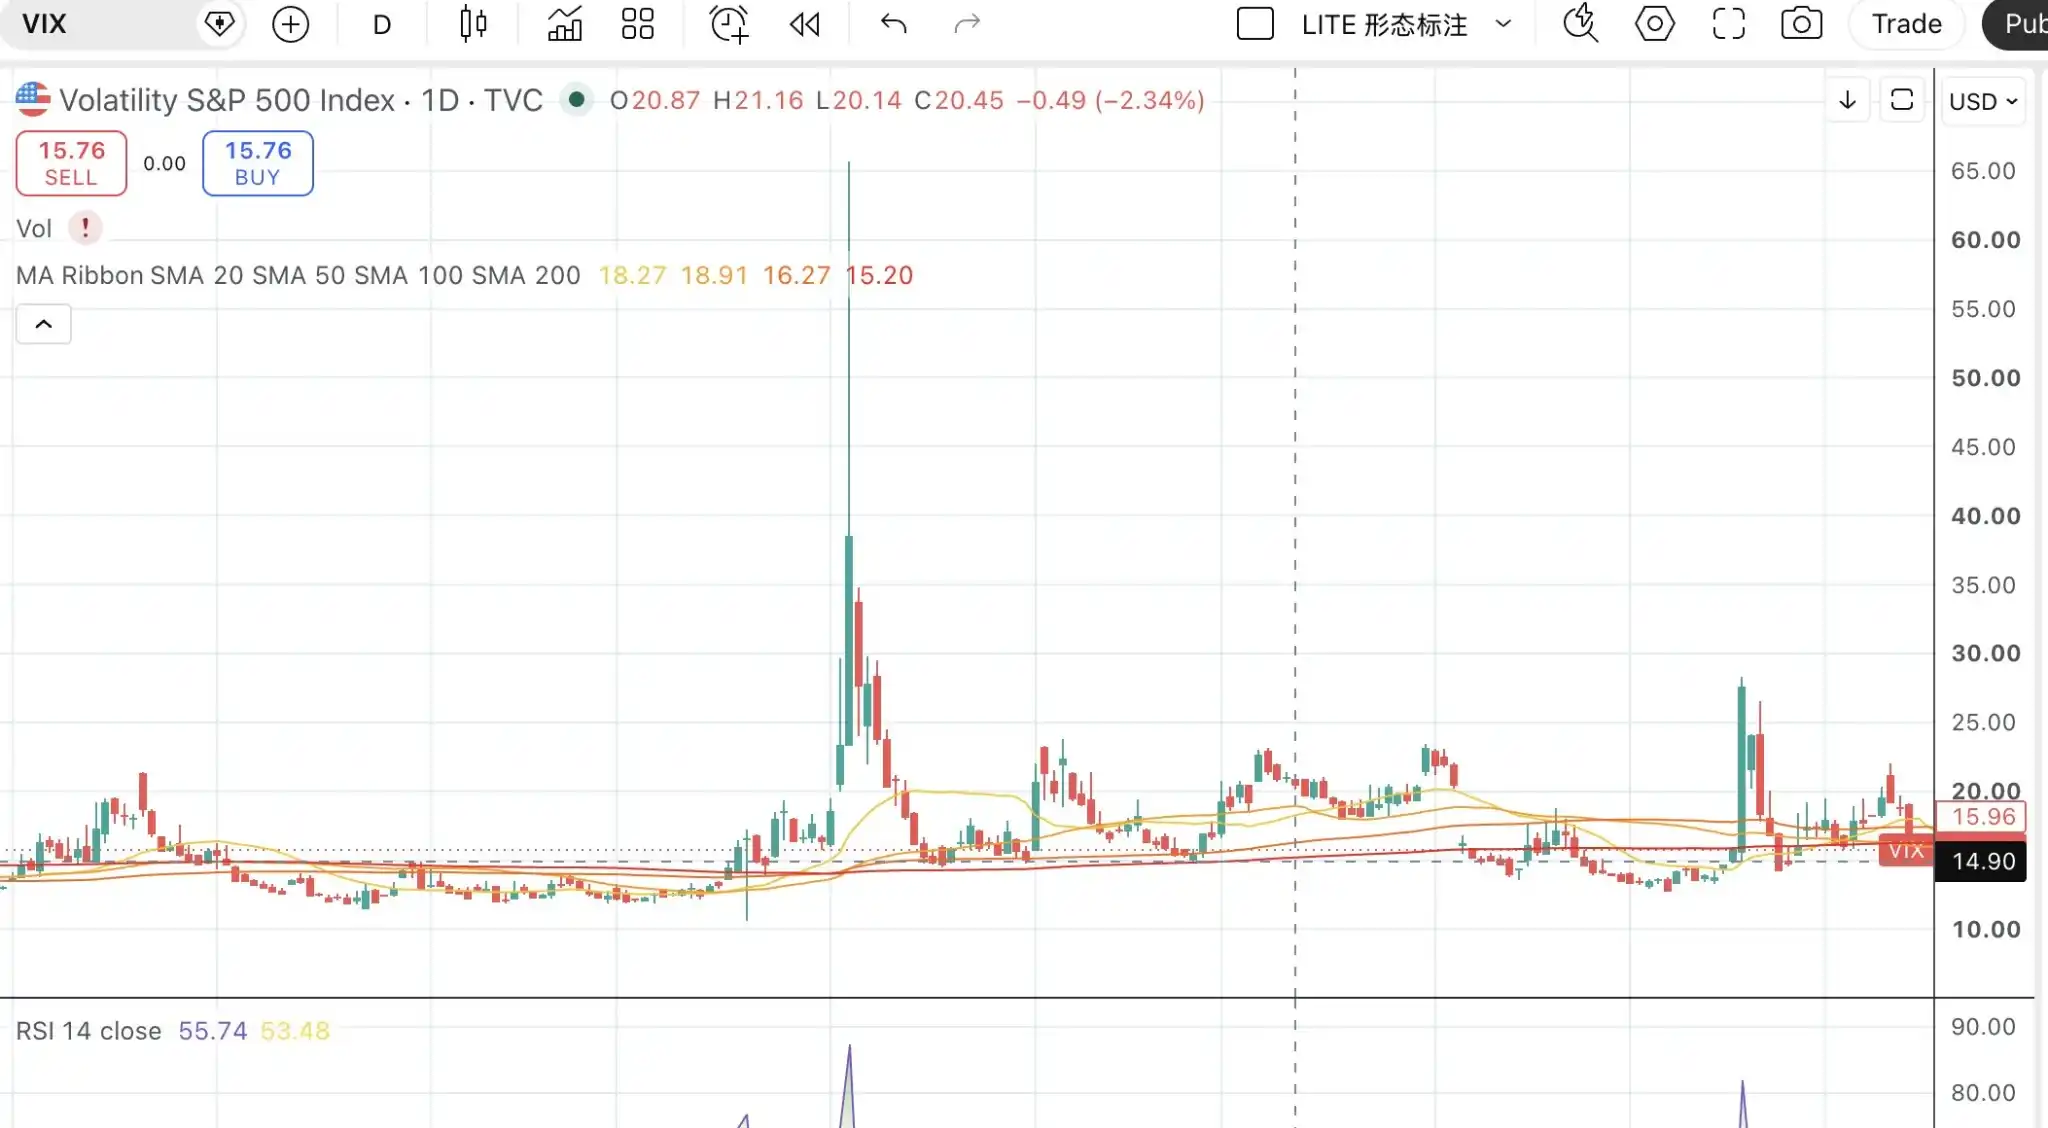
We further confirm with positioning: The VIX指数 (VIX index) hit a record that day, reaching 65 intraday (the third highest in history);外围市场 (peripheral markets) like the Nikkei were down -12.4% (largest since 1987), KOSPI down -9% triggering a circuit breaker. All market-level恐慌指标 (panic indicators) were off the charts, also meaning selling pressure reached an extreme;

Fundamentally, the main bearish trigger chain was the BoJ's rate hike on July 31st, yen carry trade unwinding, and the US July non-farm payrolls at 114k, far below expectations. This was a macro-driven sell-off for the broader market, unrelated to Nvidia's fundamentals.

The rebound on September 6th followed similar logic, just not as extreme as on August 5th.

We can also identify bottom characteristics: first, technical patterns begin to show bottoming formations, especially confirmed by volume; second, the logic of the decline does not touch the core business fundamentals of the enterprise. It's more often a one-off macro event or short-term shock for the broader market. Ultimately, quality companies will see their prices修复 (recover from) the erroneous sell-off.
Trend Kriptolar

İlgili Sorular

QWhat is the main analogy the author draws to analyze the current semiconductor market situation?

AThe author analogizes the current semiconductor market situation to the script of Nvidia in 2024, specifically comparing the potential phase of the semiconductor cycle ('fish tail' phase) to Nvidia's price action pattern from mid-2024.

QWhat were the combined factors that led to Nvidia's sharp decline in July-August 2024 according to the article?

AThe sharp decline was triggered by a combination of factors: fundamental rumors (like Blackwell delay), regulatory news (DOJ antitrust investigation), and a macro event (the Bank of Japan's rate hike leading to carry trade unwinding and a panic sell-off in global risk assets).

QAccording to the article, what are the key characteristics of a 'stage top' (díng) in a stock's price movement?

AThe key characteristics are: technical chart patterns showing a top (like a double top or failure to break previous highs), crowded and highly leveraged capital inflows which increase fragility, and a subsequent negative catalyst from fundamentals or news that triggers a sharp price drop.

QWhat technical and market signals indicated the formation of a bottom for Nvidia on August 5, 2024?

AThe bottom was indicated by technical signals: a long-bodied bullish candlestick on high volume (the highest in that period) on August 5th, followed by a confirming pattern in the next two days. Market signals included extreme fear indicators like a spike in the VIX index and major sell-offs in other global markets, suggesting selling pressure had peaked.

QWhat practical trading advice does the article suggest once signs of a potential top appear?

AThe article suggests that once technical top signals appear, especially if accompanied by signs of excessive leverage and crowded positioning, an investor should immediately reduce position size to hedge risk. If a confirmed downtrend begins, one should sell the position.

İlgili Okumalar

Analysts: MiCA Has Not Caused Significant Global Outflow from USDT

Analysts from Artemis Analytics and independent research from LUISS University and the University of Surrey indicate that the European Union's Markets in Crypto-Assets (MiCA) regulation has not caused a significant global outflow from Tether (USDT), despite its restriction on regulated European platforms. Data shows no notable change in the overall supply or demand for USDT directly linked to MiCA's implementation, nor a large-scale migration of liquidity between exchanges or blockchains. Within Europe, the regulation has shifted trading patterns, with platforms moving toward USD Coin (USDC) instead of USDT. However, this change is localized. On a global scale, the aggregate market shares and trading volumes of major stablecoins have remained largely stable. USDT has retained its position as the leading stablecoin by market capitalization, which stood at approximately $183.27 billion in late July. Activity involving USDT continues to grow primarily outside the EU, particularly in global and emerging markets, as seen in increased user numbers on networks like BNB Chain and Tron. The resilience of dollar-pegged tokens is attributed to their expanding use beyond trading, such as for payments and remittances in regions like Argentina. While MiCA has reshaped the European market structure, it has not yet triggered a comparable shift in the global stablecoin landscape.

cryptonews.ru1 saat önce

Analysts: MiCA Has Not Caused Significant Global Outflow from USDT

cryptonews.ru1 saat önce

İşlemler

Spot

Popüler Makaleler

CHECK Nasıl Satın Alınır

HTX.com’a hoş geldiniz! Checkmate (CHECK) satın alma işlemlerini basit ve kullanışlı bir hâle getirdik. Adım adım açıkladığımız rehberimizi takip ederek kripto yolculuğunuza başlayın. 1. Adım: HTX Hesabınızı OluşturunHTX'te ücretsiz bir hesap açmak için e-posta adresinizi veya telefon numaranızı kullanın. Sorunsuzca kaydolun ve tüm özelliklerin kilidini açın. Hesabımı Aç2. Adım: Kripto Satın Al Bölümüne Gidin ve Ödeme Yönteminizi SeçinKredi/Banka Kartı: Visa veya Mastercard'ınızı kullanarak anında Checkmate (CHECK) satın alın.Bakiye: Sorunsuz bir şekilde işlem yapmak için HTX hesap bakiyenizdeki fonları kullanın.Üçüncü Taraflar: Kullanımı kolaylaştırmak için Google Pay ve Apple Pay gibi popüler ödeme yöntemlerini ekledik.P2P: HTX'teki diğer kullanıcılarla doğrudan işlem yapın.Borsa Dışı (OTC): Yatırımcılar için kişiye özel hizmetler ve rekabetçi döviz kurları sunuyoruz.3. Adım: Checkmate (CHECK) Varlıklarınızı SaklayınCheckmate (CHECK) satın aldıktan sonra HTX hesabınızda saklayın. Alternatif olarak, blok zinciri transferi yoluyla başka bir yere gönderebilir veya diğer kripto para birimlerini takas etmek için kullanabilirsiniz.4. Adım: Checkmate (CHECK) Varlıklarınızla İşlem YapınHTX'in spot piyasasında Checkmate (CHECK) ile kolayca işlemler yapın.Hesabınıza erişin, işlem çiftinizi seçin, işlemlerinizi gerçekleştirin ve gerçek zamanlı olarak izleyin. Hem yeni başlayanlar hem de deneyimli yatırımcılar için kullanıcı dostu bir deneyim sunuyoruz.

431 Toplam GörüntülenmeYayınlanma 2026.01.19Güncellenme 2026.06.02

CHECK Nasıl Satın Alınır

Tartışmalar

HTX Topluluğuna hoş geldiniz. Burada, en son platform gelişmeleri hakkında bilgi sahibi olabilir ve profesyonel piyasa görüşlerine erişebilirsiniz. Kullanıcıların CHECK (CHECK) fiyatı hakkındaki görüşleri aşağıda sunulmaktadır.

活动图片