The macro backdrop remains caught between slowing growth and inflation that refuses to fully roll over. Recent US inflation data came in firmer than expected, while labour markets continue to hold up better than many anticipated. As a result, markets have pushed rate cut expectations further into the future, keeping Treasury yields elevated and financial conditions relatively tight.
Liquidity remains the key driver across risk assets. Equities have continued to grind higher, but beneath the surface, the environment still feels shaky, with markets adjusting to the reality of rates staying higher for longer. At the same time, oil and broader commodity strength continue to feed into inflation expectations, particularly amid ongoing geopolitical tensions.
For digital assets, the picture remains constructive but selective. Bitcoin has continued to show resilience despite tighter liquidity conditions and a firm US dollar, suggesting underlying demand remains intact. However, softer ETF flows and elevated real yields imply that a more sustained move higher will likely require either easing financial conditions or a fresh catalyst to reignite broader risk appetite.
On-chain Insight
From Fear Toward Uncertainty
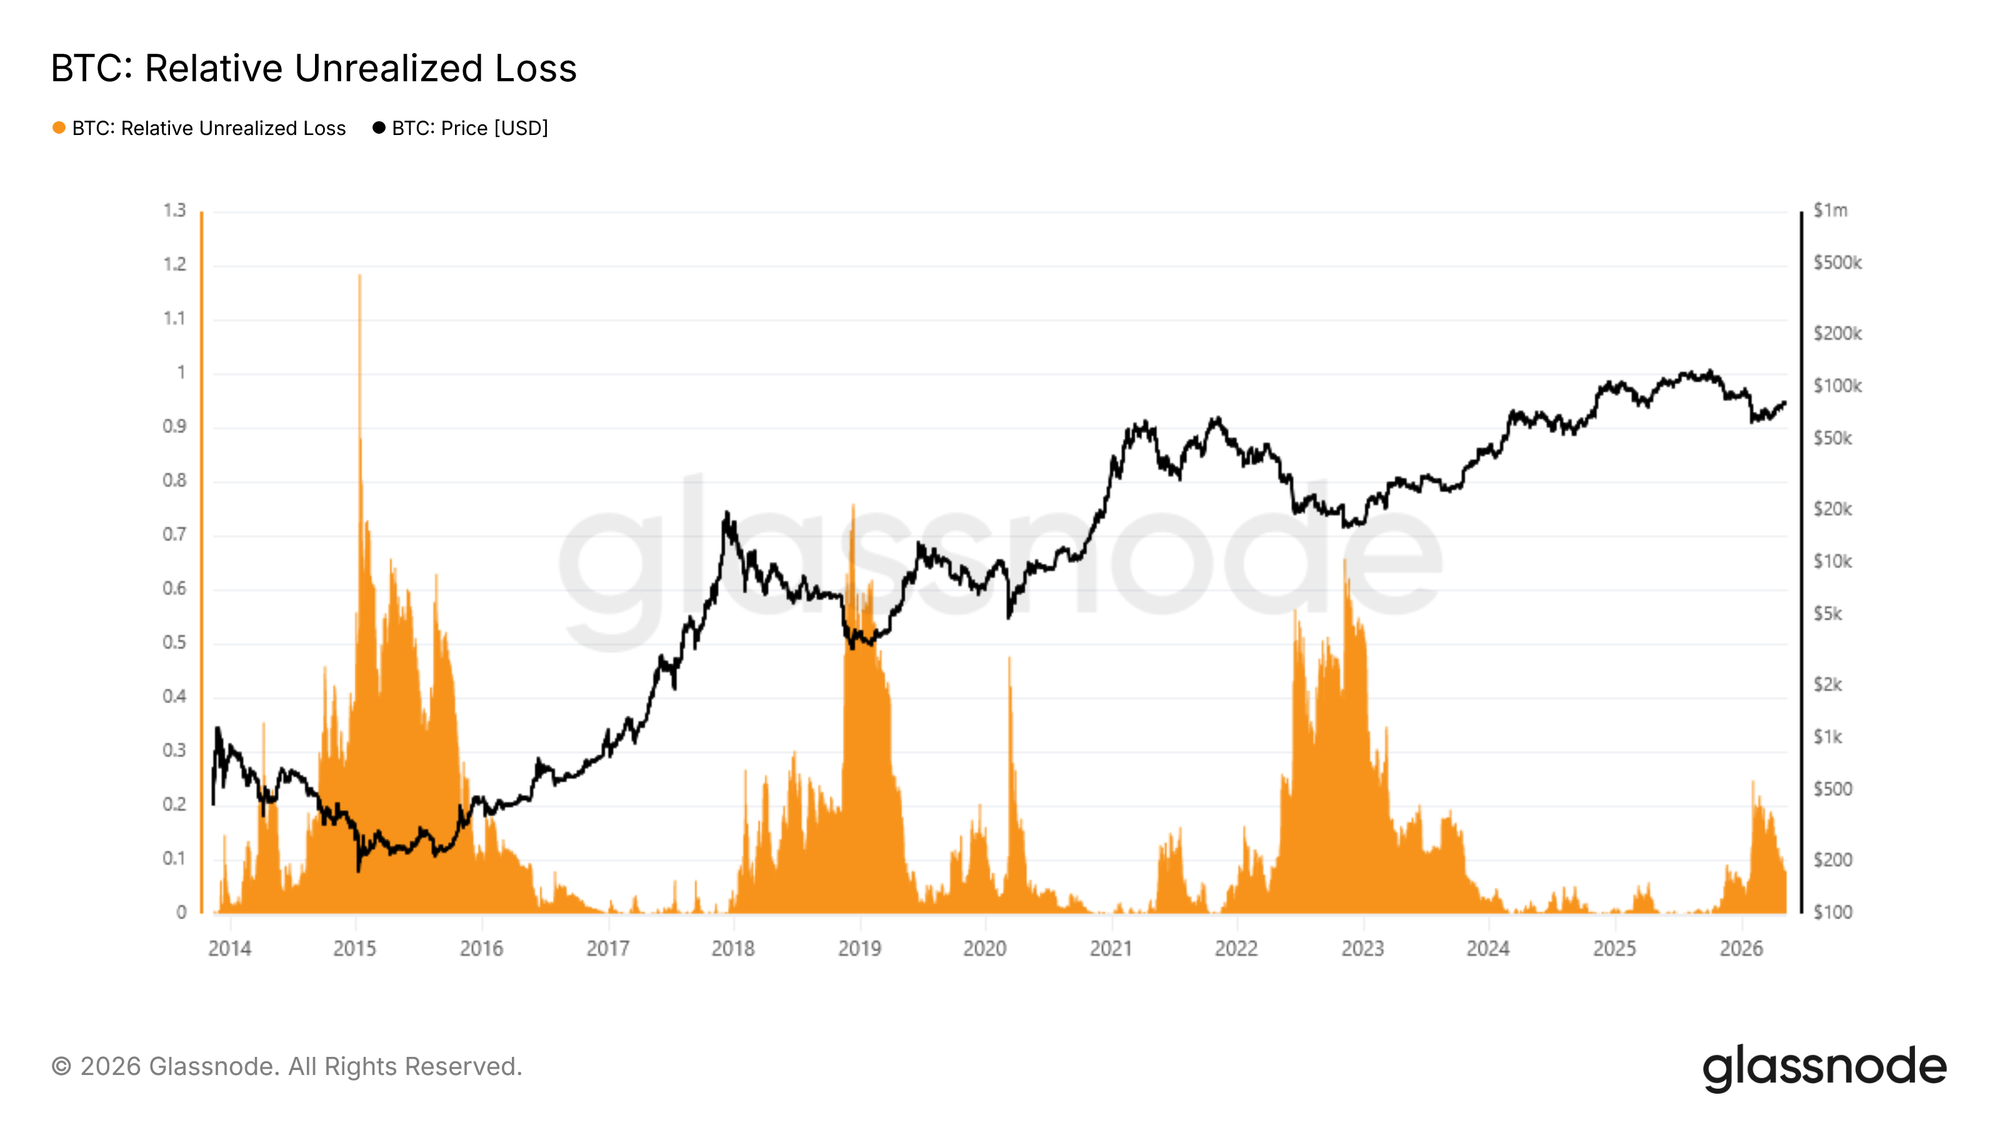
Against a macro backdrop of sticky inflation, elevated Treasury yields, and tighter financial conditions, Bitcoin has continued to demonstrate relative resilience, suggesting underlying demand remains intact even as the broader risk environment stays unsettled. To assess where the current cycle stands from a structural perspective, the Relative Unrealized Loss, which measures the aggregate dollar value of unrealized losses held across all investors as a fraction of total market capitalization, offers a precise cyclical barometer. During the February flash drop, this metric peaked at 25% of market cap, a reading that signals meaningful stress but remains a fraction of the extremes recorded in prior bear cycles. The subsequent recovery above $80k has compressed this figure to approximately 8%, a transition that shifts the prevailing sentiment from fear toward uncertainty rather than capitulation.
If $60k proves to have been the cycle low, this bear market would stand as the shallowest on record, one that registered fear but stopped well short of the broad capitulation that has historically marked durable cycle bottoms.
Sizing Up the Capital Flow
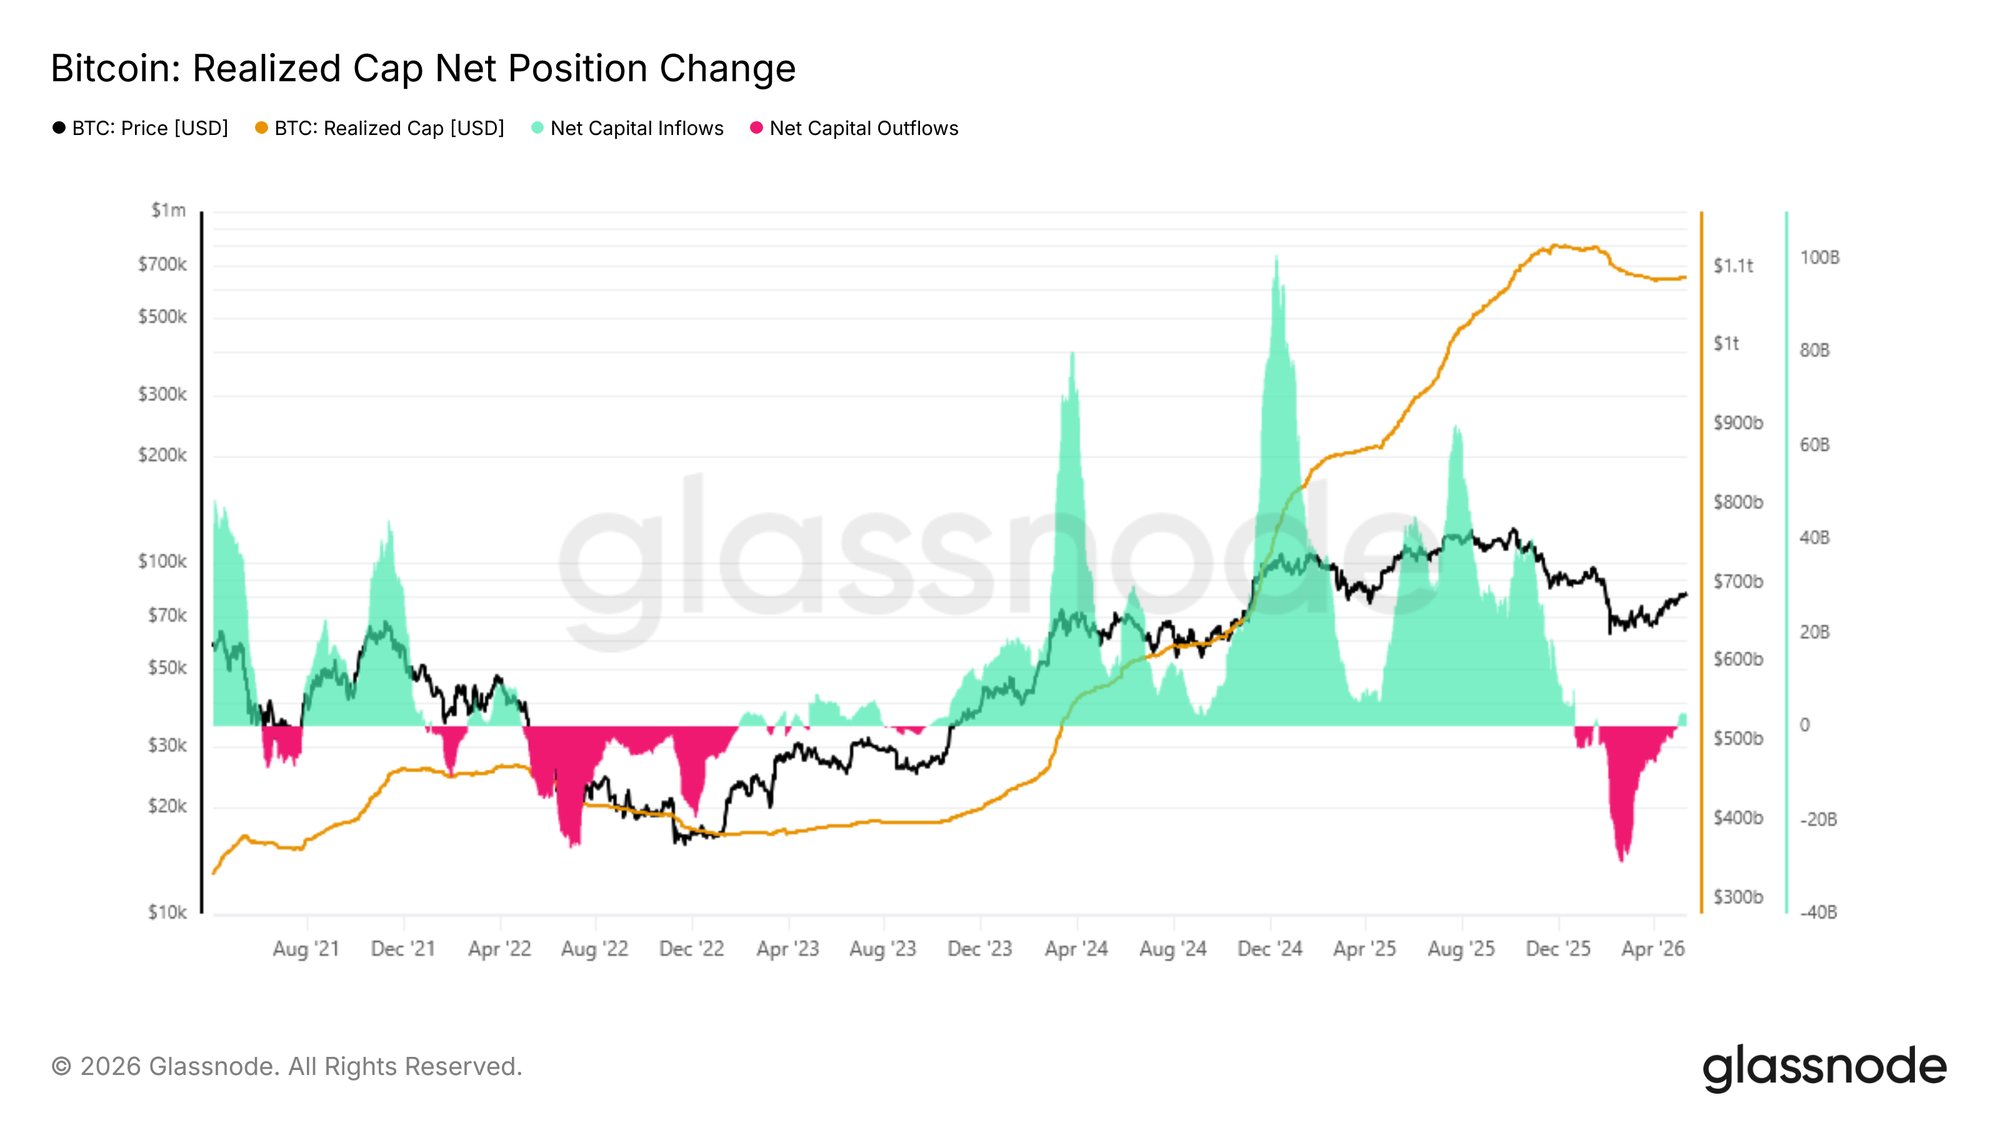
With sentiment shifting from fear toward uncertainty, the key question is whether the current rally represents a typical bear market bounce or the early stages of a genuine bull market transition. The most direct way to weigh this probability is to size up net capital flow, measured by the Realized Cap 30-Day Net Position Change, which tracks the monthly change in total capital stored on-chain. Following the recent rally to $82k, this metric has reached $2.8B per month, a positive reading that explains the constructive momentum of recent weeks.
However, context is critical: at the early stages of every major rally during the 2023 to 2025 bull market, this metric accelerated rapidly from around $2B toward $10B per month. The current reading, while encouraging, remains significantly below that threshold, suggesting the capital inflow underpinning this recovery lacks the conviction seen at comparable inflection points in the prior cycle.
Support and Resistance Through the Cost Basis Lens
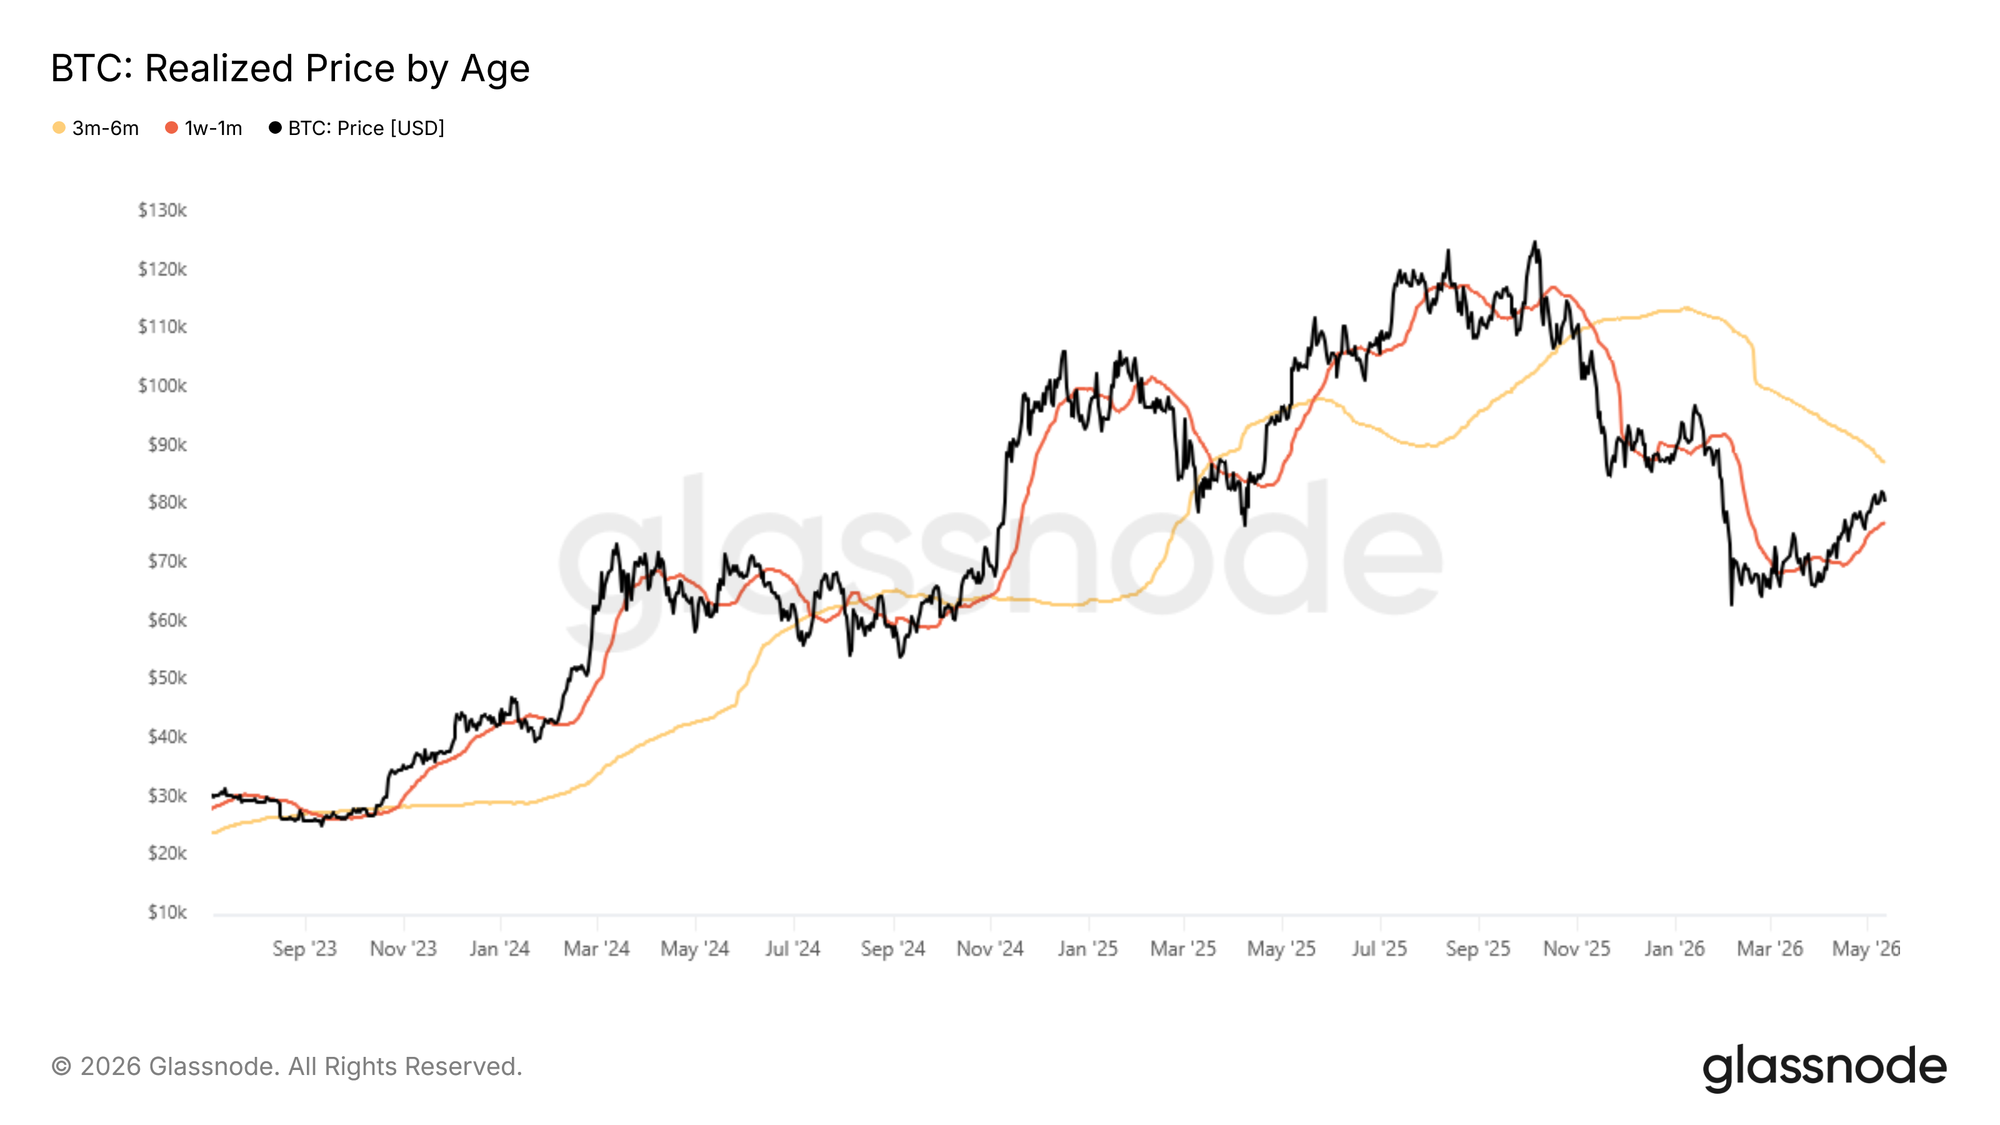
Confirming the uncertainty that persists despite a 37% rally from $60k to $82k amid still-modest capital inflows, the Realized Price by Age metric offers a granular framework for identifying the most immediate support and resistance levels. This model tracks the average acquisition price of coins segmented by holding period, mapping the behavioral anchors of distinct investor cohorts onto the price chart.
The momentum of the ongoing rally has been driven largely by a wave of accumulation over the past 30 days, with this cohort's cost basis now sitting at approximately $76.9k, forming the most immediate support floor in the short term. Overhead, the cost basis of investors who accumulated during the November to February range market consolidation clusters near $86.9k, representing the most probable near-term resistance zone as these holders approach breakeven and face a growing incentive to distribute into strength.
Off-Chain Insights
ETF Demand Rebuilds
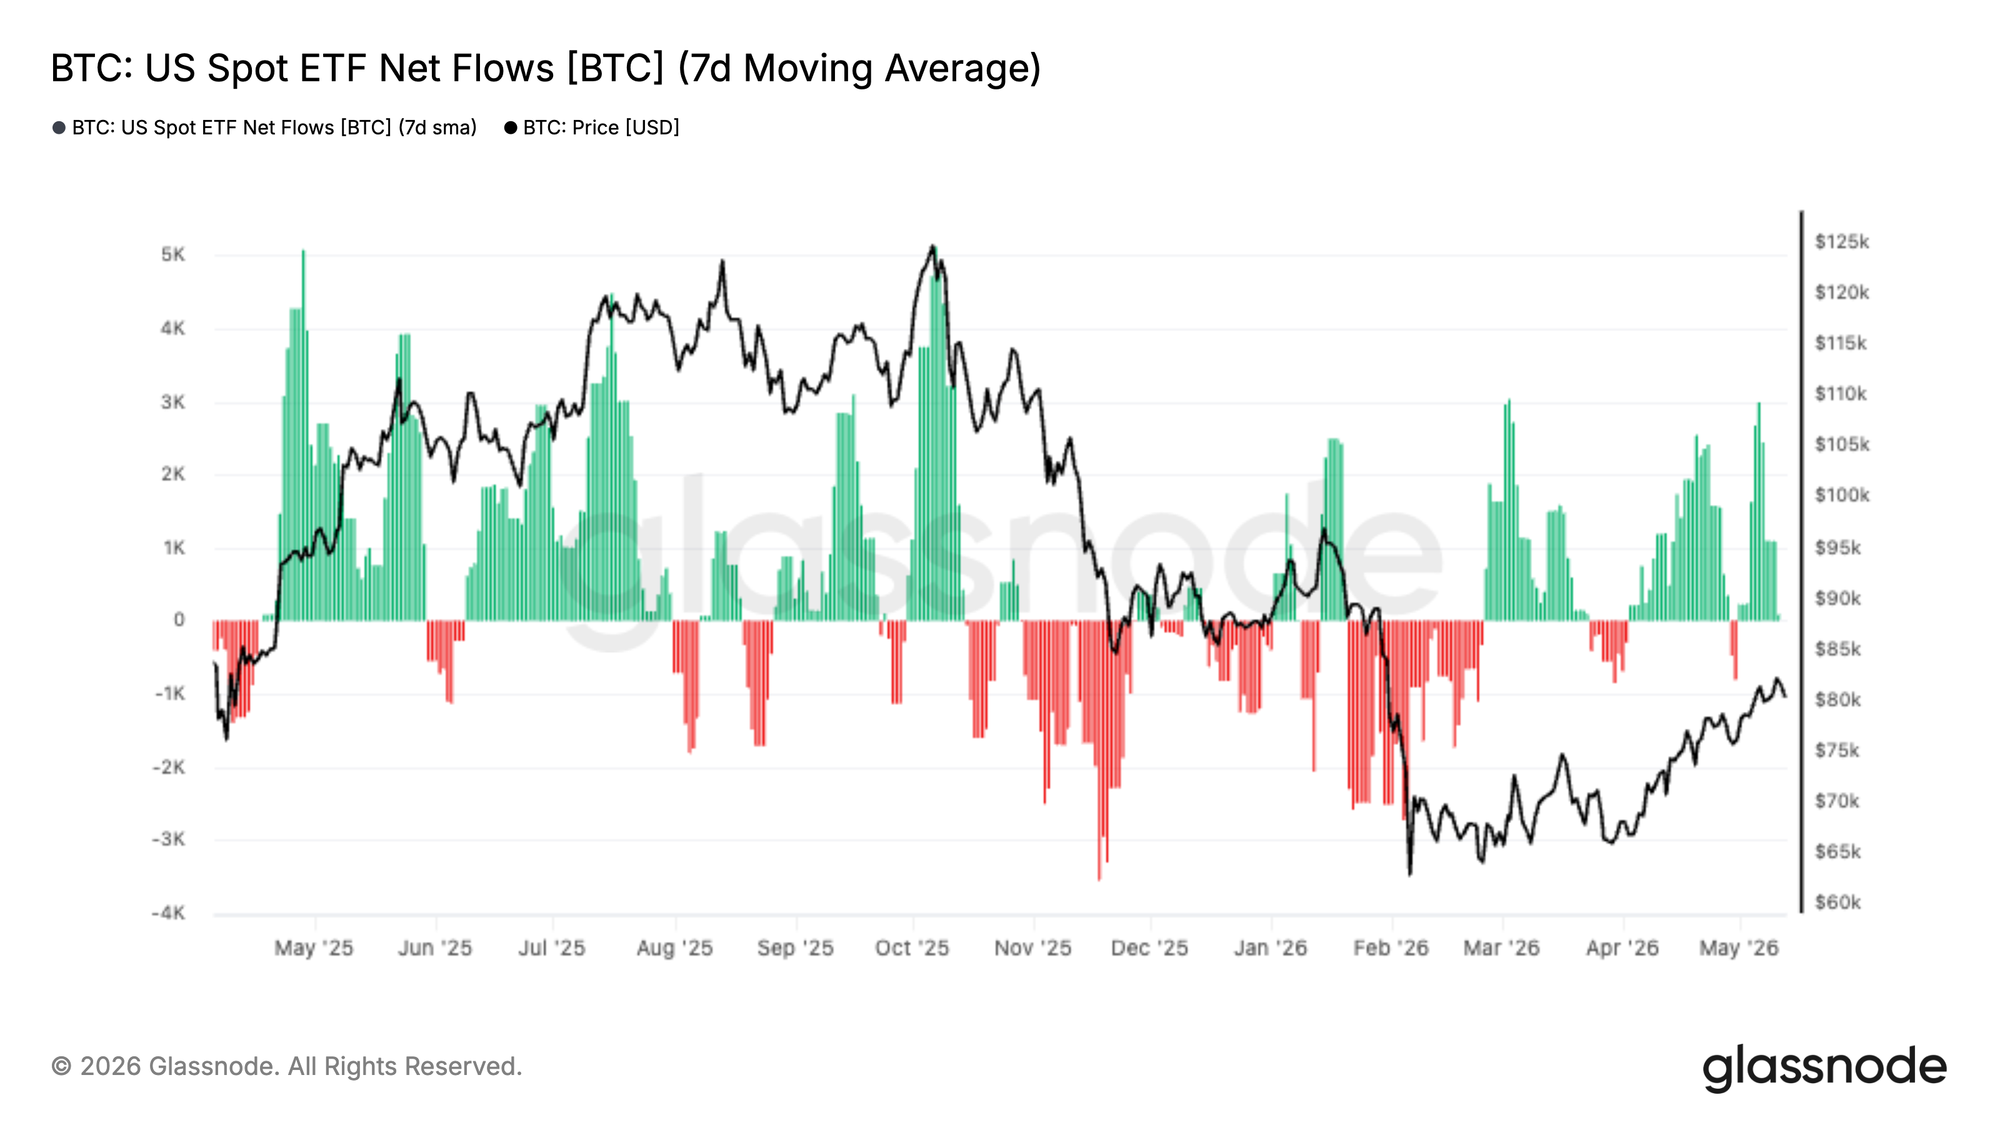
US Spot Bitcoin ETF flows have turned decisively positive in recent weeks, with sustained inflows returning alongside Bitcoin’s recovery back above the $80K level. After months of inconsistent demand and heavy outflows during the Q1 drawdown, the latest shift suggests institutional appetite is beginning to re-emerge in a more meaningful way.
Importantly, the recovery in ETF demand has remained persistent rather than driven by a single allocation spike, pointing to steady accumulation as market conditions improve. The strength of inflows has also accelerated alongside price, reinforcing the view that traditional capital is once again supporting momentum instead of fading rallies.
The current setup reflects a notable improvement in market structure relative to earlier this year. ETF flows are now acting as a tailwind rather than a source of persistent sell pressure, reducing one of the key headwinds that capped previous recovery attempts. If sustained, continued institutional accumulation could provide the demand base required for Bitcoin to challenge higher overhead supply zones in the weeks ahead.
Coinbase Spot Buying Re-Accelerates
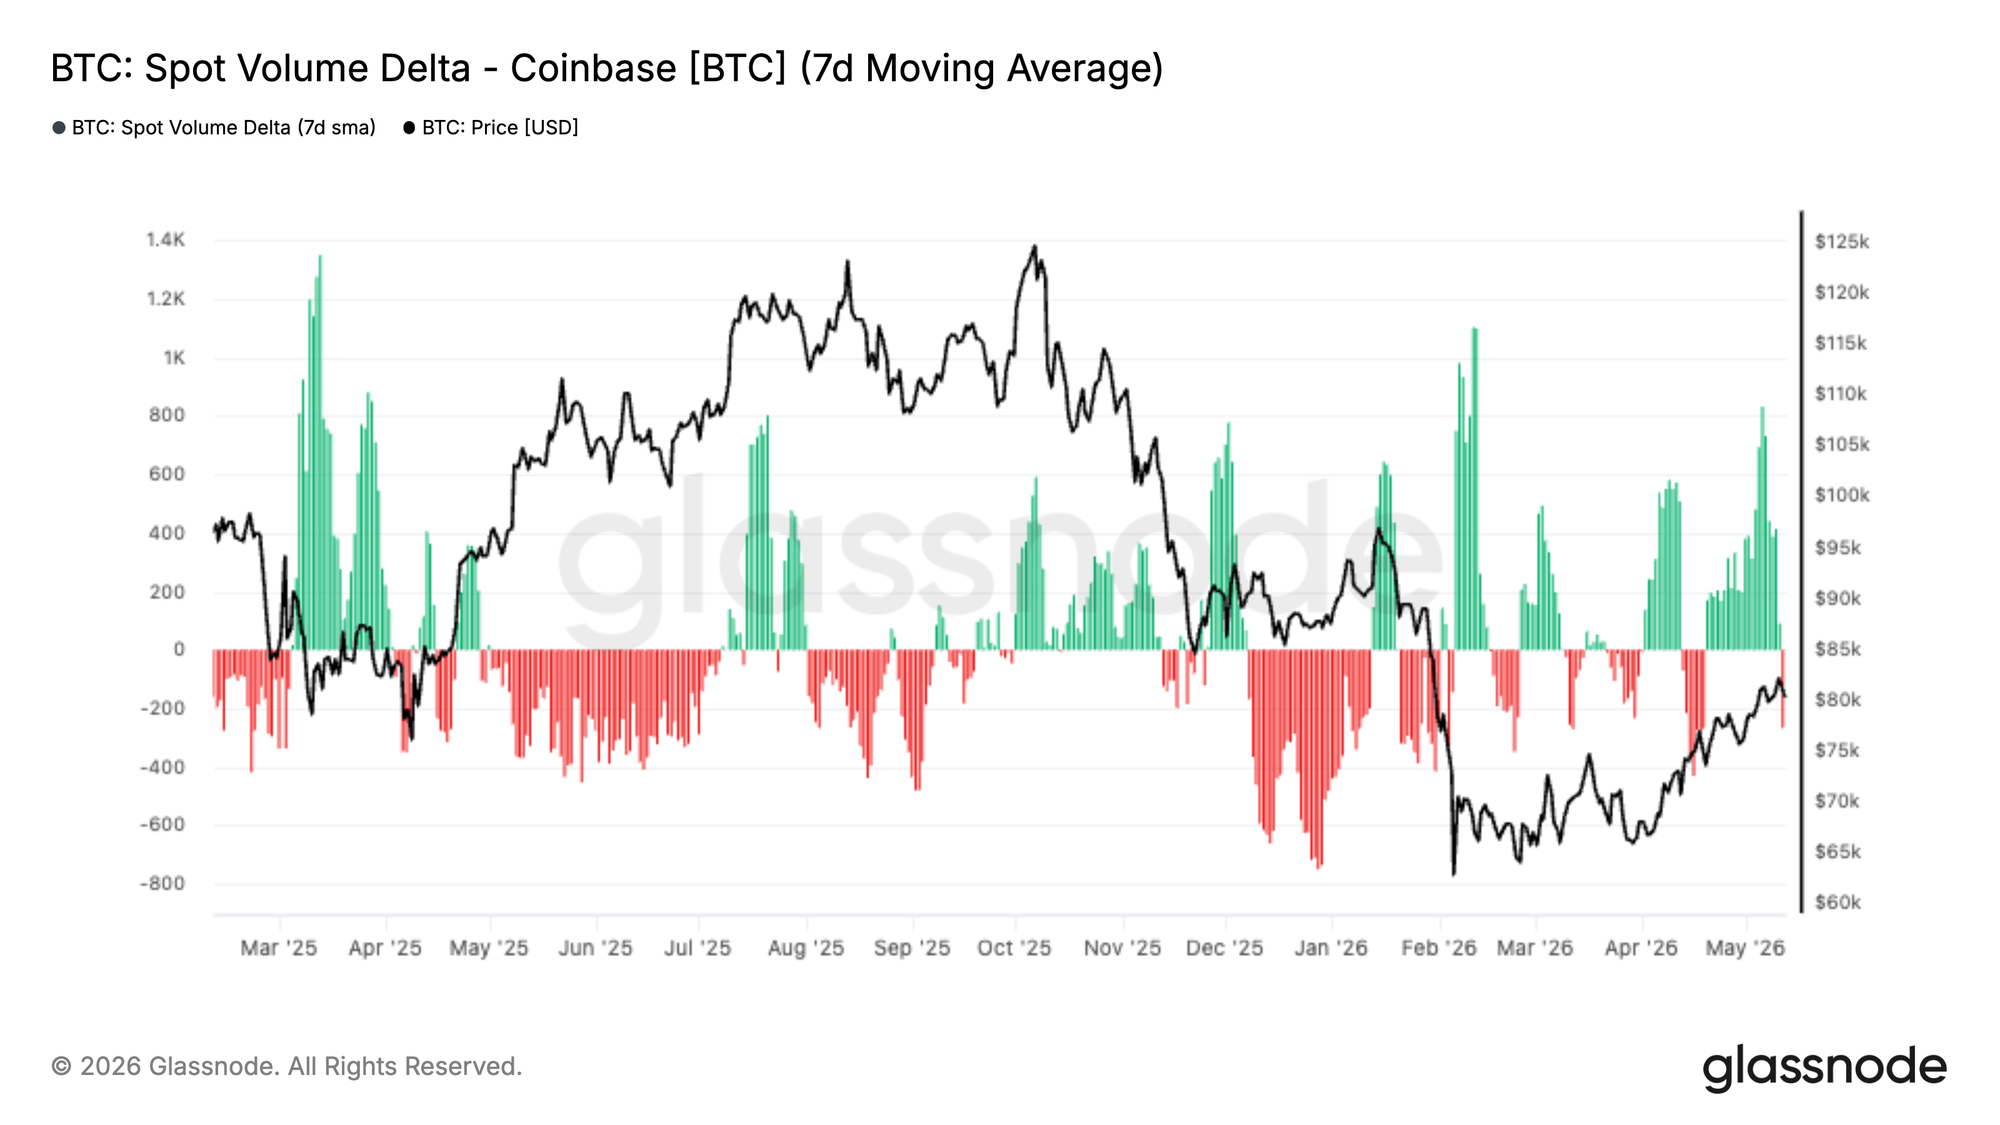
Coinbase Spot Volume Delta has turned sharply positive over the last two weeks, with aggressive buy-side activity returning as Bitcoin pushed back into the low-$80Ks. The recent shift stands in stark contrast to the persistent sell pressure seen throughout much of Q1, where negative volume delta consistently reinforced downside momentum.
Importantly, the latest move higher has been accompanied by repeated positive spot flow impulses rather than isolated buying spikes, suggesting sustained demand is beginning to absorb overhead supply. The strength in Coinbase activity also aligns closely with the recovery in ETF inflows, pointing to renewed participation from US-based and institutional buyers.
The current structure suggests spot demand is once again becoming supportive of price rather than acting as a source of distribution. Continued strength in Coinbase buy-side flows, particularly alongside rising ETF inflows, points to improving market conviction and a healthier demand profile underpinning the latest rally.
Hyperliquid Traders Lean Increasingly Long
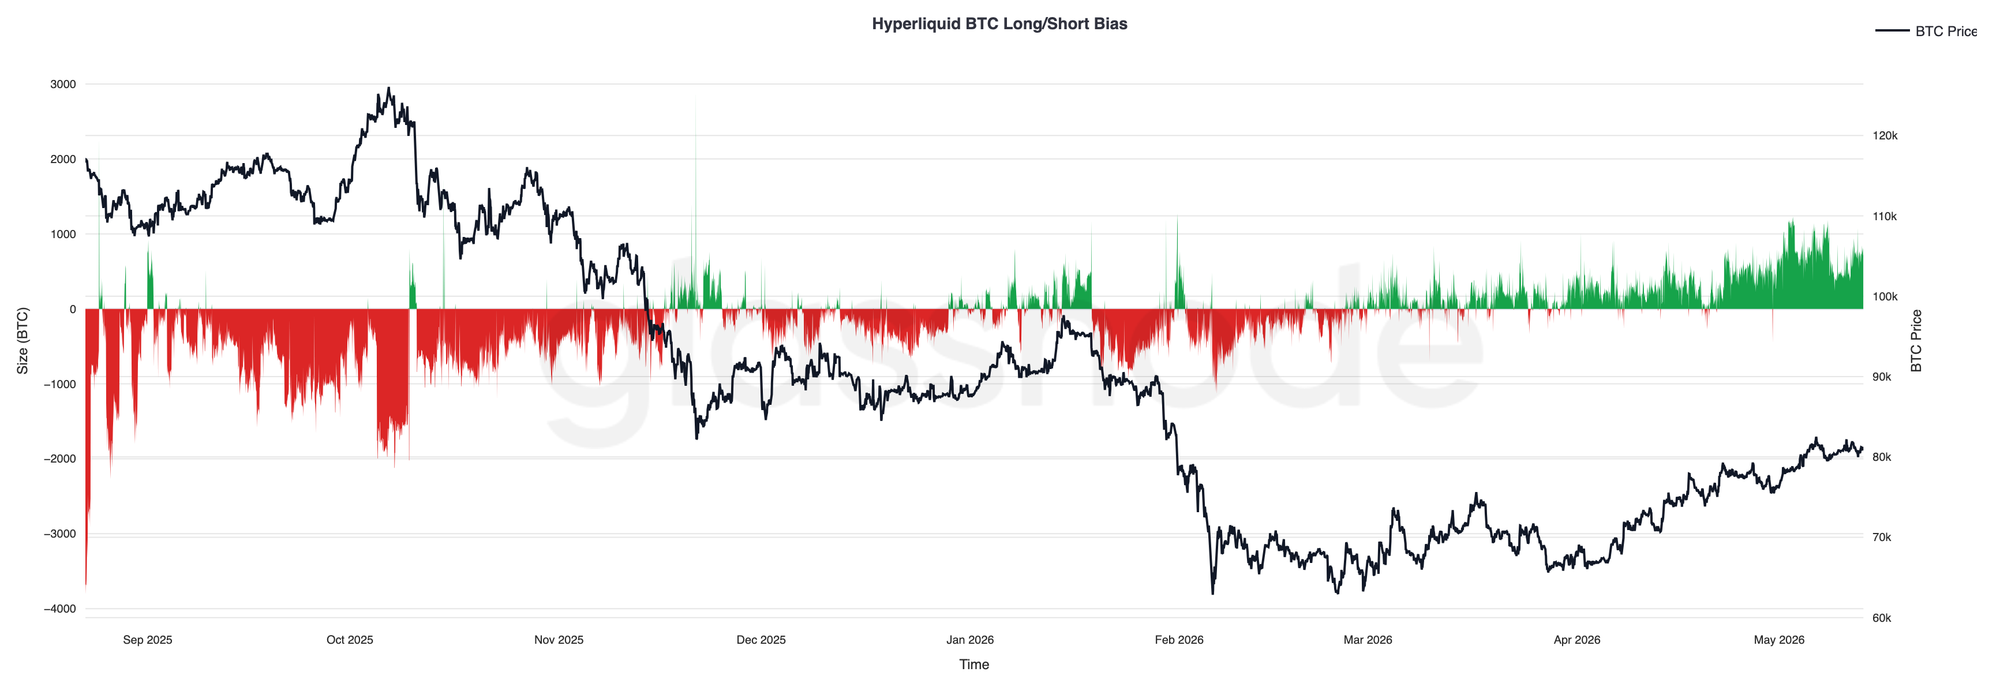
Positioning on Hyperliquid has become increasingly skewed toward the long side over the last several weeks, with net BTC positioning steadily rising alongside Bitcoin’s recovery into the low-$80Ks. The shift marks a notable reversal from the persistent short bias that dominated through much of Q1 2026 during the market’s drawdown toward the low-$60Ks.
Importantly, the recent increase in long exposure has developed gradually rather than through a single crowded positioning spike, suggesting traders are steadily rebuilding directional bullish exposure as market conditions improve. Net positioning is now sitting near the strongest long bias seen since late-2025, reflecting growing confidence in upside continuation.
The persistence of long positioning alongside rising price action points to improving trader sentiment and a more constructive speculative backdrop, although increasingly crowded long exposure may leave the market more sensitive to short-term volatility and liquidation-driven pullbacks.
Implied Volatility Moves Lower Across the Front End
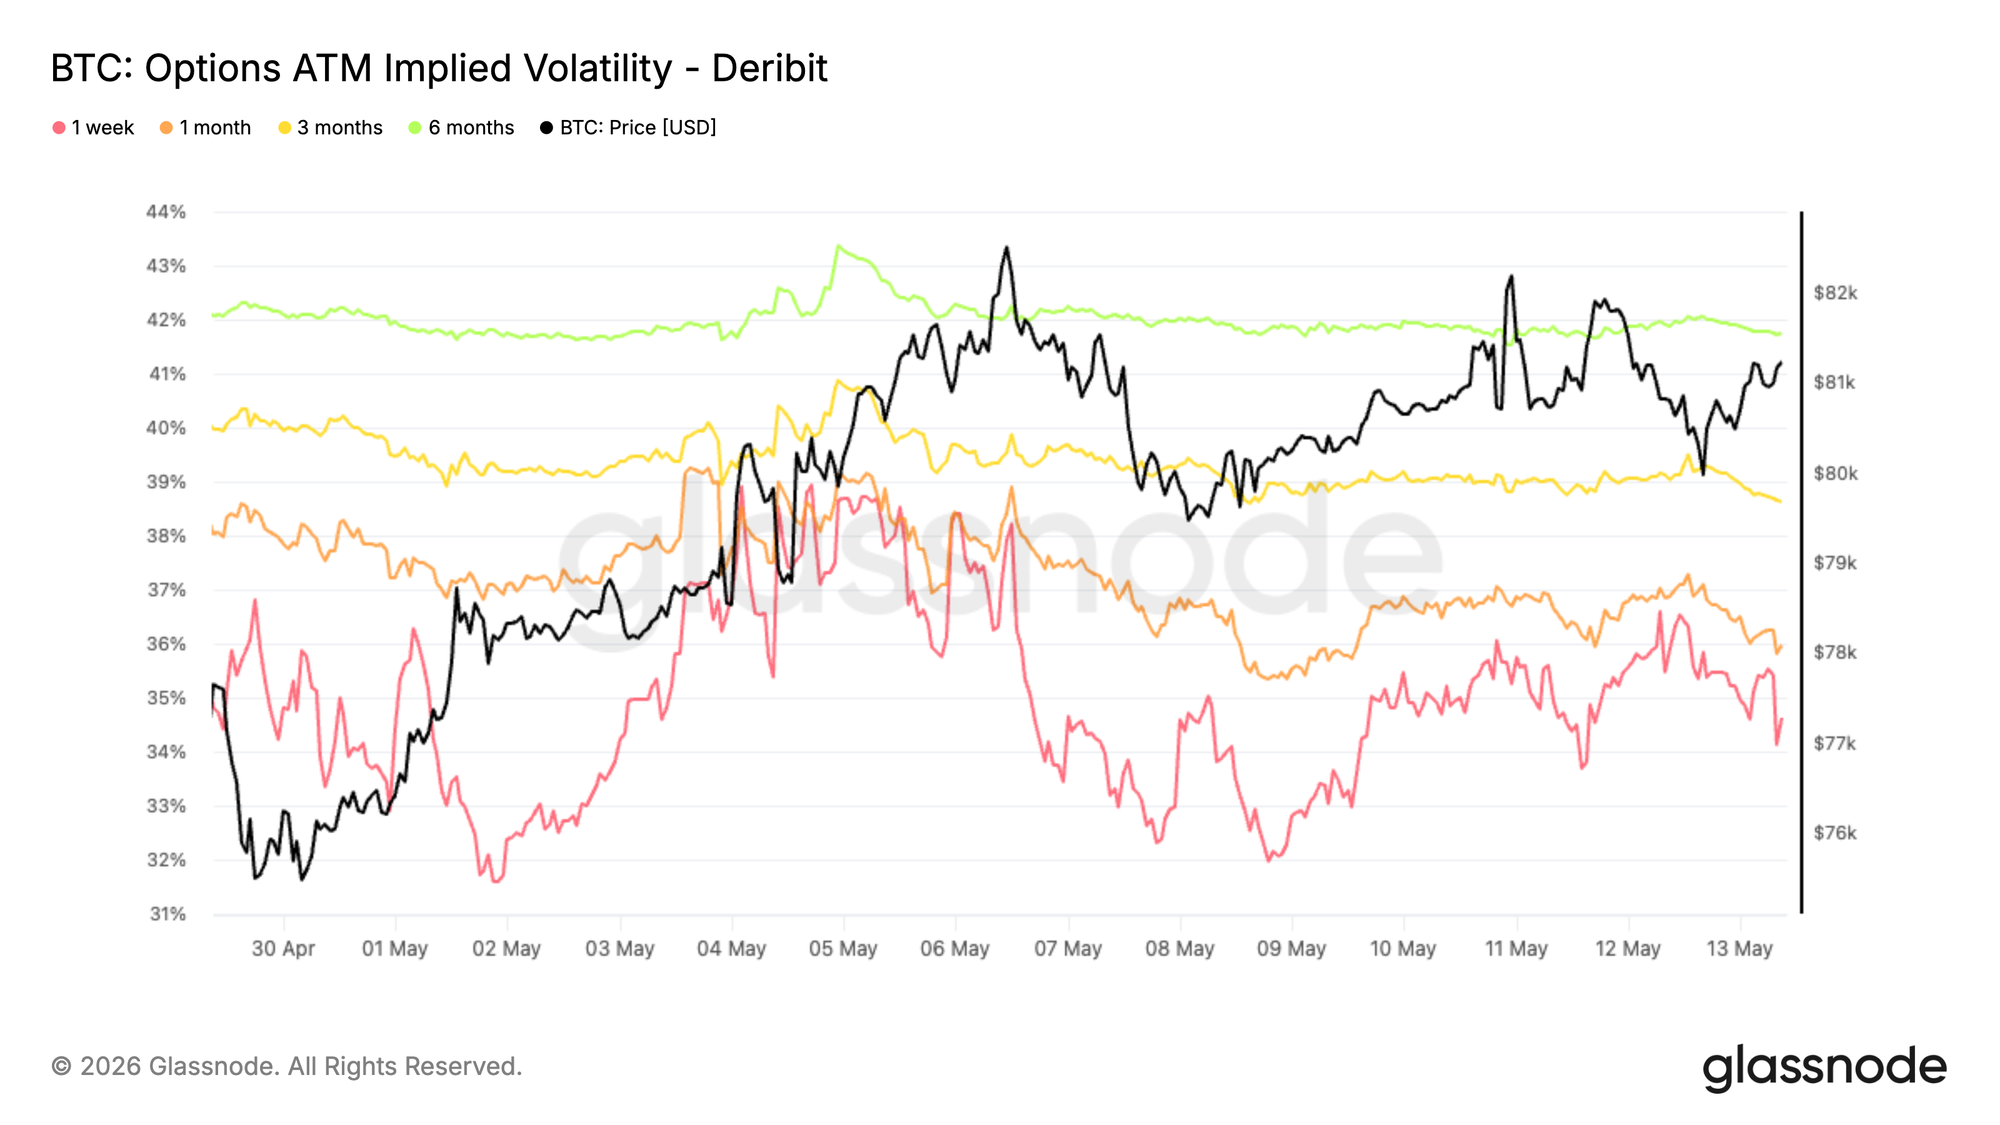
Bitcoin implied volatility has shifted lower over the past week, with the front month declining from 39% to 34.6%. Longer dated maturities have also moved lower, decreasing by around 1 to 2 vol points across the curve.
The move reflects a broader repricing lower across the term structure, as traders scale back expectations for near-term realized movement. The decline follows the recent volatility rebound and comes alongside more contained spot action, reinforcing the idea that the market is transitioning back toward a calmer regime.
As implied volatility compresses, the cost of optionality declines across maturities, particularly at the front end where pricing remains most sensitive to shifts in short-term positioning and demand.
The current structure reflects a market pricing fewer large moves ahead, with volatility supply continuing to outweigh demand across the curve.
Volatility Risk Premium Remains Positive
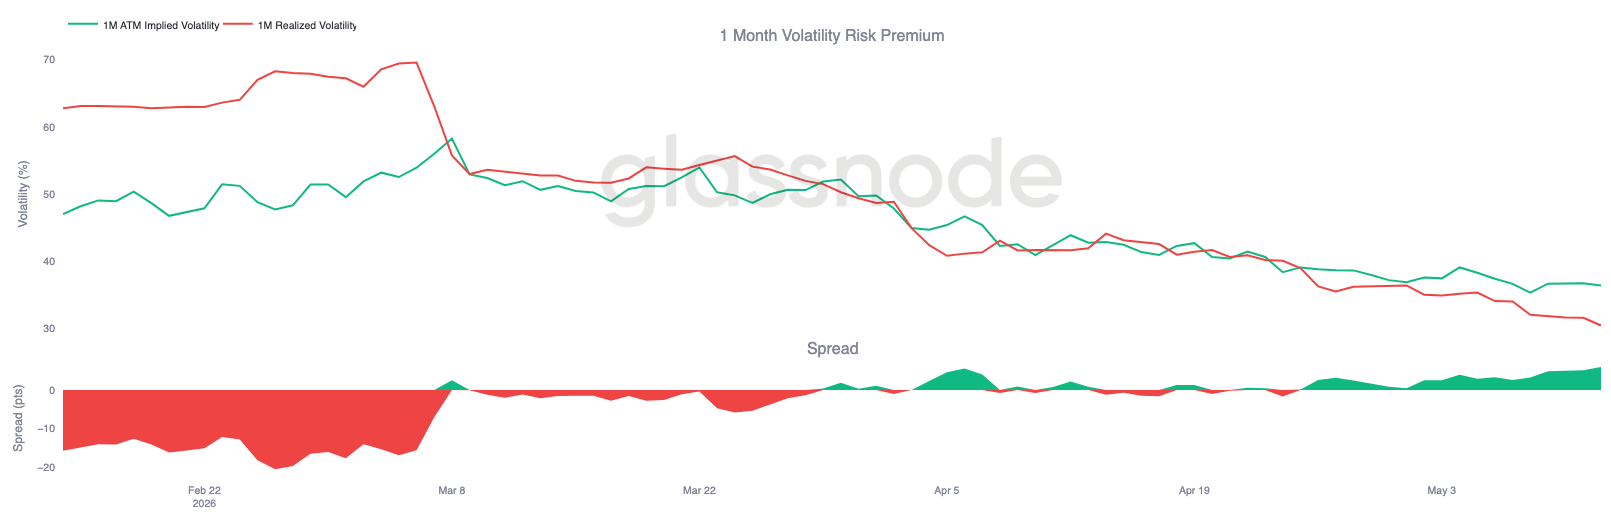
While implied volatility continues to compress across the curve, realized volatility is falling even faster. Bitcoin’s 30 day realized volatility now stands at 30.48%, continuing the steady decline seen over the past several weeks as spot action remains relatively contained.
At the same time, front-month implied volatility remains around 36.4%, leaving implied still trading above realized and preserving a positive volatility risk premium. In other words, options continue to price more movement ahead than what Bitcoin has recently delivered in spot volatility.
The spread between implied and realized volatility has also been rebuilding over the past two to three weeks, moving back toward the 6 vol area after briefly compressing toward flat in April. This suggests that despite the broader volatility reset lower, demand for optionality still remains elevated relative to realized movement.
Carry conditions therefore remain supportive for volatility sellers, even as the broader volatility regime continues to soften across both implied and realized measures.
Skew Compression Signals Softer Downside Hedging Demand
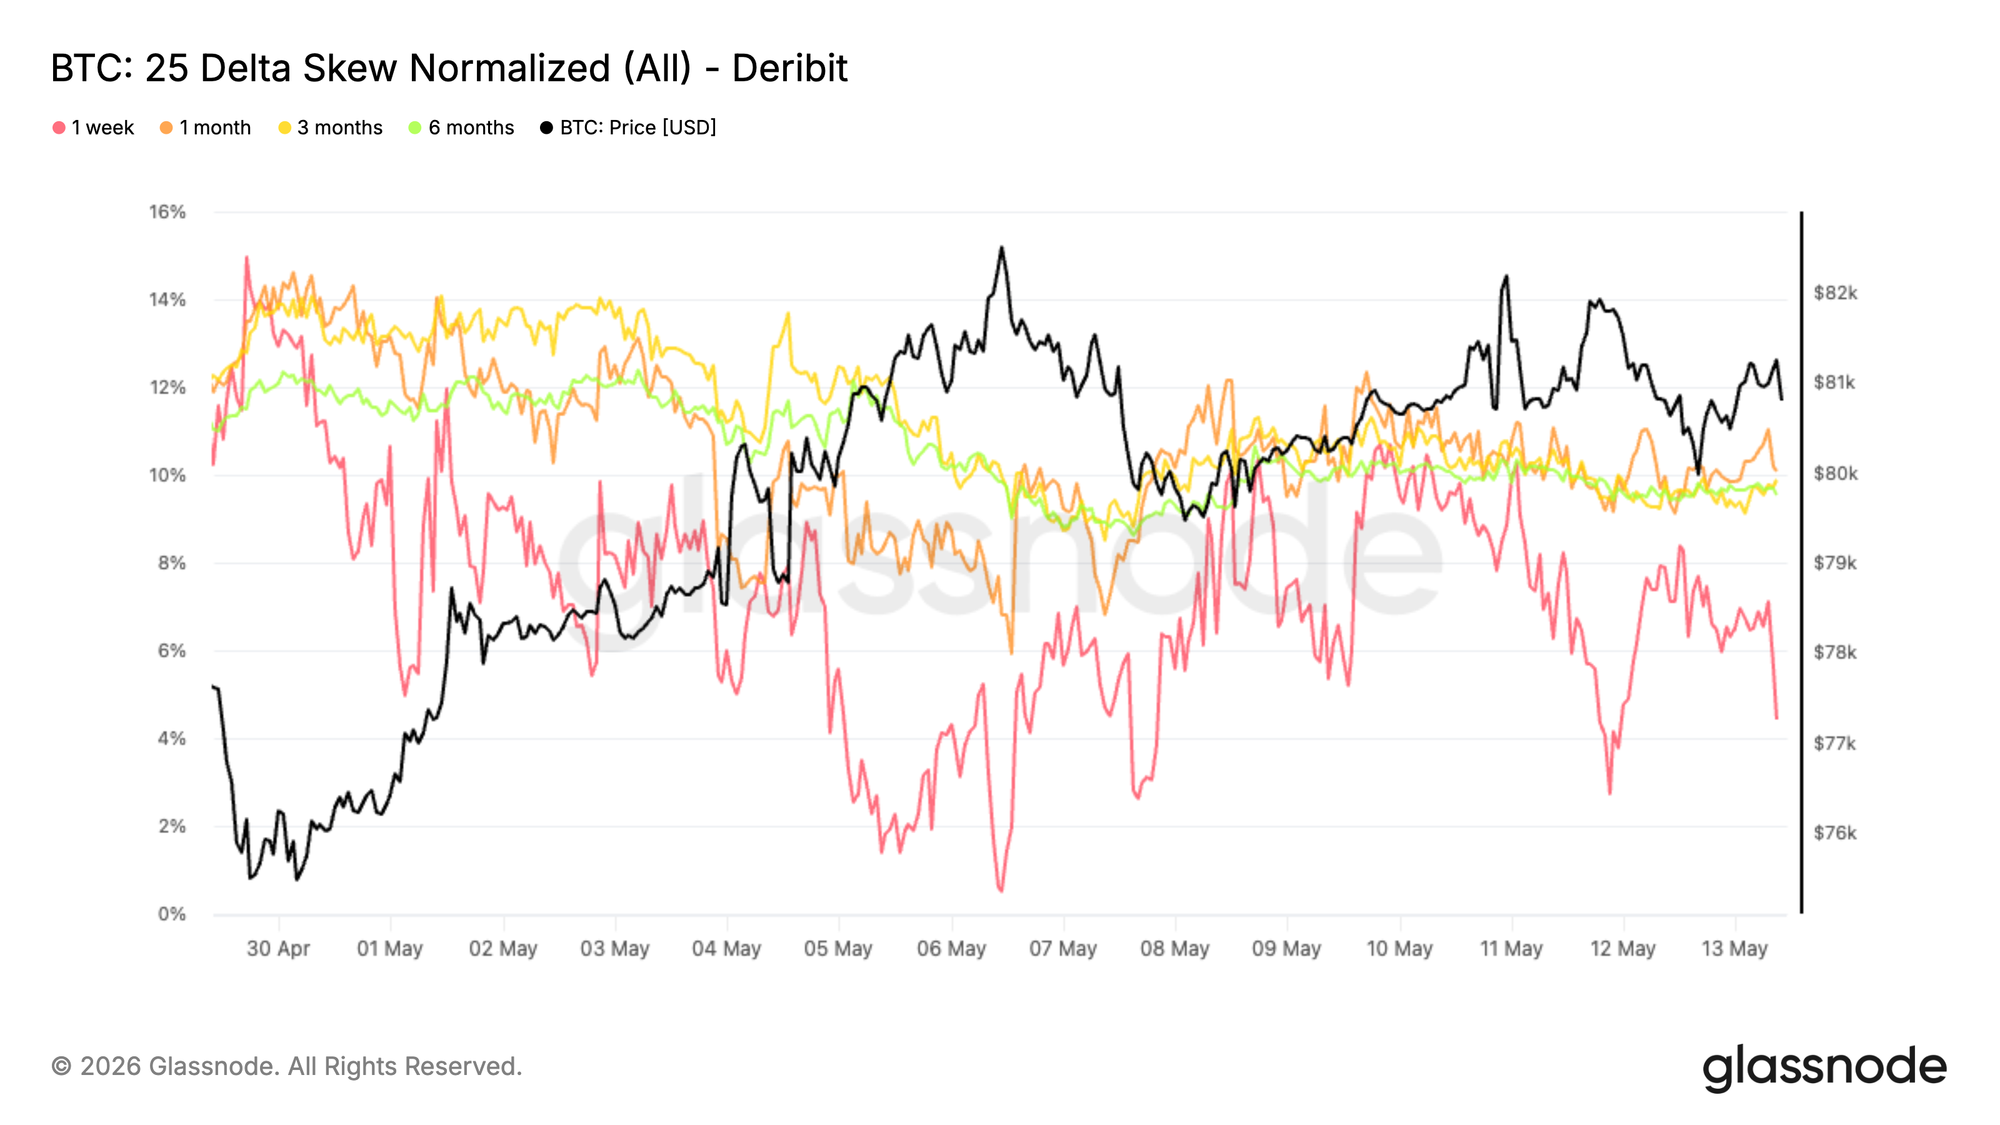
As volatility expectations continue to reset lower, skew is also normalizing across the curve. The move has been most pronounced at the front end, with the 1 week 25 delta skew compressing from around -10% to -4% over the past week. Longer dated maturities have also softened, with the 1 month, 3 month, and 6 month tenors losing roughly 1 to 2 points of put premium.
Notably, this compression comes while Bitcoin continues to consolidate around the 80K area amid a less supportive macro backdrop. Rather than showing increasing demand for downside protection, the options surface has continued to reprice toward a more balanced structure.
The move higher reflects a steady reduction in downside put premium relative to calls, pointing to softer demand for protective positioning across the curve.
While skew remains in put territory across maturities, the persistent compression suggests downside hedging demand is gradually easing rather than intensifying.
Dealer Gamma Keeps Spot Sensitive Around $82K
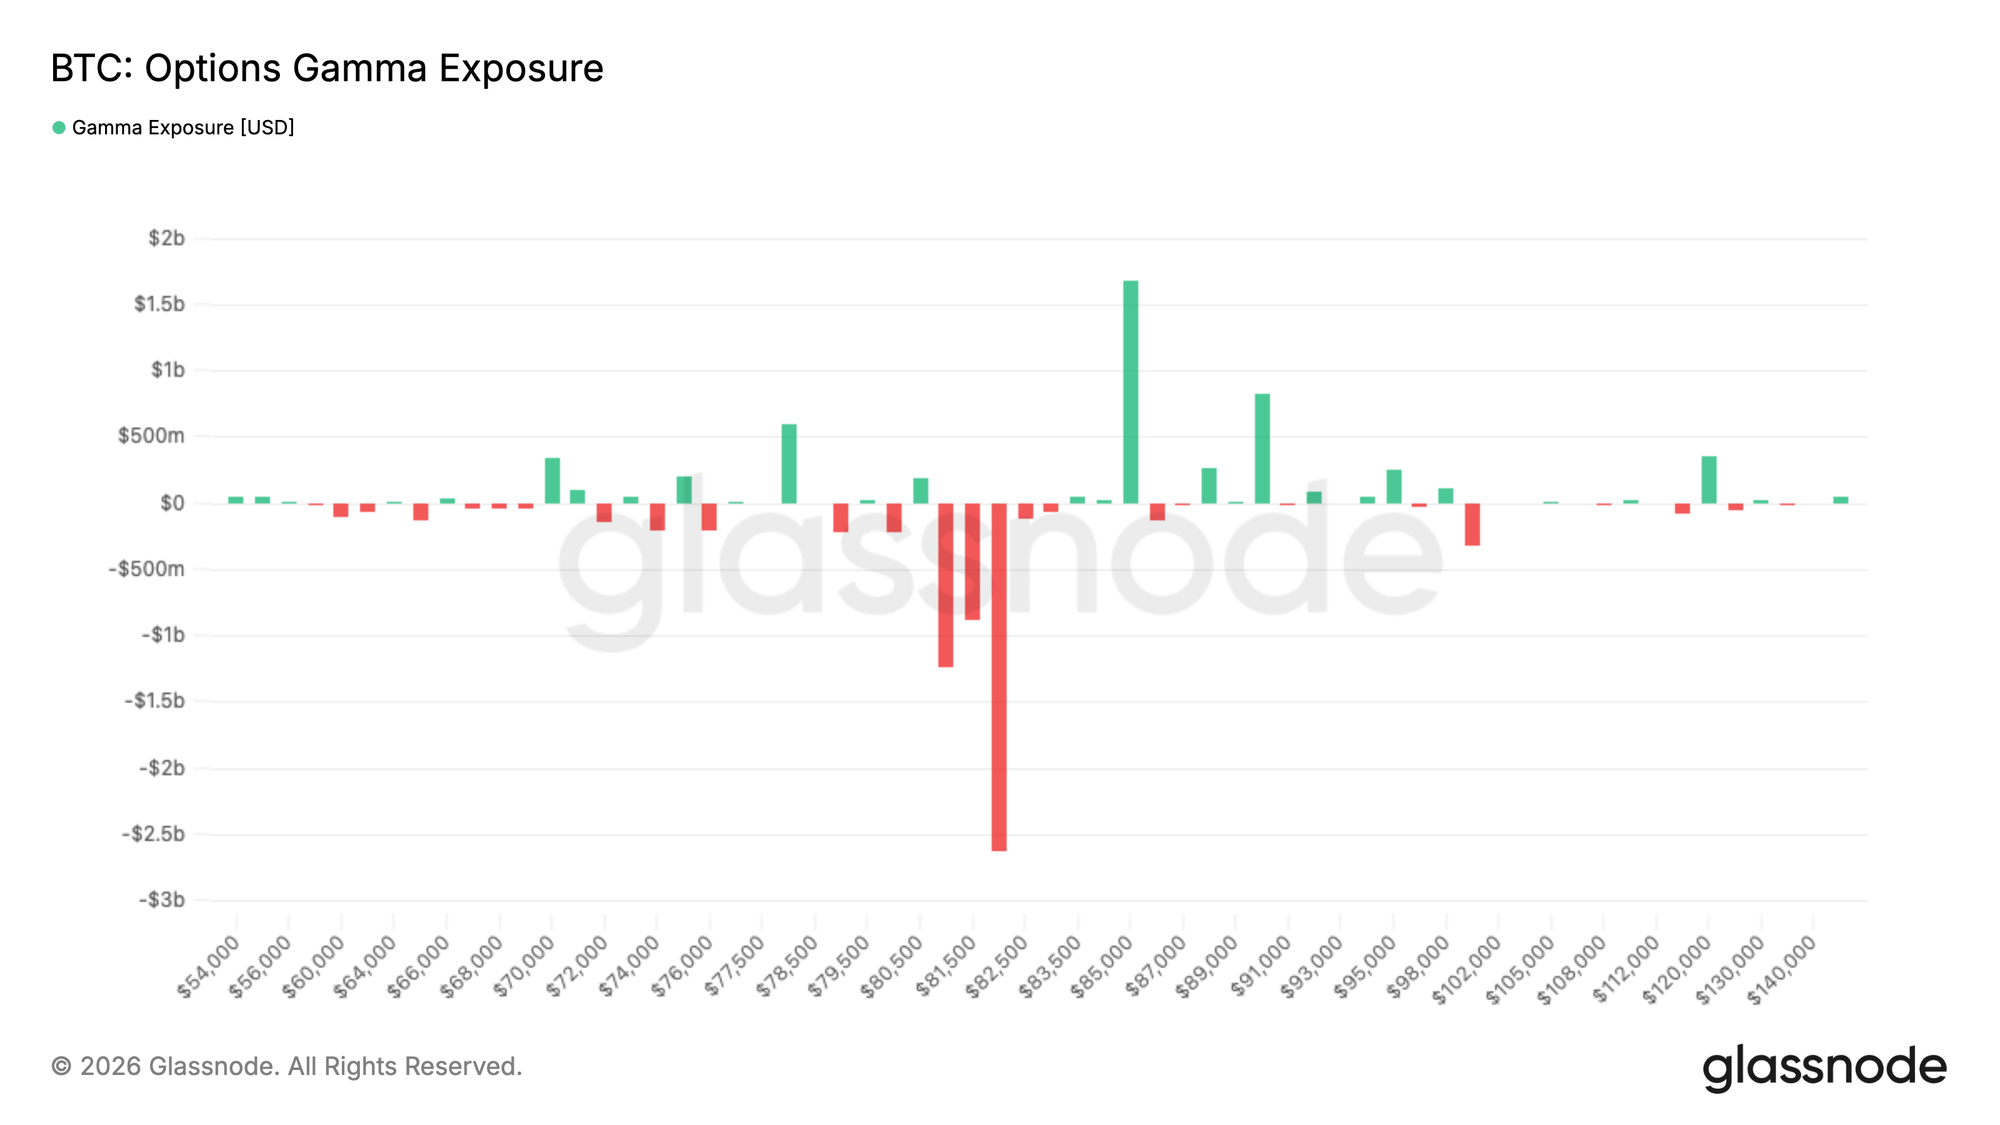
Dealer positioning continues to create a reactive structure around current price levels. The largest concentration of negative gamma sits at the $82K strike with roughly $2.6B of exposure, while positive gamma builds around $85K with close to $1.8B.
With spot still below the negative gamma cluster at $82K, a move back toward that zone could trigger reactive dealer hedging flows, reinforcing momentum and amplifying price action. Higher up, the positive gamma concentration around $85K could instead dampen volatility.
Flow also reflects shifting positioning. Over the past 7 days, put buying represented 71% of taker premium flow, reflecting elevated demand for downside protection during the recent consolidation. More recently, 58% of the last 24 hours flow came from puts being sold, suggesting some hedges are now being unwound.
The structure leaves the market increasingly sensitive to amplified hedging flows if spot re-engages the large negative gamma cluster around $82K.
Conclusion
In sum, Bitcoin’s recovery has continued to strengthen beneath the surface, with spot-led demand, renewed ETF inflows, and improving speculative positioning all contributing to a more constructive market structure. The sharp compression in Relative Unrealized Loss, alongside the stabilization of key on-chain profitability and liquidity metrics, suggests the February decline is increasingly being treated as a cyclical reset rather than the start of a deeper bear market regime.
At the same time, the character of this rally remains notably different from the aggressive expansions seen throughout 2023 to 2025. Capital inflows are recovering, but still remain well below prior breakout thresholds, while volatility compression and calmer derivatives positioning point toward a market that is rebuilding confidence gradually rather than entering a euphoric phase. This leaves the current advance looking more like a structurally supported recovery than a fully confirmed momentum breakout.
With Bitcoin now trading back into a dense overhead supply region between roughly $82K and $87K, the market is entering an increasingly important area for price discovery. A sustained hold above this zone would likely require stronger spot participation and deeper capital rotation to absorb remaining overhead supply. Until then, the broader structure continues to improve, but conviction still appears to be rebuilding rather than fully returned.
.
Disclaimer: This report does not provide any investment advice. All data is provided for informational and educational purposes only. No investment decision shall be based on the information provided here, and you are solely responsible for your own investment decisions.
Exchange balances presented are derived from Glassnode’s comprehensive database of address labels, which are amassed through both officially published exchange information and proprietary clustering algorithms. While we strive to ensure the utmost accuracy in representing exchange balances, it is important to note that these figures might not always encapsulate the entirety of an exchange’s reserves, particularly when exchanges refrain from disclosing their official addresses. We urge users to exercise caution and discretion when utilizing these metrics. Glassnode shall not be held responsible for any discrepancies or potential inaccuracies.