Glassnode has long been a reference for on-chain intelligence, used by professionals to map capital flows, holder behavior, and market regimes across crypto.
As digital asset markets mature and institutional capital scales in, a growing share of risk-taking is happening off-chain in derivatives. Options have become one of the primary drivers of price dynamics. With the addition of a competitive derivatives stack, we've now completed the picture: traders and investors can see who holds risk on-chain, and how that risk is priced and traded in options – all in one place.
In Q4 2025, we evolved Glassnode from an on-chain analytics provider into a full-stack derivatives analytics platform, setting out to become the reference provider of crypto derivatives intelligence with one of the industry’s most integrated product offerings.
Recent Expansion Highlights
- Tripled metric count: Expanded from 10 to 40 dedicated options metrics
- Asset coverage expanded: Now tracking BTC, ETH, SOL, XRP, and PAXG.
- New exchange integrations: Unified data from Deribit, OKX, and Bybit.
- New architectures: Introduced interpolated Delta IV, Premium/Taker-flow categories, and proprietary Glassnode indices.
Below, we highlight the suite of tools released in the second half of 2025, designed as a goldmine for both systematic and discretionary traders.
Insights from Trade Data: Follow the Money
In crypto, taker flow data is transparent. This allows us to separate call buyers from call sellers, and put buyers from put sellers, providing a clearer window into trade intent. Crypto options venues (e.g., Deribit) mark trades from the order-book aggressor's (taker's) perspective.
In crypto, taker flow data is transparent. This allows us to separate call buyers from call sellers, and put buyers from put sellers, providing a clearer window into trade intent. Crypto options venues (e.g., Deribit) mark trades from the order-book aggressor's (taker's) perspective.
By definition, a taker is willing to pay the spread to execute immediately instead of waiting for price improvement, which signals urgency. Taker flow captures this preference – whether to speculate or hedge – and therefore serves as a practical proxy for conviction.
Premium & Taker Flows – What are the intentions?
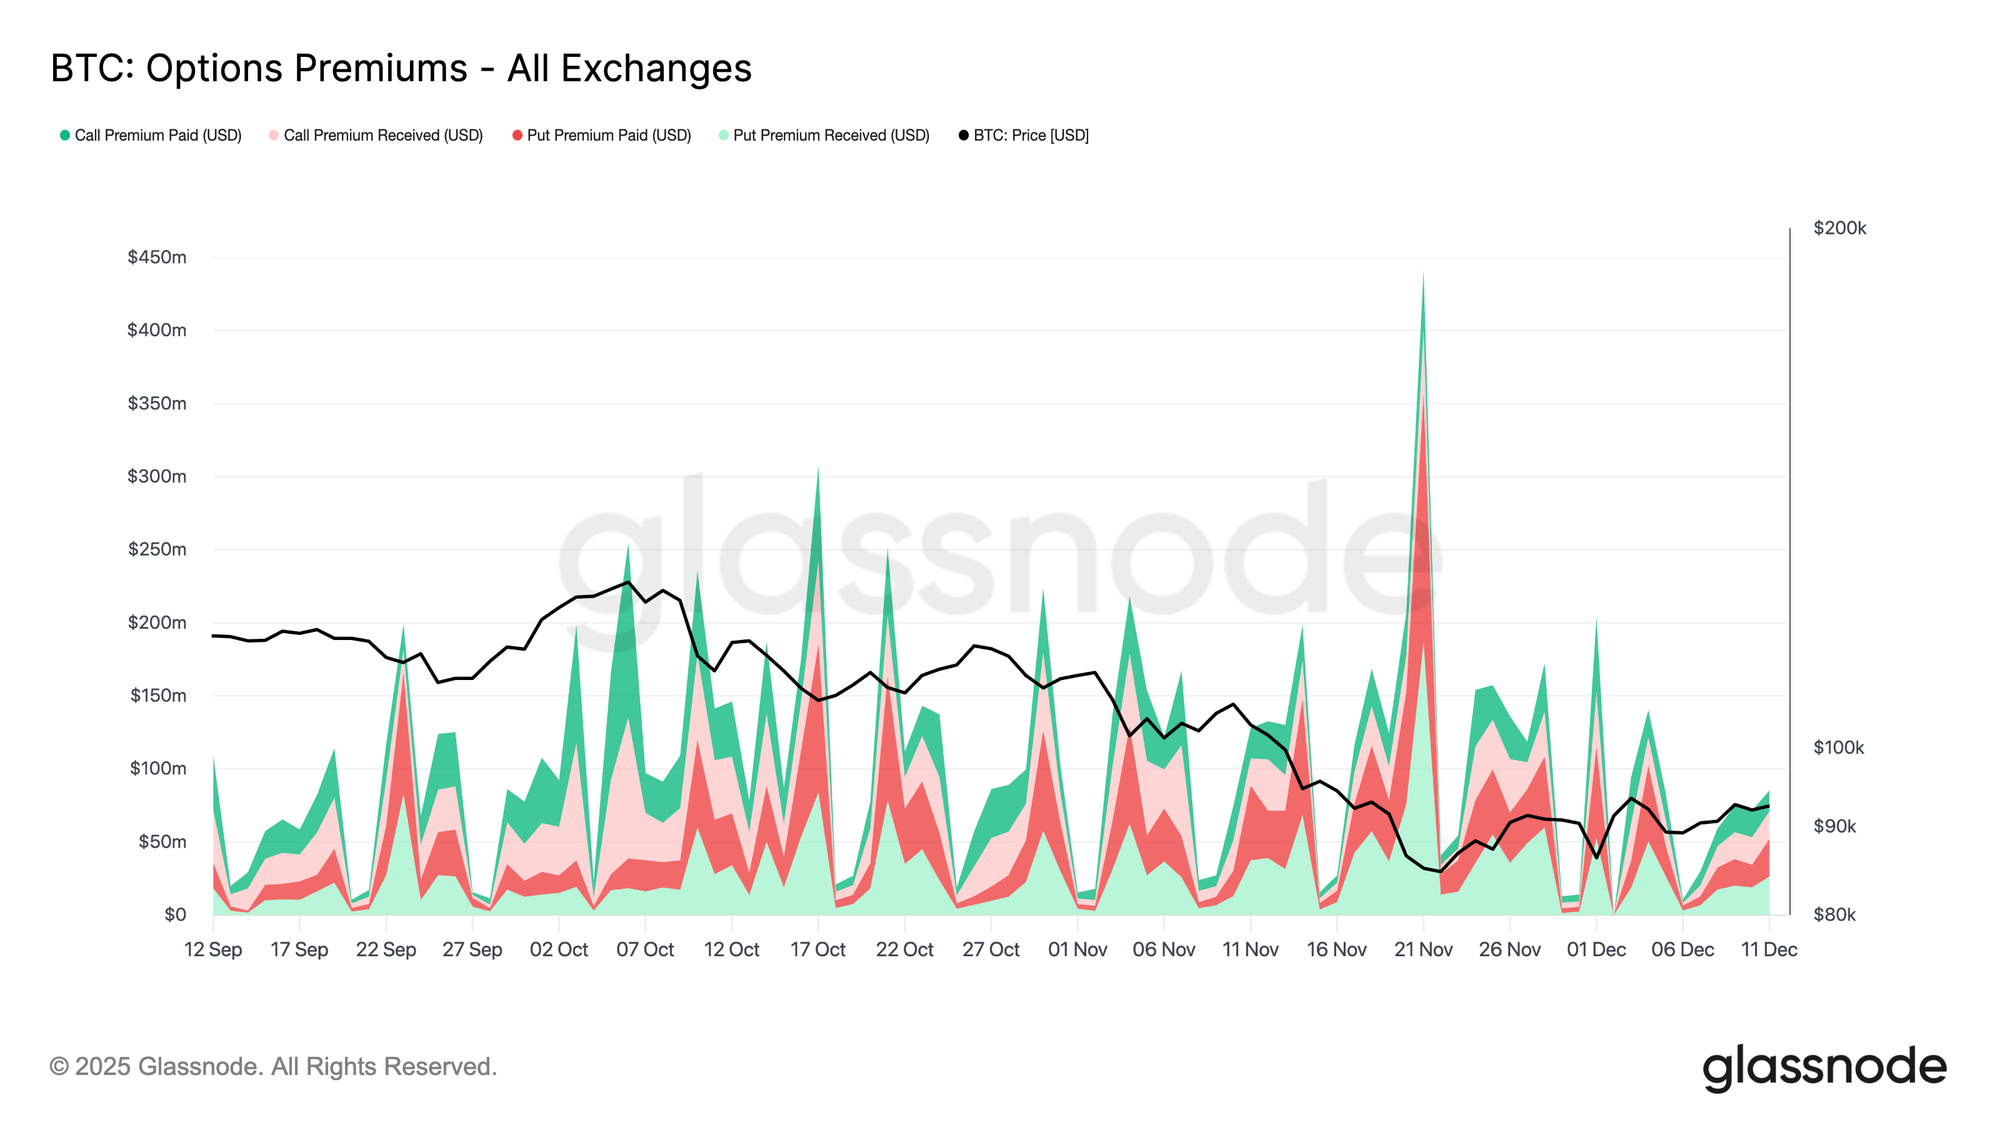
On Glassnode, we translate contracts and strikes in a single measure of conviction: Premiums. Premium is the amount of money spent (or received) to buy (or sell) an option.
Many traders still rely on traditional metrics like volume and open interest (OI) to gauge sentiment. However, these don’t tell the full story. For example, a large number of cheap, out-of-the-money options may show up as significant OI, yet represent very little capital in dollar terms – this alone doesn’t show conviction. Unlike trade count or contract size, premium represents actual capital at risk, a more objective read on conviction and P&L sensitivity.
Find our new range of premium and taker flow metrics in the Premium category New metrics:
- Options Premiums
- Bull-Bear Index
- Net Premium by strike
- Net Premium Heatmap
- Premium Weighted Median Strike
Actionable insights from Premium metrics:
- You can see when end-users are aggressively buying crash protection (buying puts), chasing upside (buying call), or quietly monetizing carry anticipating a rangy-market (selling call or puts).
- Identify strike-level magnets / cliffs via net premium by strike + heatmaps (where positioning is building)
- Separate “noise” from “conviction” by following premiums, not contracts.
Combo Strategies
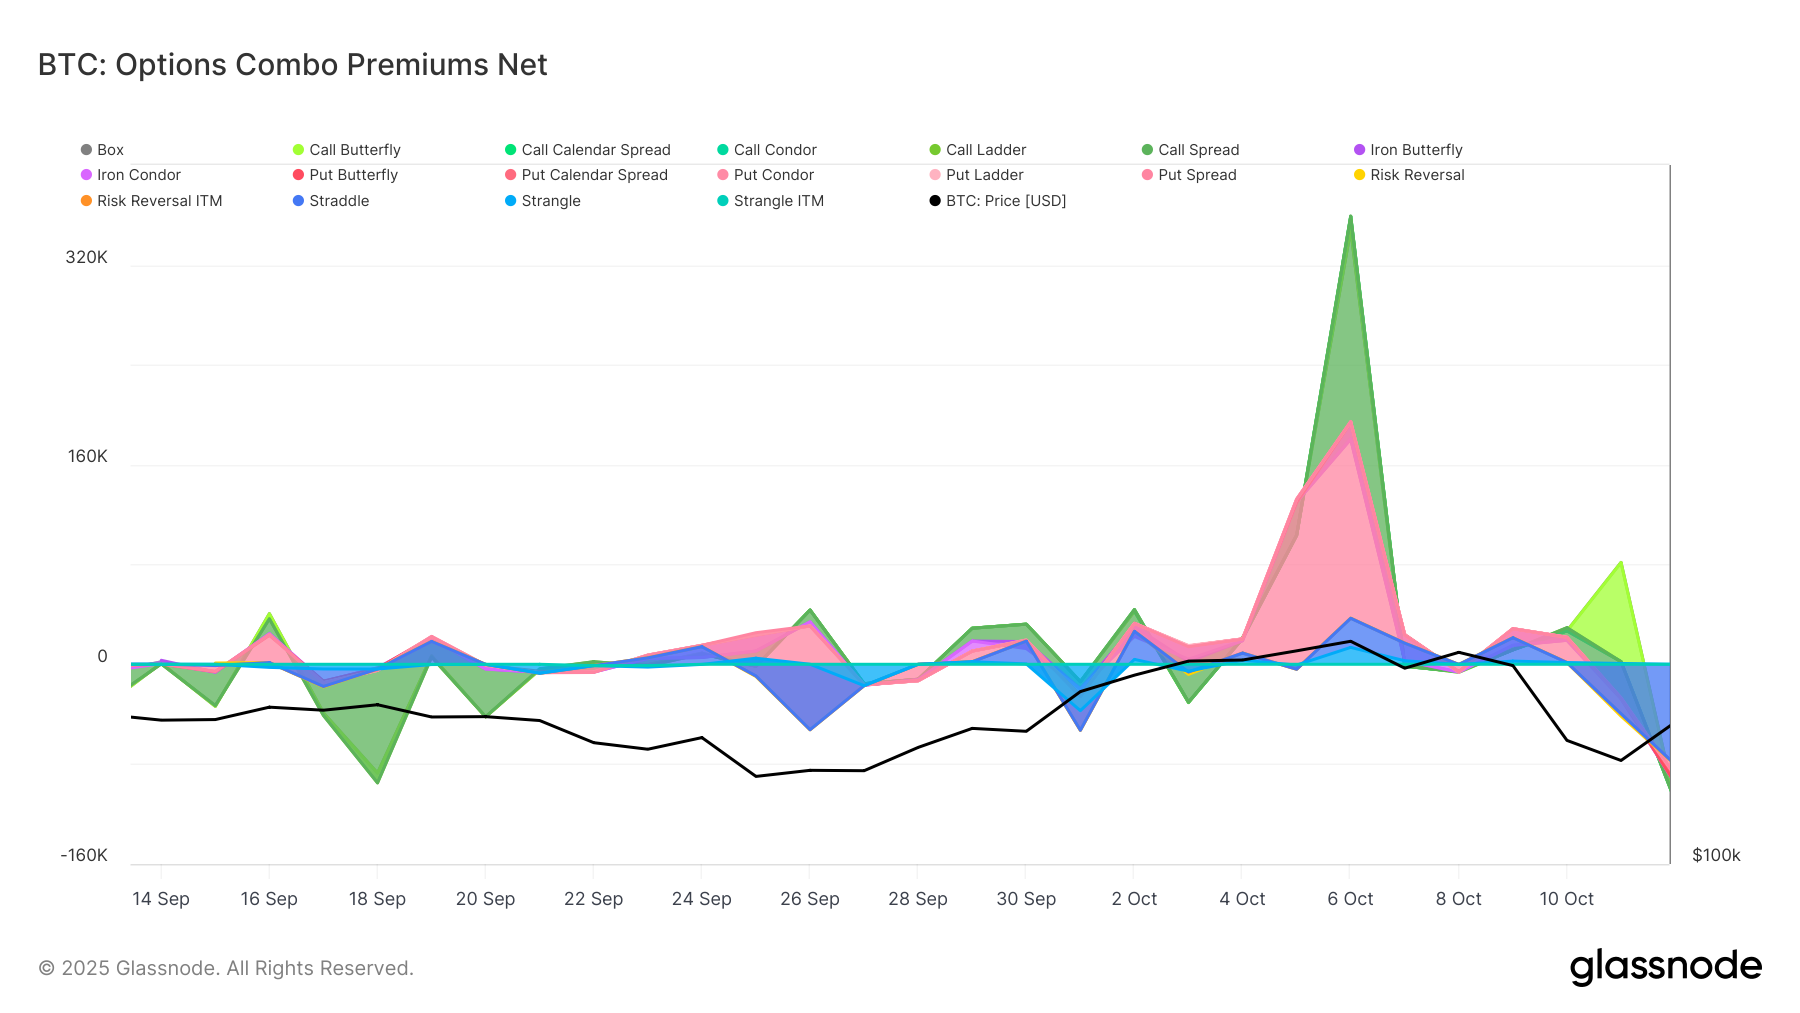
Combo strategies on Deribit let us see beyond raw option-by-option flow, which often blends everything together and can mislead. A trade that looks like “one call bought, one call sold” might actually be a single taker buying a strangle, i.e. a pure volatility bet that’s direction-agnostic.
By reconstructing multi-leg trades into canonical strategies (straddles, strangles, spreads, condors, ladders, etc.), we track net premium for the whole structure, not each leg in isolation. This view highlights where traders are paying up for volatility, harvesting carry, or running structured hedges across maturities and assets, giving a much clearer read on the intent behind options flows.
New metrics available:
- Options Combo Premiums Buyers
- Options Combo Premiums Sellers
- Options Combo Premiums Net
Actionable insight from Combo Premium metrics:
- Isolate intent: Distinguish between a directional bet (e.g., Call Spread) and a pure volatility bet (e.g., Straddle/Strangle).
Volume: More Breakdowns Added
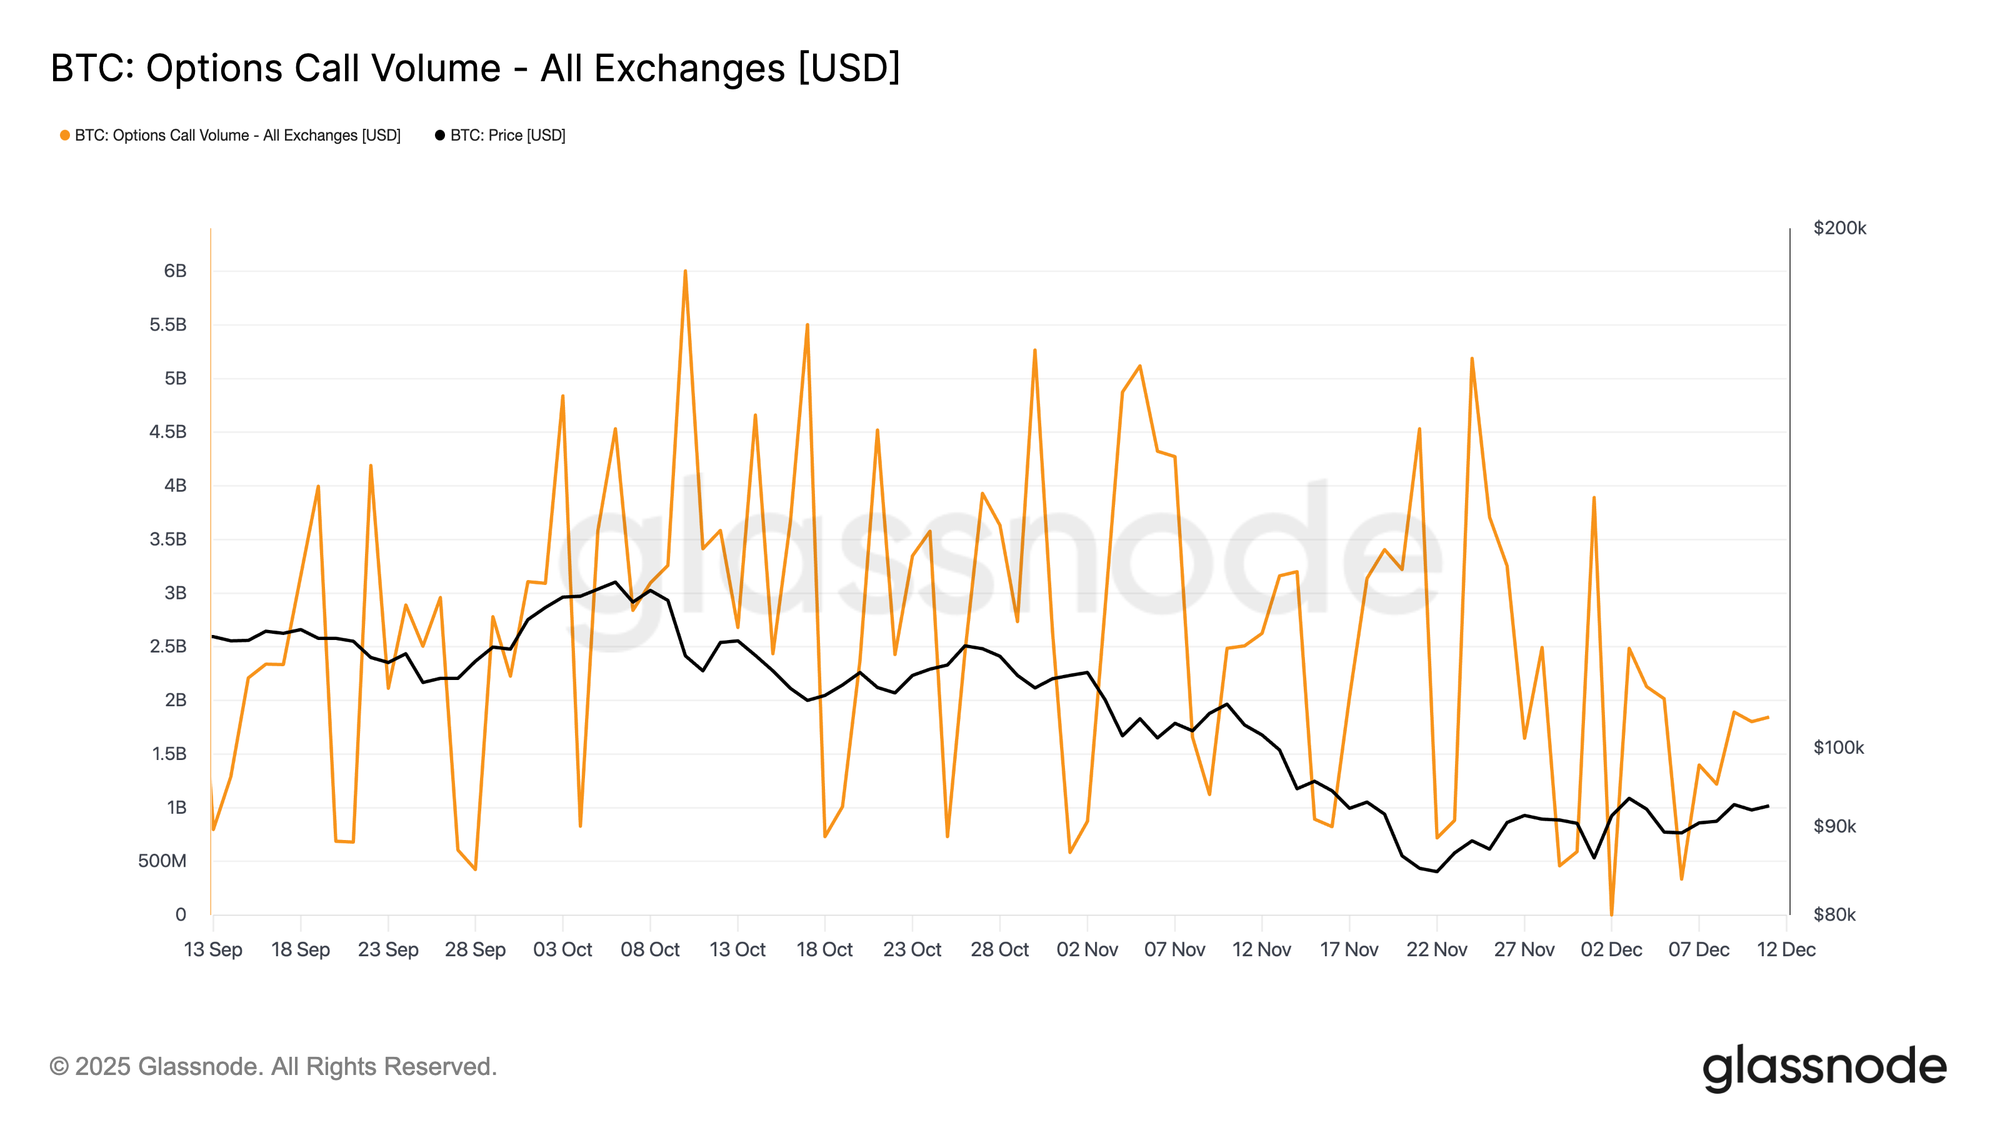
In our legacy options offering, we previously only offered the 24h Volume, and the Put Call Volume. Our expanded suite now utilizes taker flow conventions to offer granular breakdowns. We identify the aggressor side to determine market direction.
Now we have the possibility to distinguish between:
- Volume Buy (betting on increase of volatility, either buying call or buying put)
- Volume Sell (betting on decrease of volatility, either selling call or selling put)
- Volume Call (Either buying call options or selling call options)
- Volume Put (Either buying put options or selling put options)
- Volume Breakdowns (offer all the different combinations from above under a single API call)
Actionable insight from Volume metrics:
- Signal vs. Noise: Differentiate between Volume Buy (betting on volatility increase/long gamma) and Volume Sell (betting on volatility decrease/short gamma).
Max Pain – Position Gravity Around Expiry
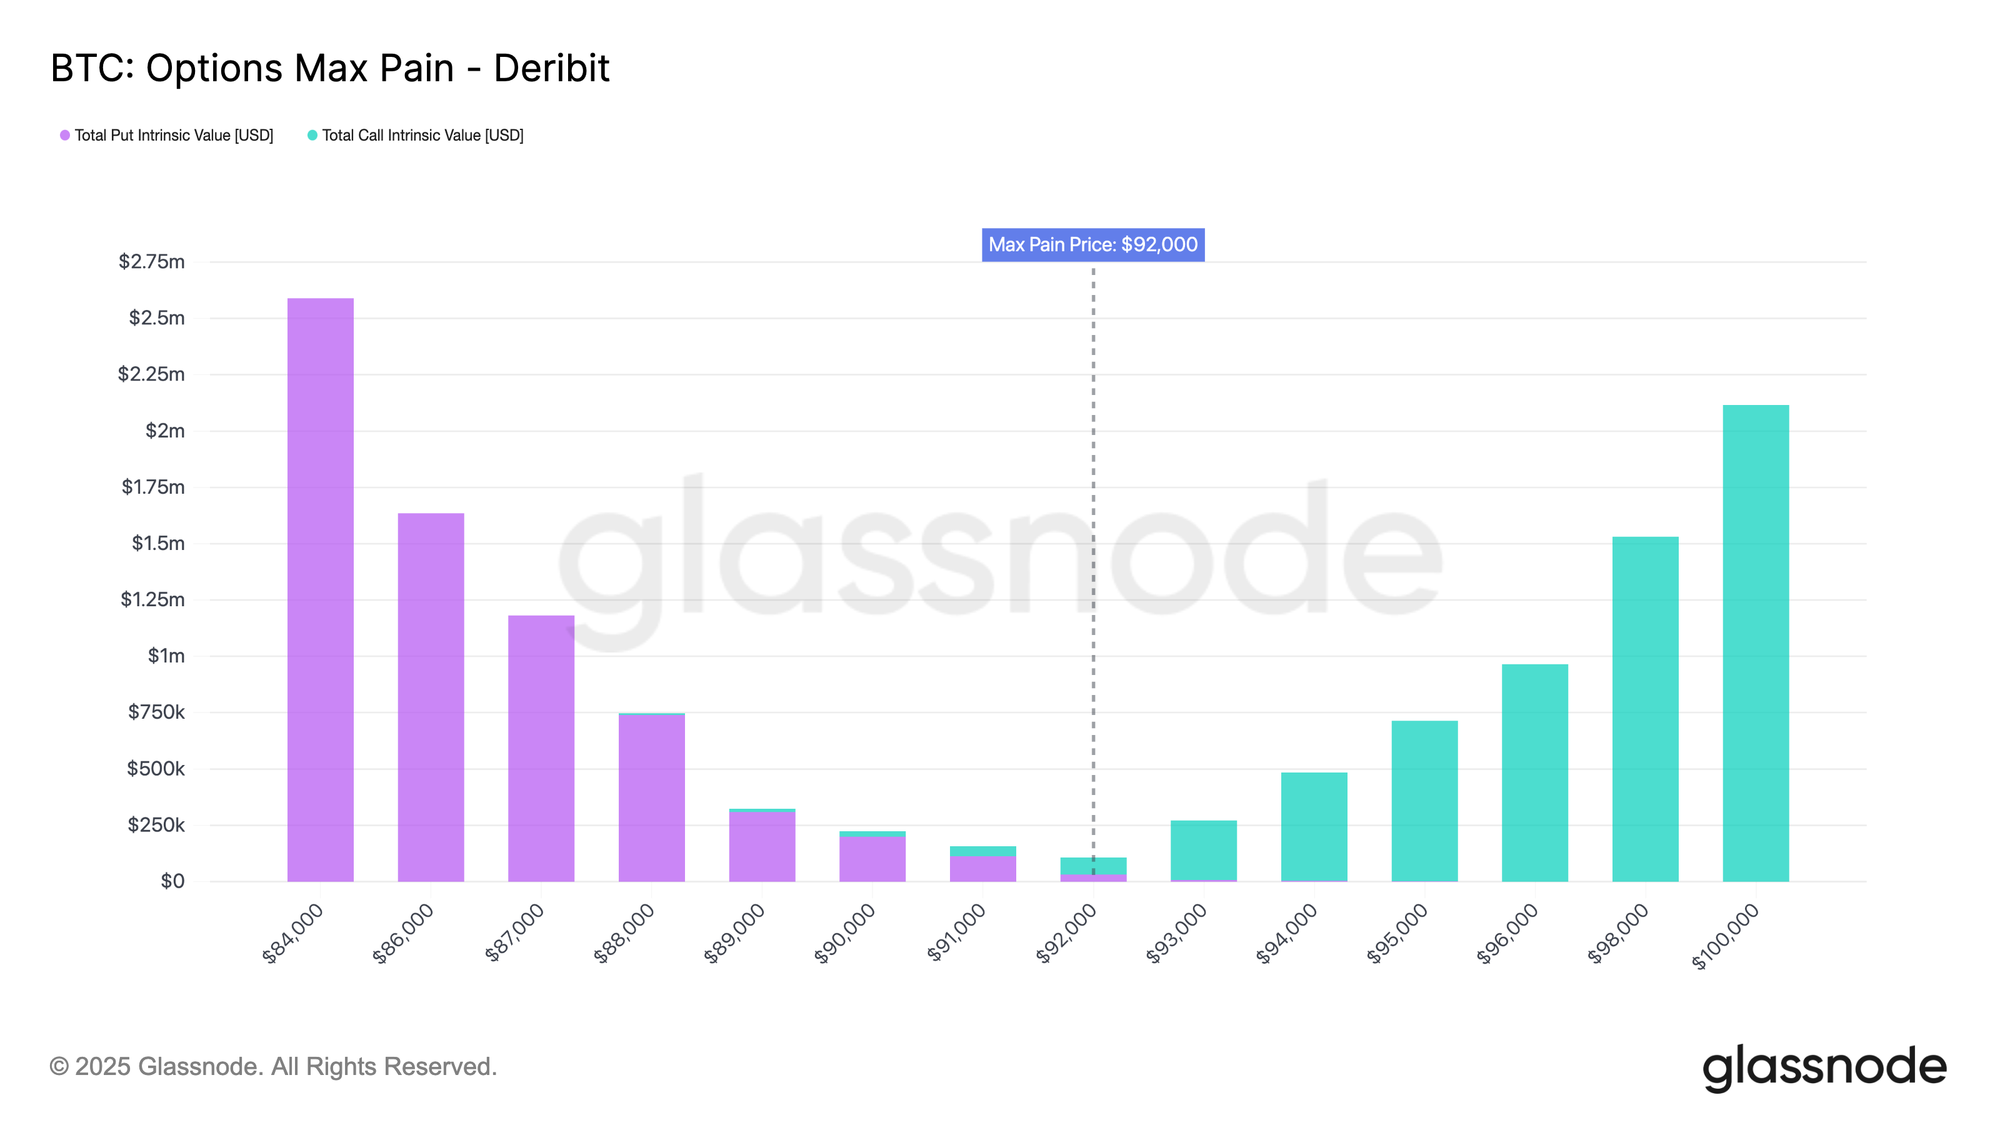
Max Pain is the settlement price at expiry that minimizes the total intrinsic value (payout) of all outstanding options (calls + puts) for a given maturity, based on current open interest. For each maturity, we evaluate candidate settlement prices and compute the aggregate intrinsic value across all strikes; the price with the lowest total payout is the max pain level. Traders use this as a positioning-based reference for potential pinning near expiration, though it is heuristic and depends on how open interest is held/hedged.
New metric on Studio:
- Max Pain
Actionable insight from Max Pain metric:
- In range-bound markets, price often gravitates toward the Max Pain price as dealers hedge delta near expiry.
Implied Volatility (IV)
For traders, IV is the definitive measure of whether risk is "cheap" or "expensive." By analyzing the volatility surface, you can stop betting solely on price direction and start trading the market's expectations—identifying moments where fear is overpriced (selling opportunities) or complacency is dangerous (buying opportunities).
Full-resolution Granular IV by Delta
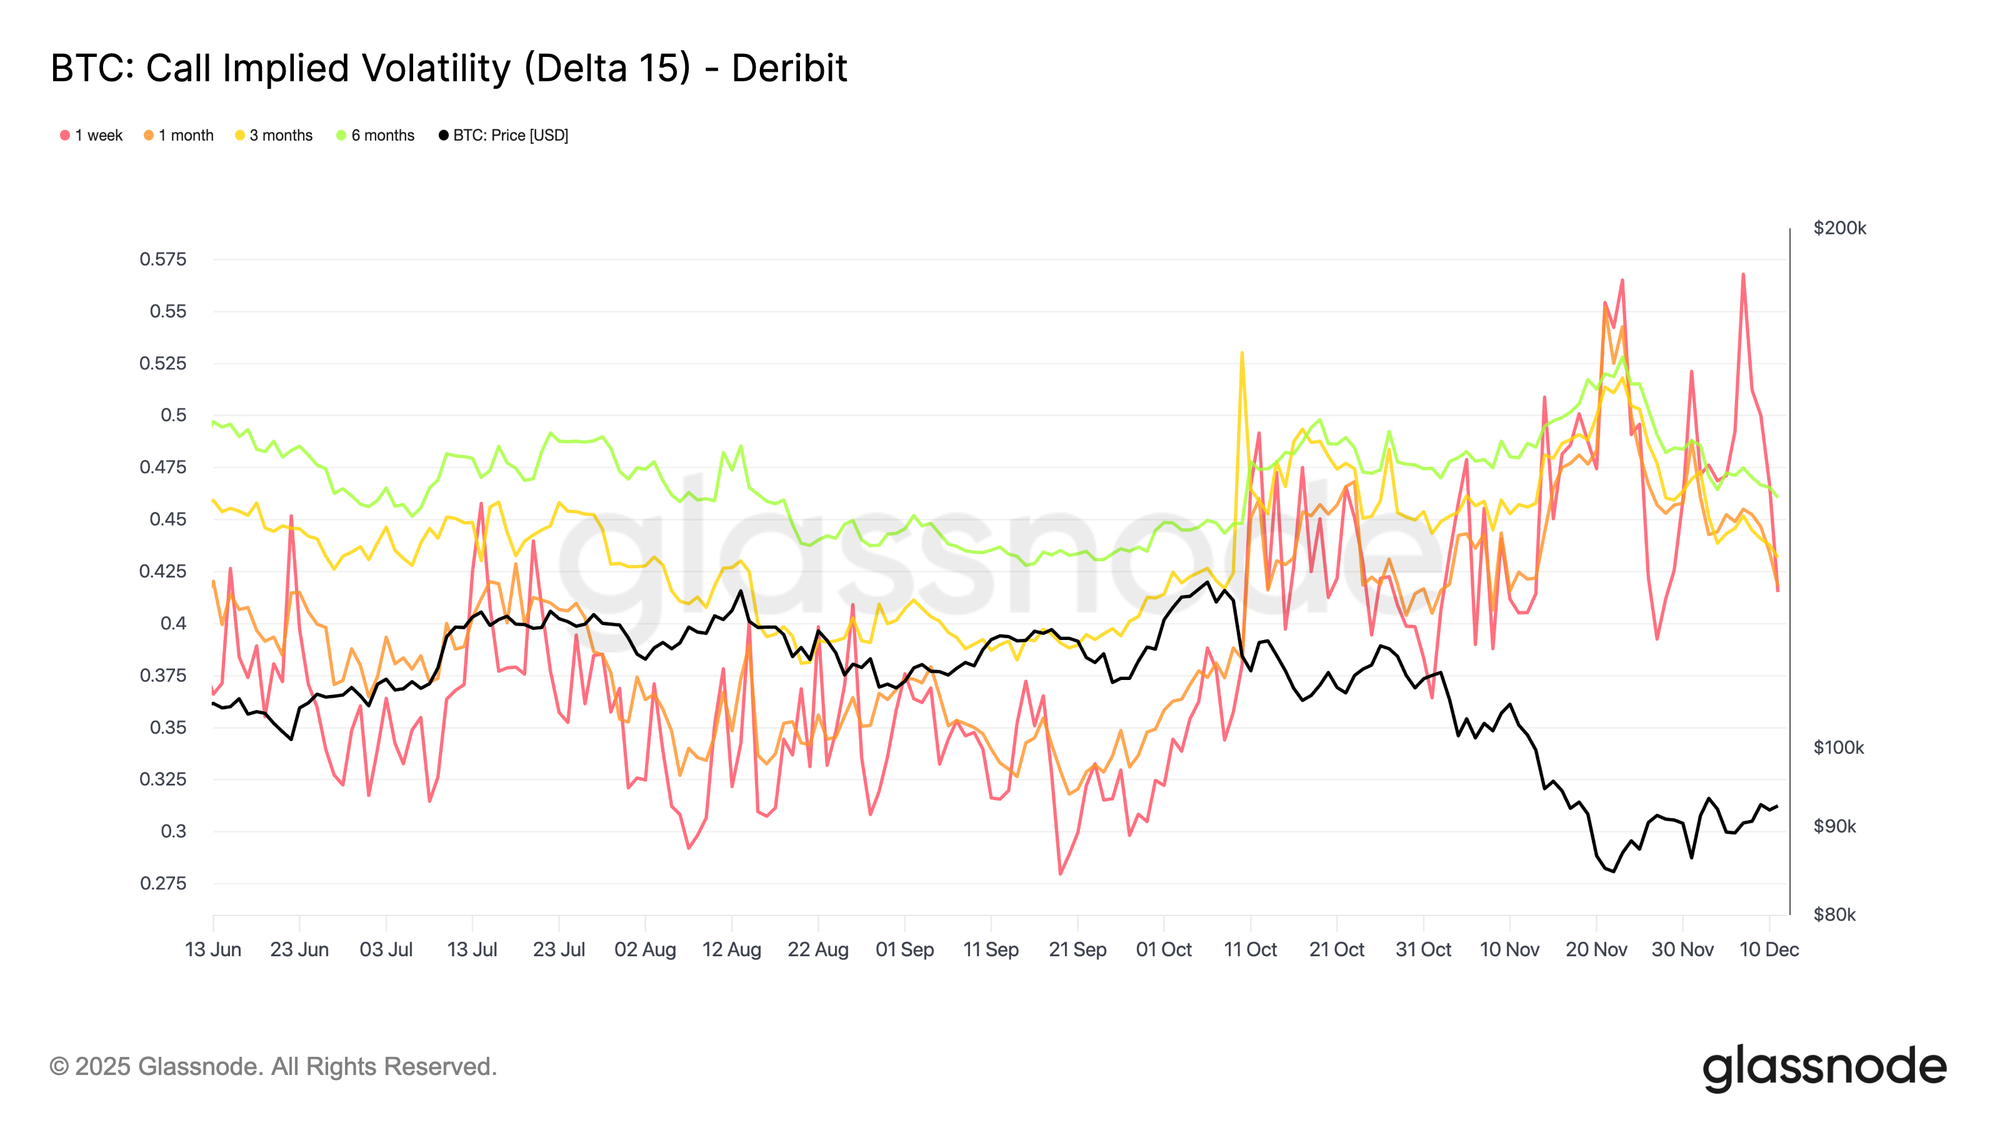
Previously we only provide the 25 delta skew as a whole, without the individual leg (25 Delta Call and Put). Our new interpolated IV grid provides call and put IV across multiple deltas (5D, 10D, 15D, 20D, 25D, 50D) and standard tenors (1w, 1m, 3m, 6m) for BTC and ETH to SOL, XRP, PAXG. This lets you zoom into specific risk zones – crash insurance at 10D puts, squeeze tails at 5D calls, or the core smile around 50D – and compare them cleanly across assets and over time.
We provide a clean, ready-to-use volatility surface for proprietary pricing models and backtesting.
- All metric combinations are available under Charts, in the Options category “Interpolated IV” in Studio.
Actionable insights from IV metrics:
- Spot speculative demand: A sharp rise in 5D Call Skew signals extreme demand for cheap, deep OTM "lottery tickets."
- Identify cross-asset opportunities: Standardized delta buckets also help reveal shifts in relative demand. For example, if SOL 25D Call IV is rising while BTC 25D Call IV remains stable, the interpolated series makes that divergence easy to detect and quantify, which may signal rotation toward higher-beta assets or a change in market expectations for altcoin volatility.
- Monitor term structure: The normalized tenors (1-week to 6-months) let you observe how the market is pricing short-term stress versus longer-term repricing.
Multiple Skew Flavors: Tail, ATM and Term-Structure Views
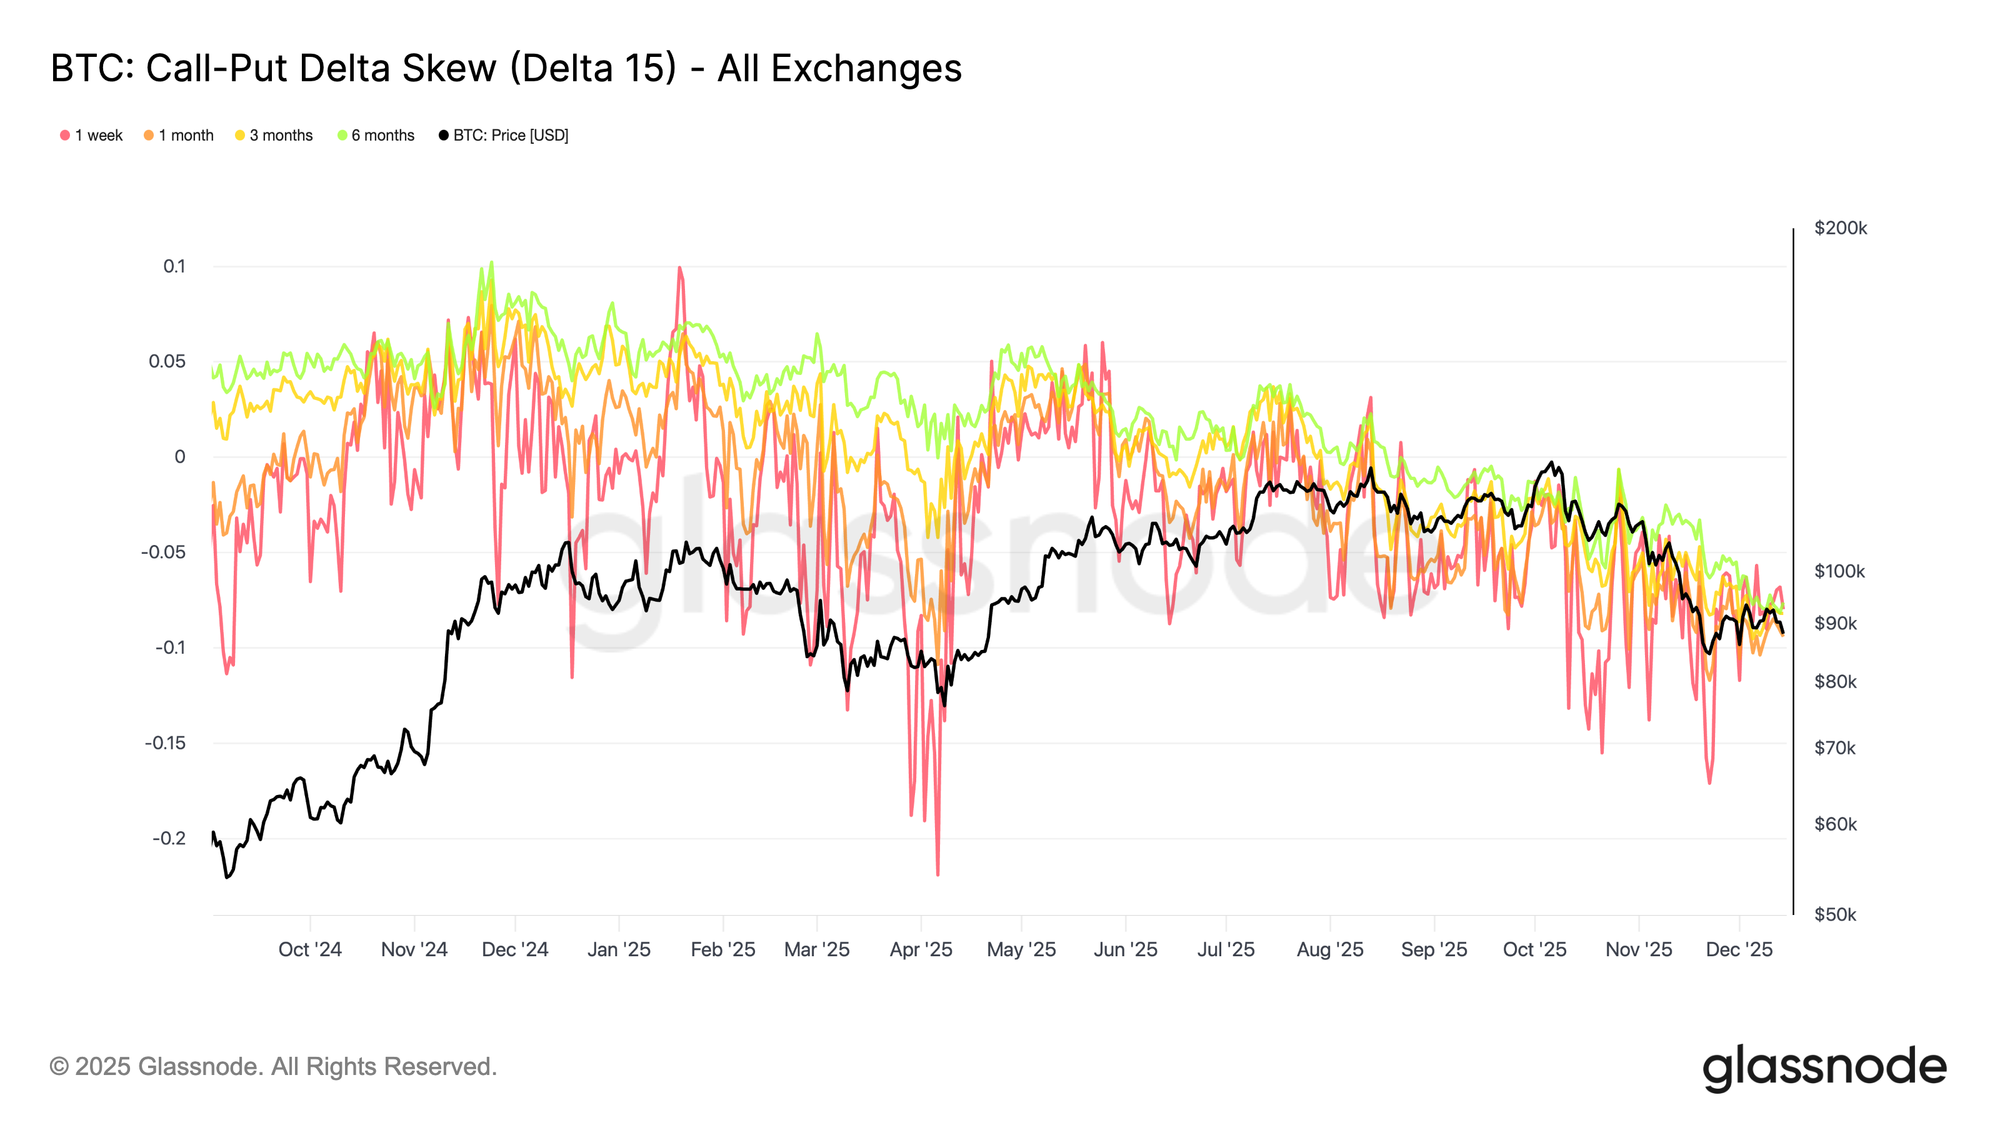
Beyond the classic 25 Delta Skew, we provide different skew cuts: deep-tail skew (e.g. 5D, 10D vs 20D), and term-structure skew across 7d, 30d, 90d, 180d tenors.
This lets you distinguish between “panic in the tails,” orderly repricing around ATM, or slow shifts in long-dated protection. With these variants, you can tell whether the market is hedging crash risk, positioning for a squeeze, or quietly changing its long-term view on an asset – now fully connected to what you already know from our on-chain data.
- All metric combinations are available under Charts, in the Options category “Delta Skew” in Studio.
Actionable Insights from Skew metrics:
- Gauge consensus sentiment: Use the Delta Skew as your "Fear and Greed" barometer. A positive skew indicates the market is paying a premium for upside calls (Bullish sentiment), while a negative skew shows a rush for downside put protection (Bearish sentiment).
- Watch for historical extremes. When skew reaches a stretched positive level (excessive euphoria), it often marks a local top. Conversely, deep negative skew often signals a capitulation bottom where Puts are overpriced, offering a buying opportunity.
Glassnode Skew Index: Asymmetry in a Single Measure
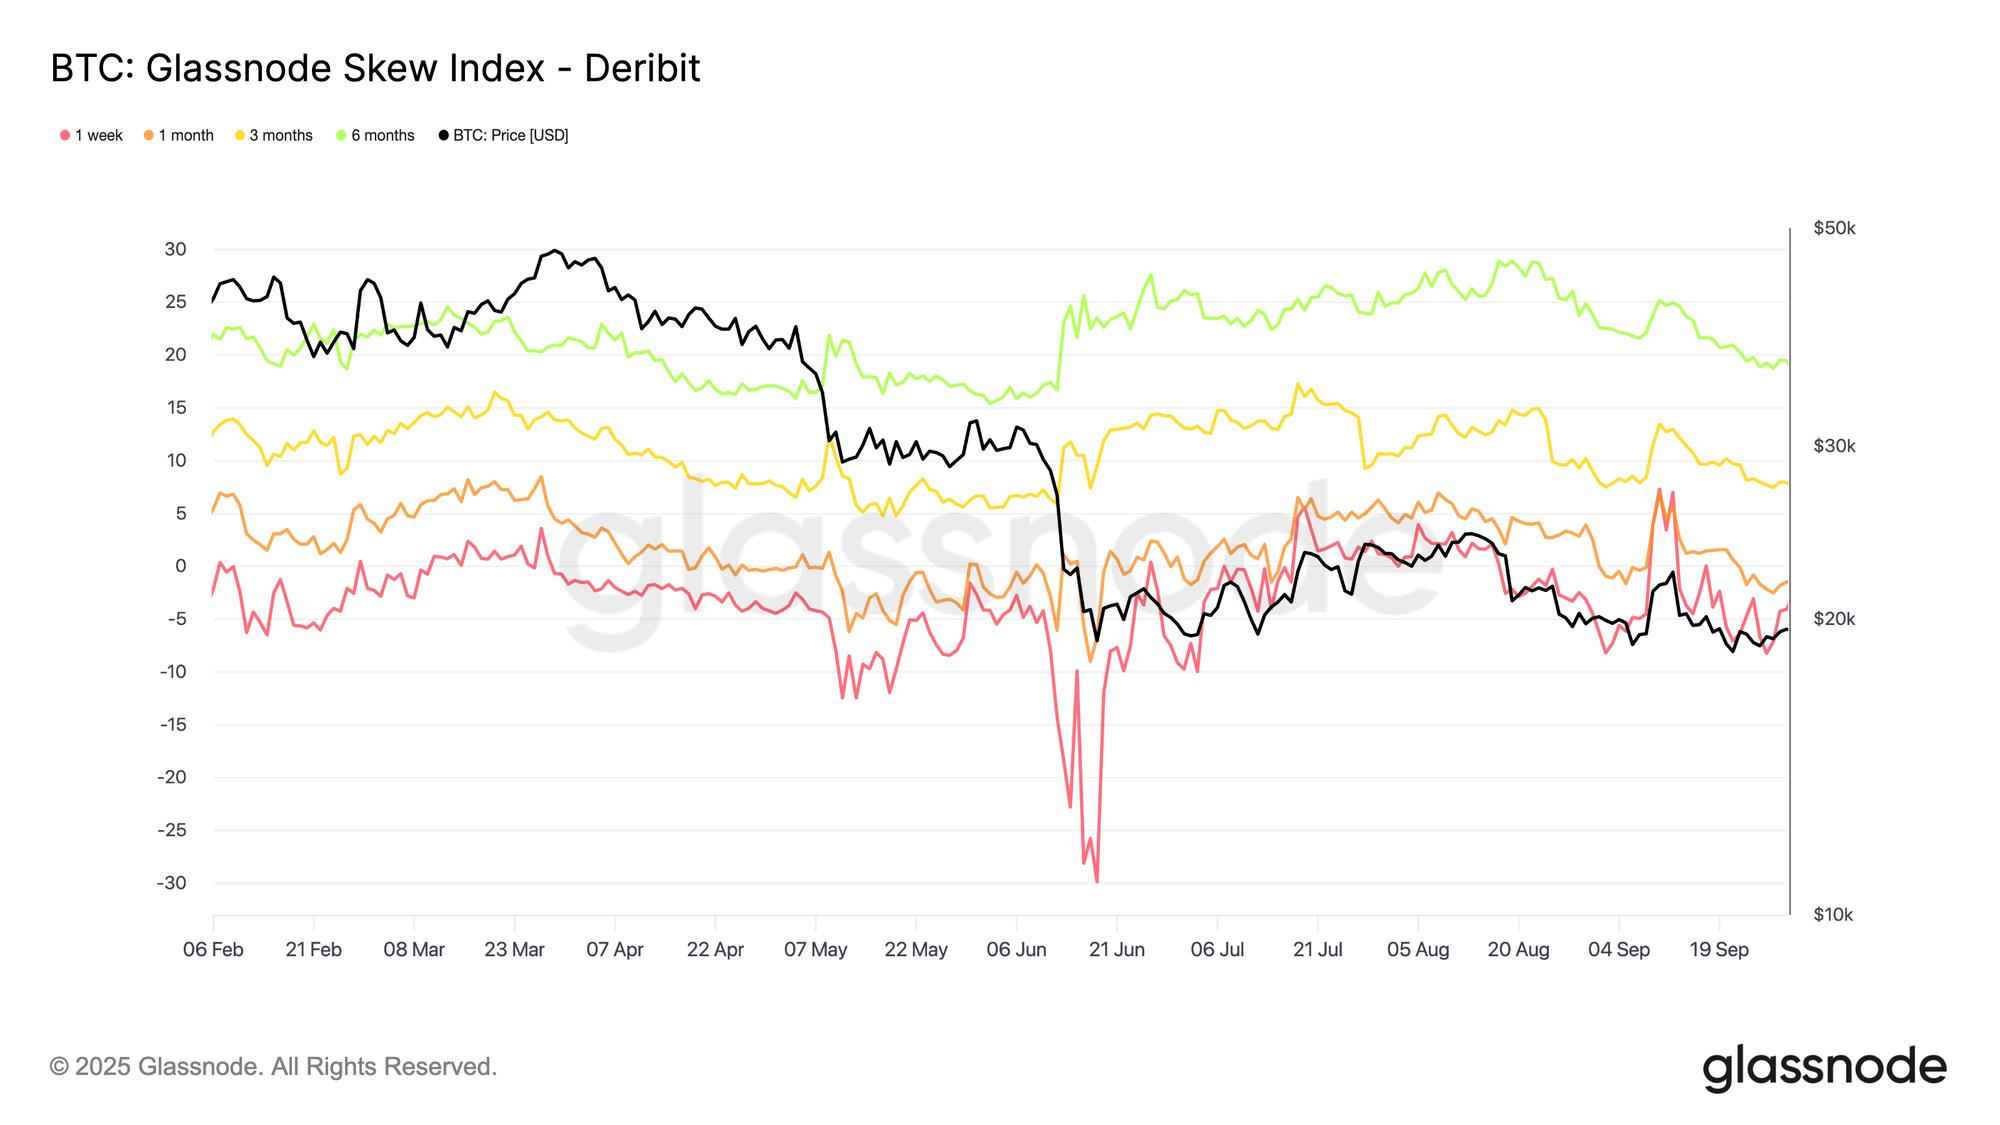
Traditional 25-delta skew looks at only two points on the volatility curve. The Glassnode Skew Index goes further by integrating the full smile through UpVol (upside volatility) and DownVol (downside volatility). Positive values mean the market is paying more for upside tails; negative values show a preference for downside protection.
Normalized across assets, tenors, and venues, the Skew Index gives you a clean, comparable gauge of option-market fear vs. greed you can track, overlay with price and flows, or plug straight into systematic strategies.
New metrics available now:
- Glassnode Skew Index
- Glassnode Skew Index Ratio
- Upside IV
- Downside IV
Actionable insights from Glassnode Skew Index metrics:
- Spot “risk-on/off” asymmetry: Because the Skew Index integrates the full smile (UpVol vs DownVol), a move can come from broad wing repricing (many deltas moving) rather than just two single points like the 25D Skew.
- Diagnose where the repricing lives using Upside IV and Downside IV legs:
- Skew Index up because Upside IV rises → upside tail getting bid (squeeze/convex upside demand).
- Skew Index up because Downside IV falls → downside protection being unwound (risk-on / carry re-entering).
- Track tenor divergence: if 1W Skew Index dives negative while 3M/6M stays stable or rises, that’s typically short-term stress/catalyst hedging rather than long-term bearish repricing.
IV Heatmaps
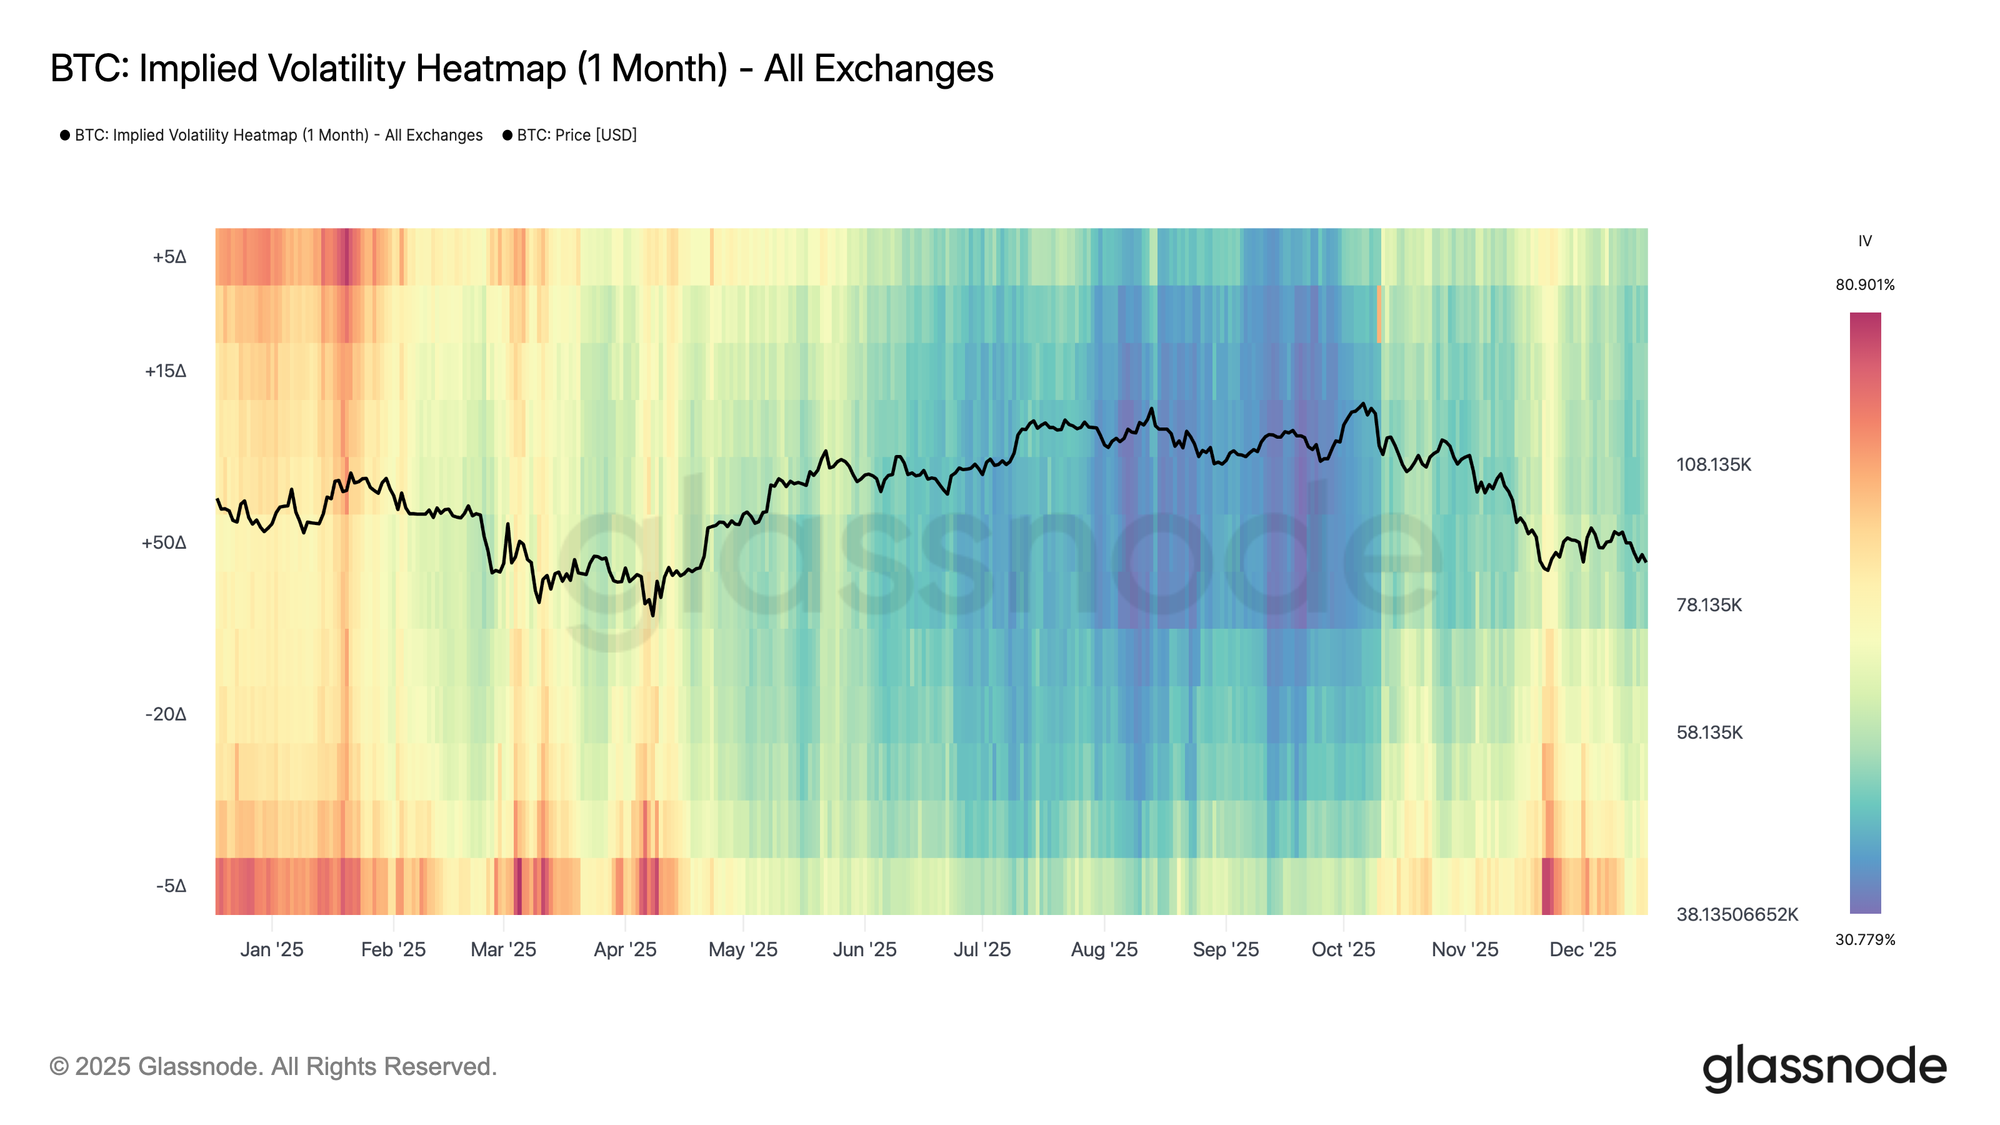
For a broader, single-view perspective, we also offer IV heatmaps that display the full implied volatility surface in one chart. The vertical axis represents option delta, with positive values corresponding to call options and negative values to put options, allowing for a direct comparison of upside and downside volatility across deltas and tenors. This makes it easy to spot skew asymmetries, tail-risk pricing, and relative volatility dislocations at a glance.
New metrics available now:
- Implied Volatility Heatmap (1 Week)
- Implied Volatility Heatmap (1 Month)
- Implied Volatility Heatmap (3 Months)
- Implied Volatility Heatmap (6 Months)
Actionable insights from the IV Heatmaps:
- Elevated IV at low-delta puts (−10D to −5D) indicates heavy demand for downside protection. When this persists without follow-through in price, it often signals fear saturation, increasing the odds of subsequent volatility compression and favoring selling downside tail risk or put spreads.
- A simultaneous pickup in IV on both low-delta calls (+5D to +10D) and puts reflects two-sided uncertainty rather than directional conviction. These regimes tend to precede larger price moves, making long-volatility structures (e.g. straddles or wide strangles) more attractive than directional bets.
Greeks
Greeks describe how option prices and positions respond to changes in underlying variables such as price, volatility, and time. Traders often use Greeks at the position level for risk management. In crypto, where dealer hedging flows are large relative to market depth, aggregated Greeks across the full options market help identify when options market structure is likely to stabilize price or amplify volatility.
Gamma Exposure: Mapping the Hedging Feedback Loops
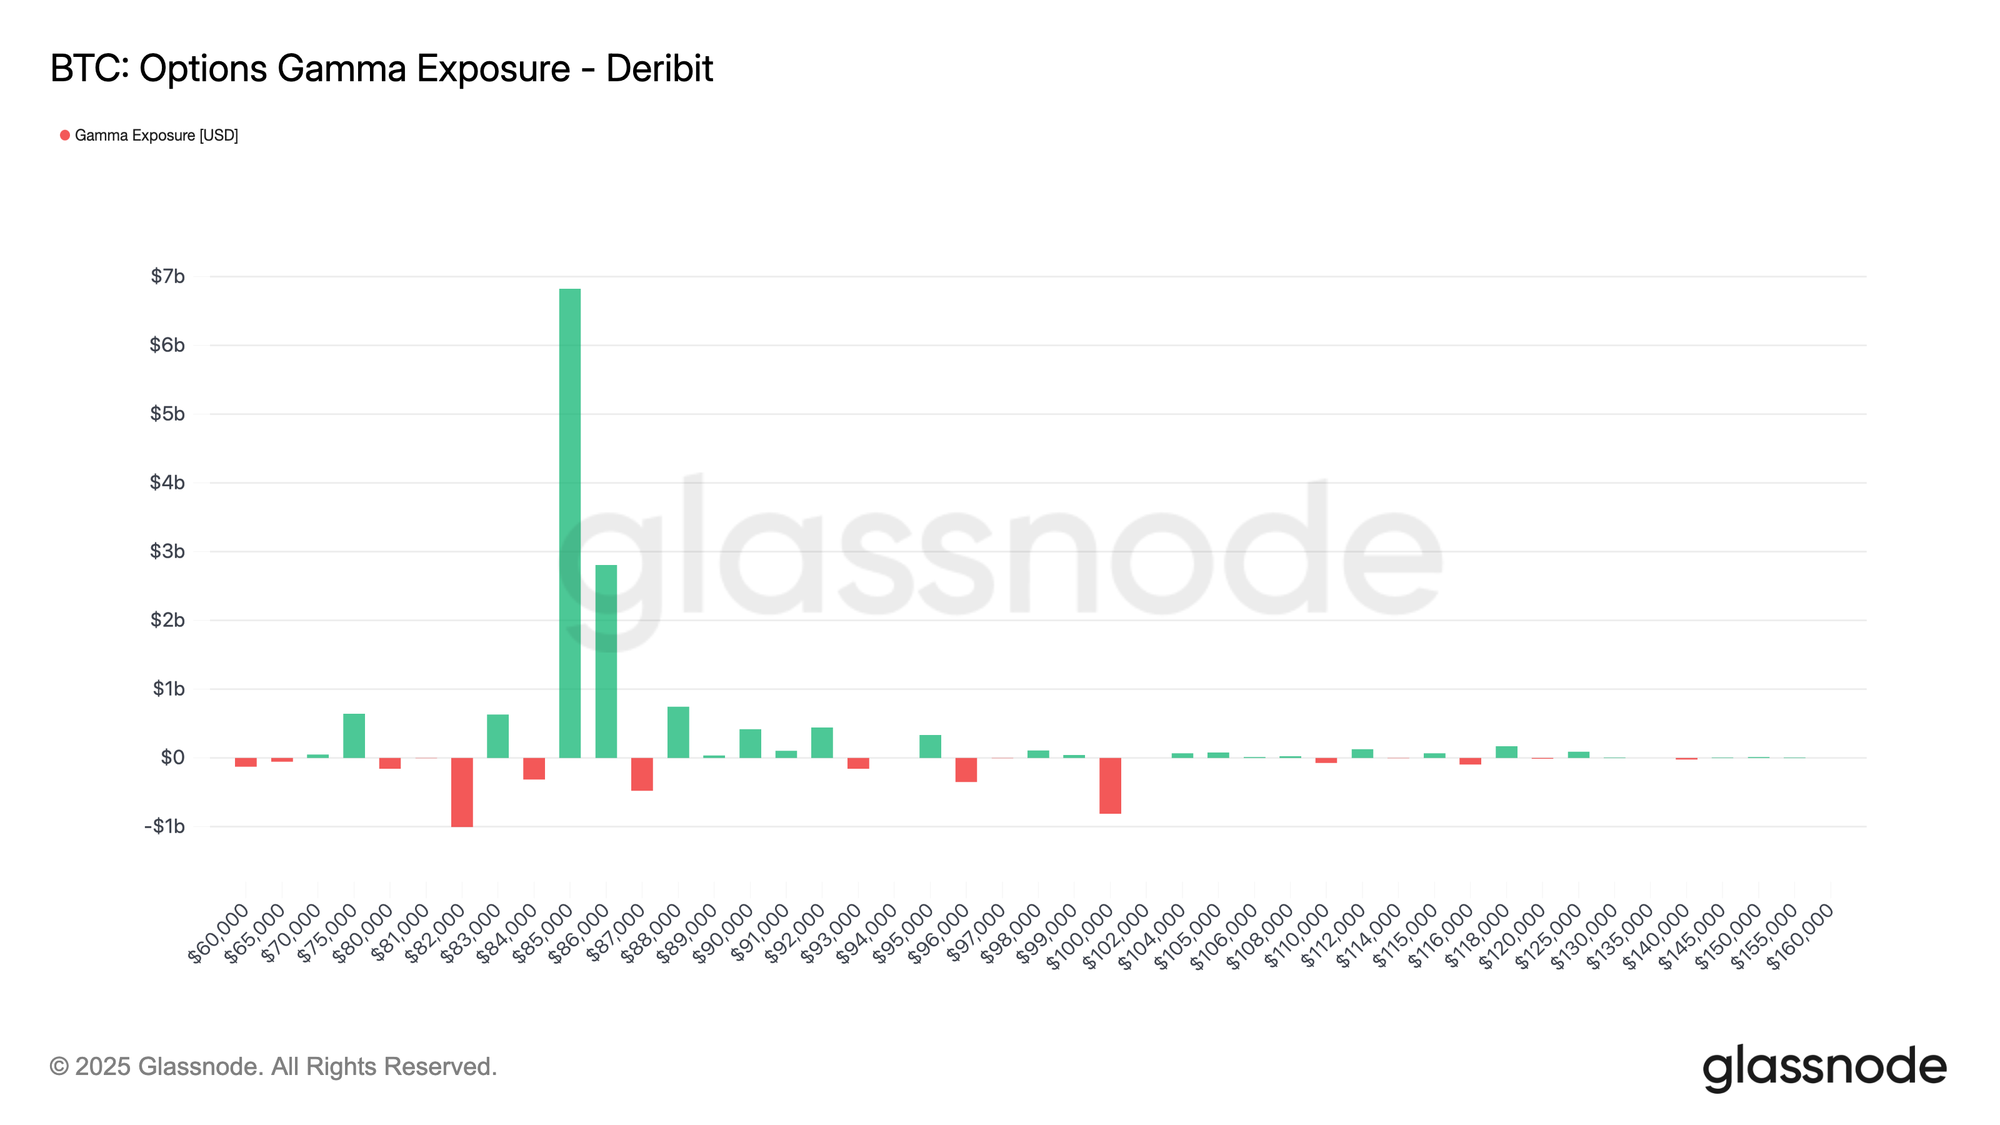
Gamma Exposure (GEX) measures how option market-makers’ hedging flows react to movements in the underlying asset.
Market makers, who typically maintain delta-neutral positions, must continuously hedge their gamma exposure by buying or selling futures/spot to offset the delta of the options they’ve sold or bought. When price moves, option deltas change (that’s gamma), forcing dealers to rebalance, creating structural feedback loops in the market. It's a source of one of the most significant structural flows in the equity markets
At the core, the taker is the end user — a trader or investor buying or selling options — while the dealer (or market-maker) is the counterparty providing liquidity. Their positions are mirror images of each other: when the taker buys a call, the dealer sells it.
New metrics:
- Options Gamma Exposure
Actionable insights from Gamma Exposure metrics:
- At price levels with high positive gamma, dealers hedge in a way that tends to absorb price shocks, i.e. they tend to dampen volatility — they buy on dips and sell on rallies, keeping prices pinned near those strikes (so-called “gamma gravity” or “pinning” effects).
- At price levels with high negative gamma, dealers’ hedging flows amplify price moves: they sell when prices fall and buy when they rise, often increasing short-term volatility.
- For directional traders, monitoring where the sign of GEX changes helps anticipate regime shifts from quiet to volatile markets (and vice versa).
We remain focused on expanding Glassnode’s derivatives offering in breadth and resolution. Our roadmap is centered on deeper market structure analytics, broader asset and venue coverage, and further integration between on-chain positioning and derivatives risk.
If your team has custom options data needs, speak with our institutional team to discuss how Glassnode can support your strategy.
- Follow us on X for timely market updates and analysis
- Join our Telegram channel for regular market insights
- For on-chain metrics, dashboards, and alerts, visit Glassnode Studio
Disclaimer: This report is for informational and educational purposes only. The analysis represents a limited case study with significant constraints and should not be interpreted as investment advice or definitive trading signals. Past performance patterns do not guarantee future results. Always conduct thorough due diligence and consider multiple factors before making investment decisions.






