Popular Analyst Says If Bitcoin Doesn’t Hold This Level, This Is Where To Start Buying

bitcoinist2026-06-03 tarihinde yayınlandı2026-06-03 tarihinde güncellendi

Özet

Popular crypto analyst CryptoMichNL highlights two key scenarios for Bitcoin. The current focus is on the critical support zone of $71,000-$73,000. Holding this level is essential to maintain the bullish structure and could pave the way for a push toward resistance at $76,600 and beyond. If this support fails, the analyst identifies a major buying opportunity in a lower accumulation range of $61,000-$65,000, aligning with historical support and the 200-day moving average. The market's next major move hinges on its reaction to these two thresholds.

Bitcoin is sitting at a make-or-break zone, according to market analyst CryptoMichNL, who recently outlined two key price areas that could determine the asset’s next major move. While he believes the broader bullish structure remains intact, he also identified a lower range where investors may find what he considers one of the most attractive buying opportunities of the current cycle if support fails.

Bitcoin’s Most Important Support Zone

The analyst’s outlook centers on the region around $71,000 to $73,000, which he described as the level that must remain intact to prevent a deeper pullback. His accompanying chart highlights this area as a critical support block, positioned above a broader uptrend line that has guided Bitcoin’s recovery following the sharp correction seen earlier in the year.

According to the chart, the current market structure differs significantly from the breakdown that occurred in February. At that time, a previously established resistance level failed to transition into support, resulting in a rapid loss of momentum and a steep decline. This time, however, the analyst argues that the market is attempting to defend a former resistance zone as support, a development that could preserve the larger bullish framework.

Source: X

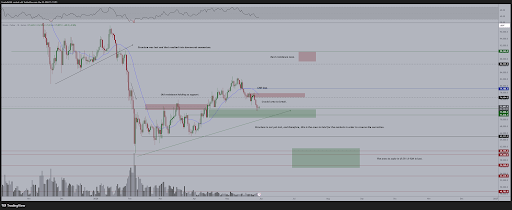
The chart also marks a “crucial area to break” near $76,600. Bitcoin recently retreated from that region after encountering resistance, leaving it as the next major hurdle for bulls. Just above it sits a Chicago Mercantile Exchange (CME) gap around $79,000, followed by another resistance cluster near the upper-$80,000 range.

According to the analyst, holding support is only the first step. A successful defense of the $71,000 area would keep the broader structure intact and increase the probability of another advance toward those overhead targets. In that scenario, Bitcoin could regain momentum and position itself for a push toward fresh cycle highs.

Where To Buy If Bitcoin Breaks Down

While the analyst remains constructive on the market, he also mapped out a contingency plan in case support gives way. If Bitcoin loses the $71,000-$73,000 region, his chart points to a significantly lower accumulation zone between roughly $61,000 and $65,000.

That area is notable for several reasons. It aligns with historical support levels established during previous consolidation phases and sits close to the 200-day moving average, a long-term trend indicator closely watched by institutional and retail participants alike. The analyst suggested that a decline into that region would represent an exceptional opportunity to buy in.

For now, the market’s attention remains fixed on two levels. The first is the defense of support near $71,000. The second is a decisive breakout above $76,600. How Bitcoin reacts around those thresholds could determine whether the next chapter brings a renewed surge toward record highs or a final opportunity for buyers to accumulate at significantly lower prices between the $61,000-$65,000 region.

BTC bears crash price | Source: BTCUSD on TradingView.com

İlgili Sorular

QAccording to analyst CryptoMichNL, what are the two key Bitcoin price zones that could determine its next major move?

AThe first is the critical support zone between $71,000 and $73,000 that must hold. The second is the resistance area near $76,600 that Bitcoin needs to break above for another advance.

QWhat is the significance of the support zone around $71,000 to $73,000 for Bitcoin's market structure?

AThis zone is described as the most important support level. Holding this area is crucial to prevent a deeper pullback and to keep the broader bullish structure intact. It represents a former resistance zone now being defended as support.

QIf Bitcoin fails to hold the $71,000-$73,000 support, where does the analyst suggest is an attractive buying opportunity?

AIf Bitcoin breaks down, the analyst points to a significantly lower accumulation zone between roughly $61,000 and $65,000. This area aligns with historical support levels and the 200-day moving average, representing what he considers an exceptional opportunity.

QWhat are the next major resistance levels for Bitcoin mentioned in the article after the $76,600 area?

AJust above the $76,600 level sits a Chicago Mercantile Exchange (CME) gap around $79,000, followed by another resistance cluster near the upper-$80,000 range.

QWhat is the key difference the analyst notes between the current market setup and the breakdown that occurred in February?

AIn February, a previously established resistance level failed to transition into support, leading to a rapid decline. Currently, the market is attempting to defend a former resistance zone ($71,000-$73,000) as support, which is a positive development that could preserve the larger bullish framework.

İlgili Okumalar

The Rally That Wasn't

The article analyzes Bitcoin's sharp decline amid a shift in macroeconomic expectations, with strong US job data leading markets to price out Fed rate cuts. Bitcoin fell 13% to around $67,000, triggering significant outflows from US spot ETFs and indicating institutional de-risking. On-chain data confirms a bearish structure. Price has dropped back into the "bear market range," with the Short-Term Holder Cost Basis falling below a key mean level—a pattern last seen in early 2022. The profitability bias has collapsed, with loss realization now dominating, mirroring a panic wave from February. Recent buyers who accumulated near the $82k top are under pressure, and loss realization is accelerating across both short-term and long-term holder cohorts. Off-chain, the rally failed at the aggregate US ETF cost basis near $83k, turning it into resistance. Spot market demand has deteriorated sharply, with sellers dominating order books. While a major long liquidation event cleared over $400M in leverage, spot buyers have not returned to absorb supply. Options markets show sustained demand for downside protection (elevated put premiums) but not panic, with volatility premiums near three-month highs. The conclusion is that the market remains fragile, with overhead supply from trapped ETF investors, weak spot demand, and accelerating losses. Without a return of spot buying and a reclaim of key cost bases, Bitcoin is vulnerable to further downside within the prevailing bear market structure.

insights.glassnode2 saat önce

The Rally That Wasn't

insights.glassnode2 saat önce

İşlemler

Spot
Futures

Popüler Makaleler

T Nasıl Satın Alınır

HTX.com’a hoş geldiniz! Threshold Network Token (T) satın alma işlemlerini basit ve kullanışlı bir hâle getirdik. Adım adım açıkladığımız rehberimizi takip ederek kripto yolculuğunuza başlayın. 1. Adım: HTX Hesabınızı OluşturunHTX'te ücretsiz bir hesap açmak için e-posta adresinizi veya telefon numaranızı kullanın. Sorunsuzca kaydolun ve tüm özelliklerin kilidini açın. Hesabımı Aç2. Adım: Kripto Satın Al Bölümüne Gidin ve Ödeme Yönteminizi SeçinKredi/Banka Kartı: Visa veya Mastercard'ınızı kullanarak anında Threshold Network Token (T) satın alın.Bakiye: Sorunsuz bir şekilde işlem yapmak için HTX hesap bakiyenizdeki fonları kullanın.Üçüncü Taraflar: Kullanımı kolaylaştırmak için Google Pay ve Apple Pay gibi popüler ödeme yöntemlerini ekledik.P2P: HTX'teki diğer kullanıcılarla doğrudan işlem yapın.Borsa Dışı (OTC): Yatırımcılar için kişiye özel hizmetler ve rekabetçi döviz kurları sunuyoruz.3. Adım: Threshold Network Token (T) Varlıklarınızı SaklayınThreshold Network Token (T) satın aldıktan sonra HTX hesabınızda saklayın. Alternatif olarak, blok zinciri transferi yoluyla başka bir yere gönderebilir veya diğer kripto para birimlerini takas etmek için kullanabilirsiniz.4. Adım: Threshold Network Token (T) Varlıklarınızla İşlem YapınHTX'in spot piyasasında Threshold Network Token (T) ile kolayca işlemler yapın.Hesabınıza erişin, işlem çiftinizi seçin, işlemlerinizi gerçekleştirin ve gerçek zamanlı olarak izleyin. Hem yeni başlayanlar hem de deneyimli yatırımcılar için kullanıcı dostu bir deneyim sunuyoruz.

460 Toplam GörüntülenmeYayınlanma 2024.12.10Güncellenme 2026.06.02

T Nasıl Satın Alınır

Tartışmalar

HTX Topluluğuna hoş geldiniz. Burada, en son platform gelişmeleri hakkında bilgi sahibi olabilir ve profesyonel piyasa görüşlerine erişebilirsiniz. Kullanıcıların T (T) fiyatı hakkındaki görüşleri aşağıda sunulmaktadır.

活动图片