Polkadot has surged over 11% in 24 hours as trading volume jumped nearly 78%, signaling renewed market activity as buyers returned aggressively to the DOT market.
Rising participation has accompanied the move toward the $1.59 region, suggesting that traders have stepped back into the market after weeks of subdued activity.
Increased liquidity has strengthened short-term price dynamics while expanding volatility across spot markets.
As a result, Polkadot [DOT] traded closer to an important resistance barrier that could influence the next directional move.
Descending channel breakout reshapes DOT structure
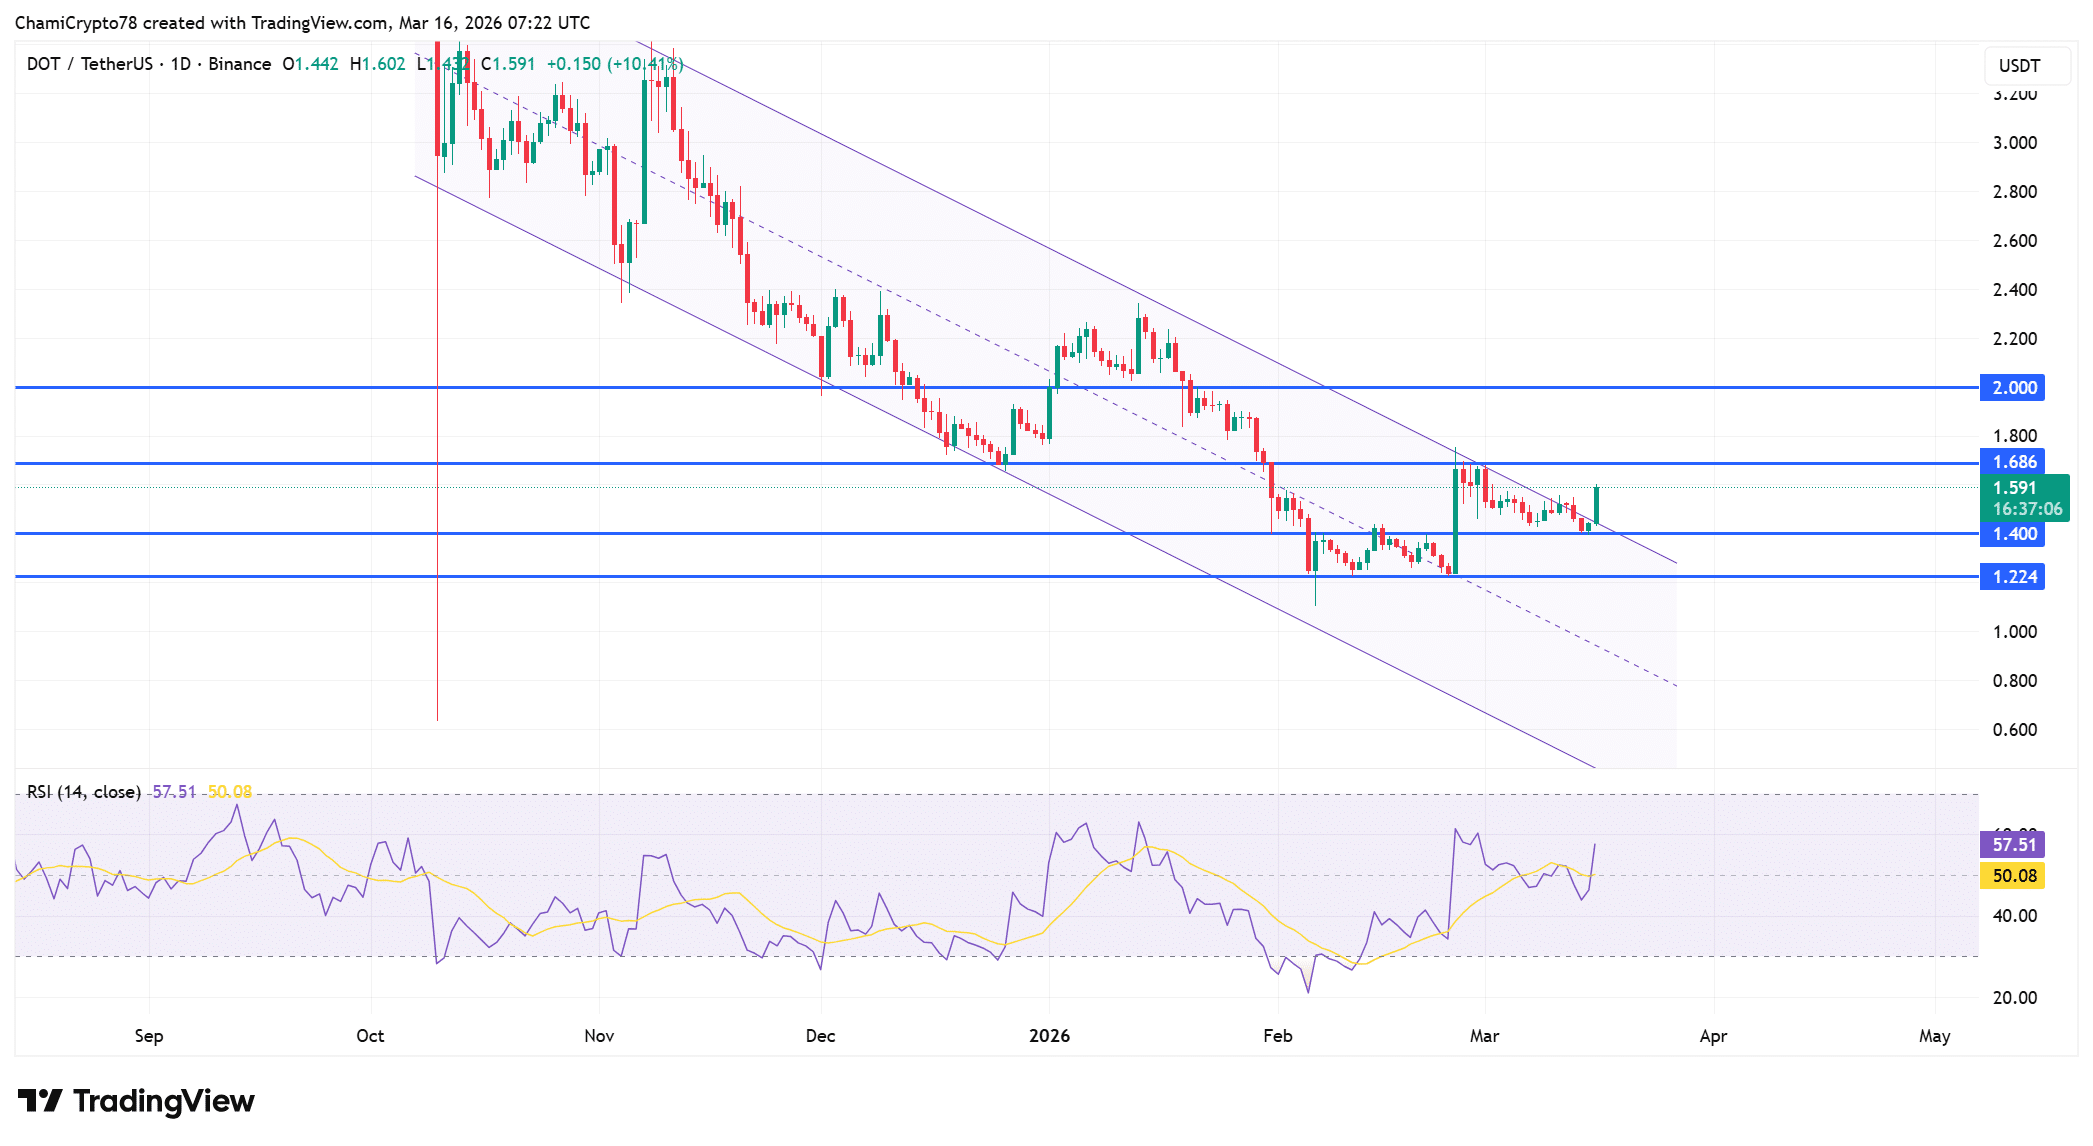
Price action reflected a notable structural shift after DOT had broken above a prolonged descending channel.
The breakout has followed the sharp rally that pushed the price toward the $1.686 resistance zone, placing the asset near a technical inflection point.
Earlier price compression inside the channel had restricted recovery attempts for months.
However, the recent surge has lifted the price above that declining boundary, signaling that bearish control has weakened considerably.
Technical indicators now reflect strengthening buyer activity as the RSI has climbed to 57.51, clearly above the 50 neutral threshold.
This shift suggests that demand has strengthened steadily following earlier weakness during the prolonged downtrend.
As buyers regained control of short-term price swings, the indicator has gradually advanced into bullish territory.
Meanwhile, DOT continued trading near $1.591, which places it between the $1.400 support level and the $1.686 resistance barrier.
Buyers have defended the lower zone repeatedly during recent sessions.
As a result, the breakout structure now attracts attention because a sustained push above $1.686 could open the path toward the $2.000 resistance region.

Buy-dominant order flow strengthens DOT demand
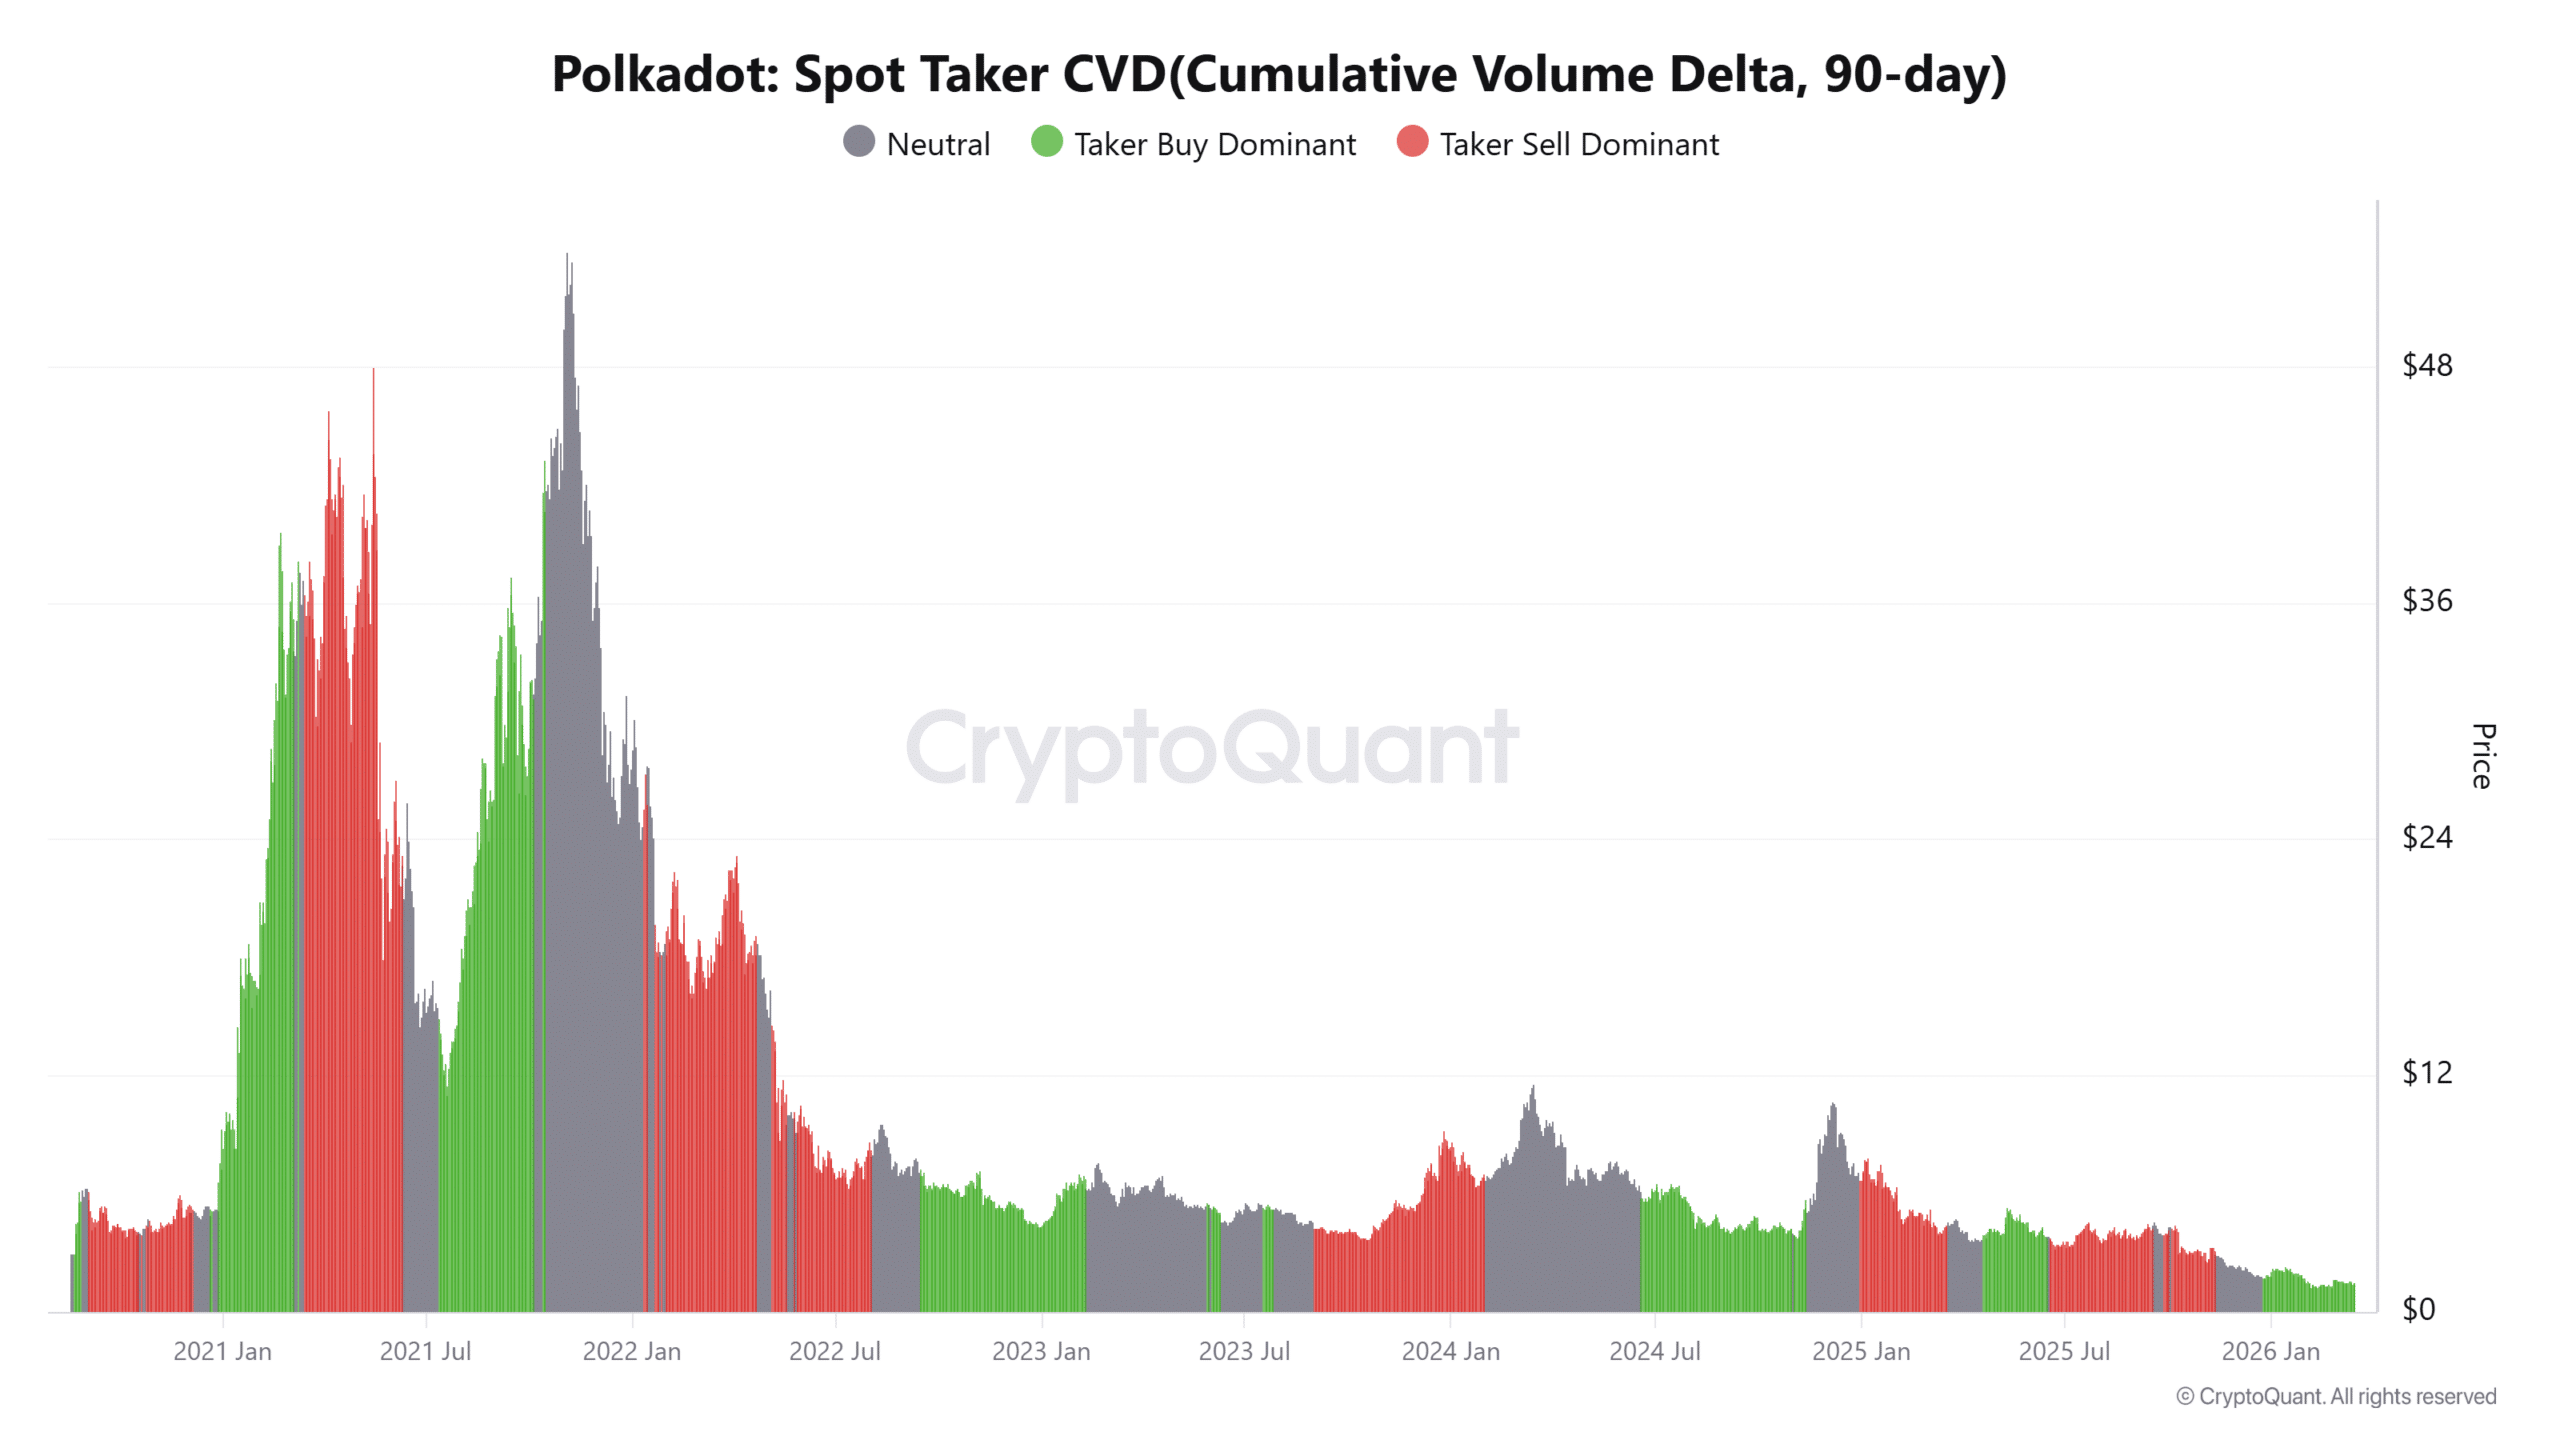
Market activity across spot exchanges now reflects strong buyer aggression as Spot Taker CVD has shifted into buy-dominant territory.
This metric tracks the cumulative difference between aggressive buy orders and sell orders, providing insight into trader conviction.
Recent readings suggest that market participants have increasingly executed buy orders at market prices rather than waiting for passive liquidity.
Such behavior often reflects stronger directional conviction among traders. In DOT’s case, this buyer-led order flow has emerged alongside rising trading activity and the recent price breakout.
As aggressive demand continues driving transactions, traders increasingly interpret the data as a signal that accumulation pressure has strengthened across spot markets.

Top Binance traders lean heavily long on DOT
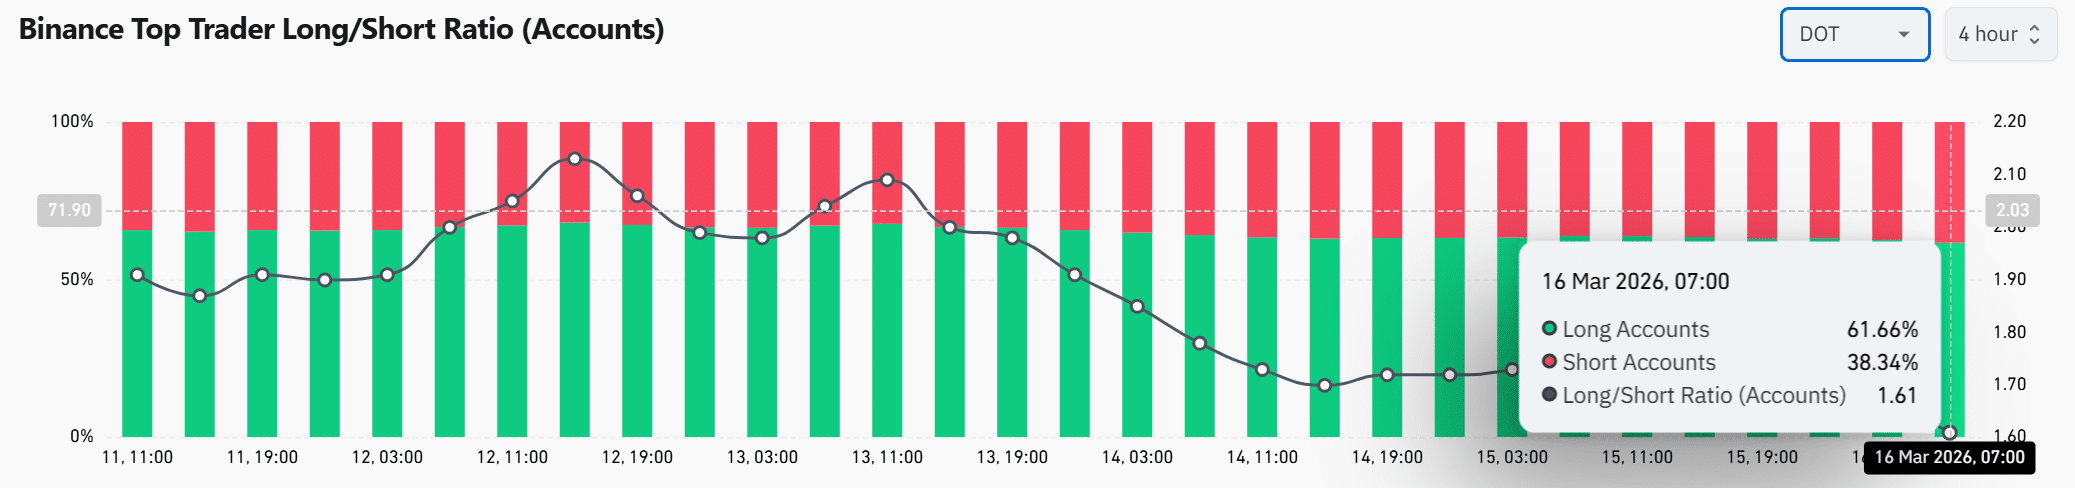
Data from CoinGlass on Binance Top Trader Long/Short Ratio showed that 61.66% of accounts held long positions at press time, while 38.34% maintain short exposure, resulting in a long/short ratio of 1.61.
This distribution indicates that experienced traders have largely positioned themselves for further upside.
Earlier sessions showed fluctuating positioning among top traders. However, recent readings show that long exposure has remained dominant while price attempted recovery.
This alignment between derivatives positioning and strengthening spot demand often signals growing conviction among market participants as they anticipate continued upside pressure.

Polkadot has strengthened significantly as the price surged above its descending channel while buyers expanded trading activity and aggressive order flow.
Technical indicators and derivatives positioning now support improving sentiment. However, the $1.686 resistance remains the next critical barrier.
A decisive break above that level could drive DOT toward the $2.000 zone as buyer conviction continues strengthening across the market.
Final Summary
- Polkadot [DOT] jumped over 11% in 24 hours, with trading volume rising nearly 78%.
- DOT broke above a prolonged descending channel, indicating weakening bearish control after months of price compression.


