Market Plunges into Extreme Panic, Five Major Data Indicators Reveal BTC Buying Signals

比推2026-02-02 tarihinde yayınlandı2026-02-02 tarihinde güncellendi

Özet

The cryptocurrency market is experiencing extreme fear, with Bitcoin (BTC) dropping to $75,700 and Ethereum (ETH) to $2,220, causing $435 million in liquidations. A survey of 1,189 investors revealed that 45.6% believe BTC’s 2026 bottom will be between $75,000–$85,000, while 30.2% see it at $60,000–$75,000. Nearly half of respondents (47.2%) plan to DCA and hold long-term. Key on-chain metrics from Glassnode indicate potential support levels: the short-term holder cost basis is $95,400, the active investor average is $87,300, the realized price is $80,500, and the network-wide average cost basis is $55,900. The ahr999 indicator, which recently fell below 0.45 for the first time since October 2023, suggests a buying opportunity below $76,000. Analyst Willy Woo’s CVDD model points to a hard bottom near $45,000, while the cost basis of large holder “Strategy” ($76,040) is seen as a critical support level. Overall, data suggests a potential bottom formation between $45,000–$76,000.

Author: Ma He, Foresight News

Original Title: 5 Major Data Indicators Revealed: Is There a BTC Buying Signal Below $75,000?


Wintermute stated last week that $85,000 is a key level for BTC and that a direction would be chosen soon. Unfortunately, the direction was not upward but sharply downward.

On February 2, BTC fell to $75,700, and ETH dropped to $2,220. Numerous altcoins continued to decline. Regarding liquidation data, Coinglass data shows that $435 million was liquidated in the past 12 hours, with long positions accounting for $324 million.

The market fear index is 15, indicating that market sentiment has once again fallen into extreme panic.
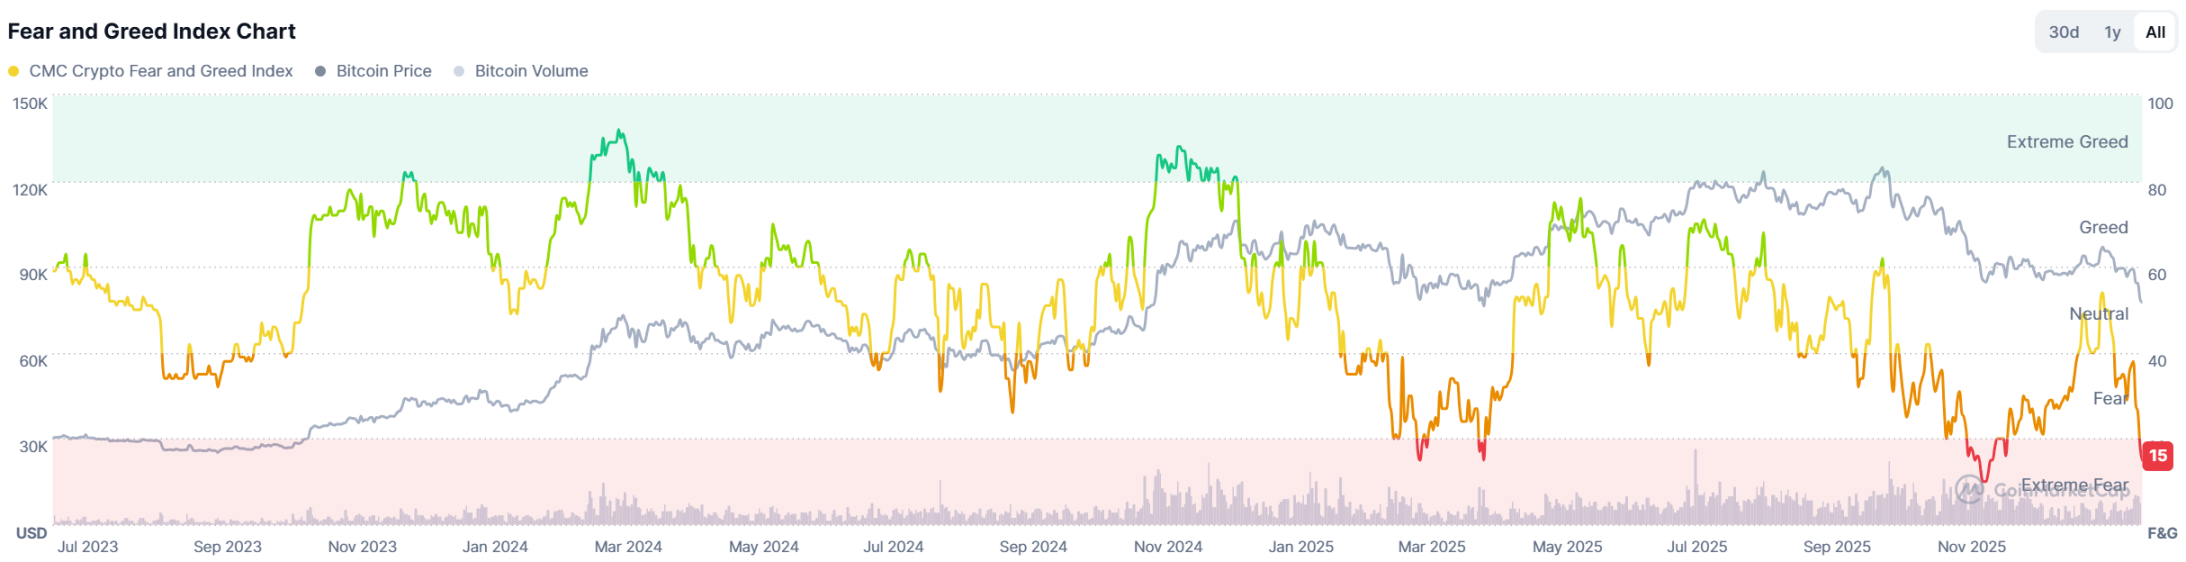
After the market turned bearish, where is BTC's bottom range? Five major data indicators reveal the answer.

Data Survey: 30% of Users Believe BTC's Bottom Range Is Between $60,000 and $75,000

On January 30, Foresight News conducted an investor market confidence survey. At the time of the survey, BTC was priced at $84,000. It has since fallen significantly over the following days, so the survey results are for reference only.

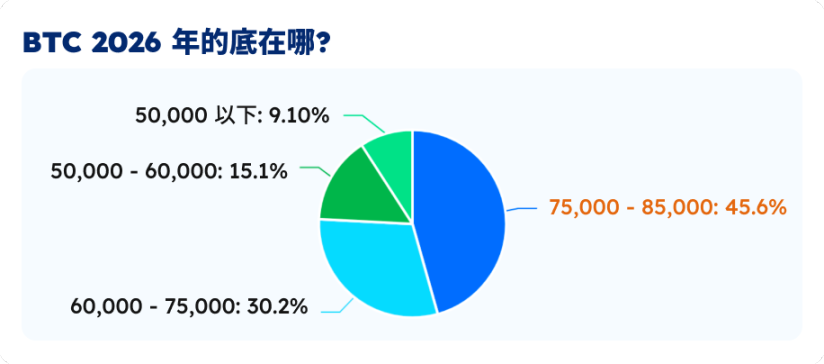
The poll (with 1,189 participants) showed that most respondents (45.6%) believe BTC's bottom price in 2026 will be between $75,000 and $85,000. Another 30.2% of respondents believe the bottom price will be between $60,000 and $75,000.
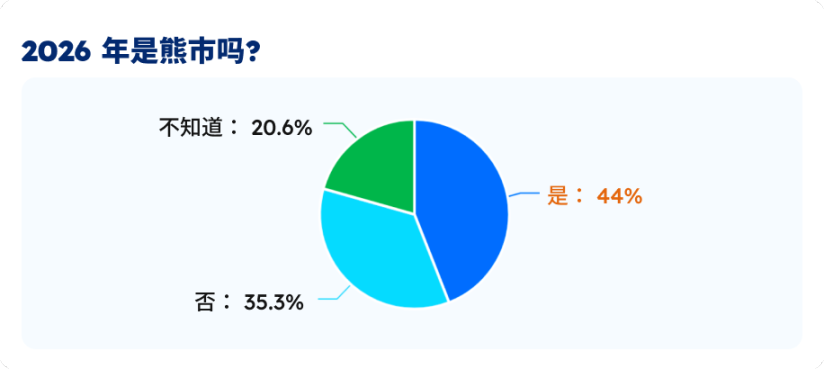
44% of respondents believe 2026 will be a bear market, while 35.3% disagree and do not think it will be a bear market. Another 20.6% of respondents are uncertain.
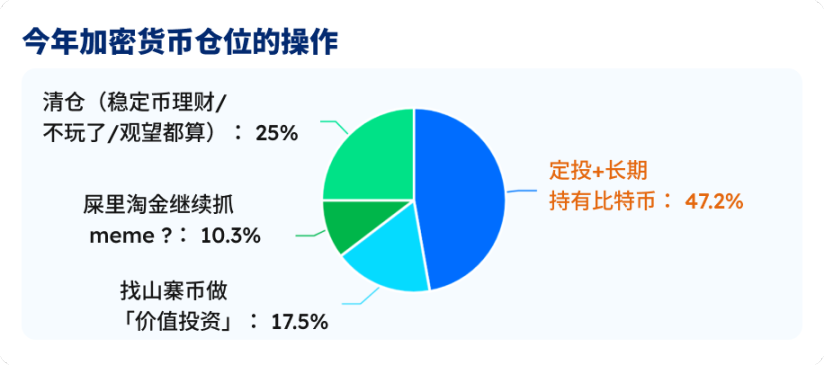
Nearly half of the respondents (47.2%) choose to dollar-cost average and hold Bitcoin long-term. Another 25% of respondents choose to liquidate their positions and switch to stablecoin investments or wait and see. 17.5% of respondents are looking for altcoins for value investing.
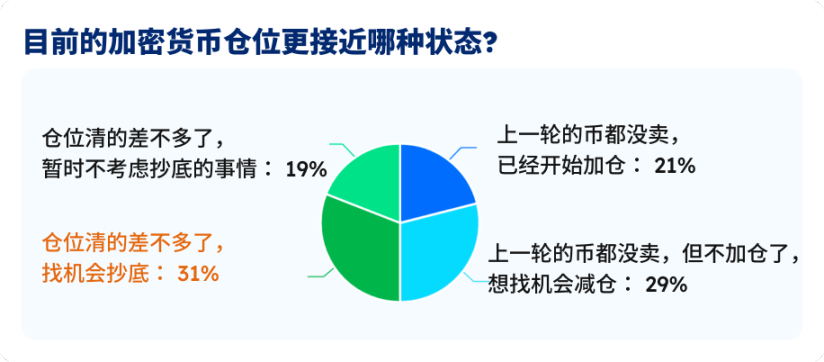
Currently, among the voting respondents, 31% say they have mostly cleared their positions but are still looking for opportunities to buy the dip. 29% say they haven't sold their holdings from the last cycle but are not adding positions for now and are looking for opportunities to reduce them. 21% say they haven't sold their holdings from the last cycle and have already started adding positions.
Glassnode Shows BTC's On-Chain Cost Basis Is $55,900

As Bitcoin falls below $78,000, Glassnode has updated the key on-chain price distribution as follows: The STH (Short-Term Holder) cost basis, reflecting the average holding price of new buyers/traders who entered the market in recent months, is $95,400.
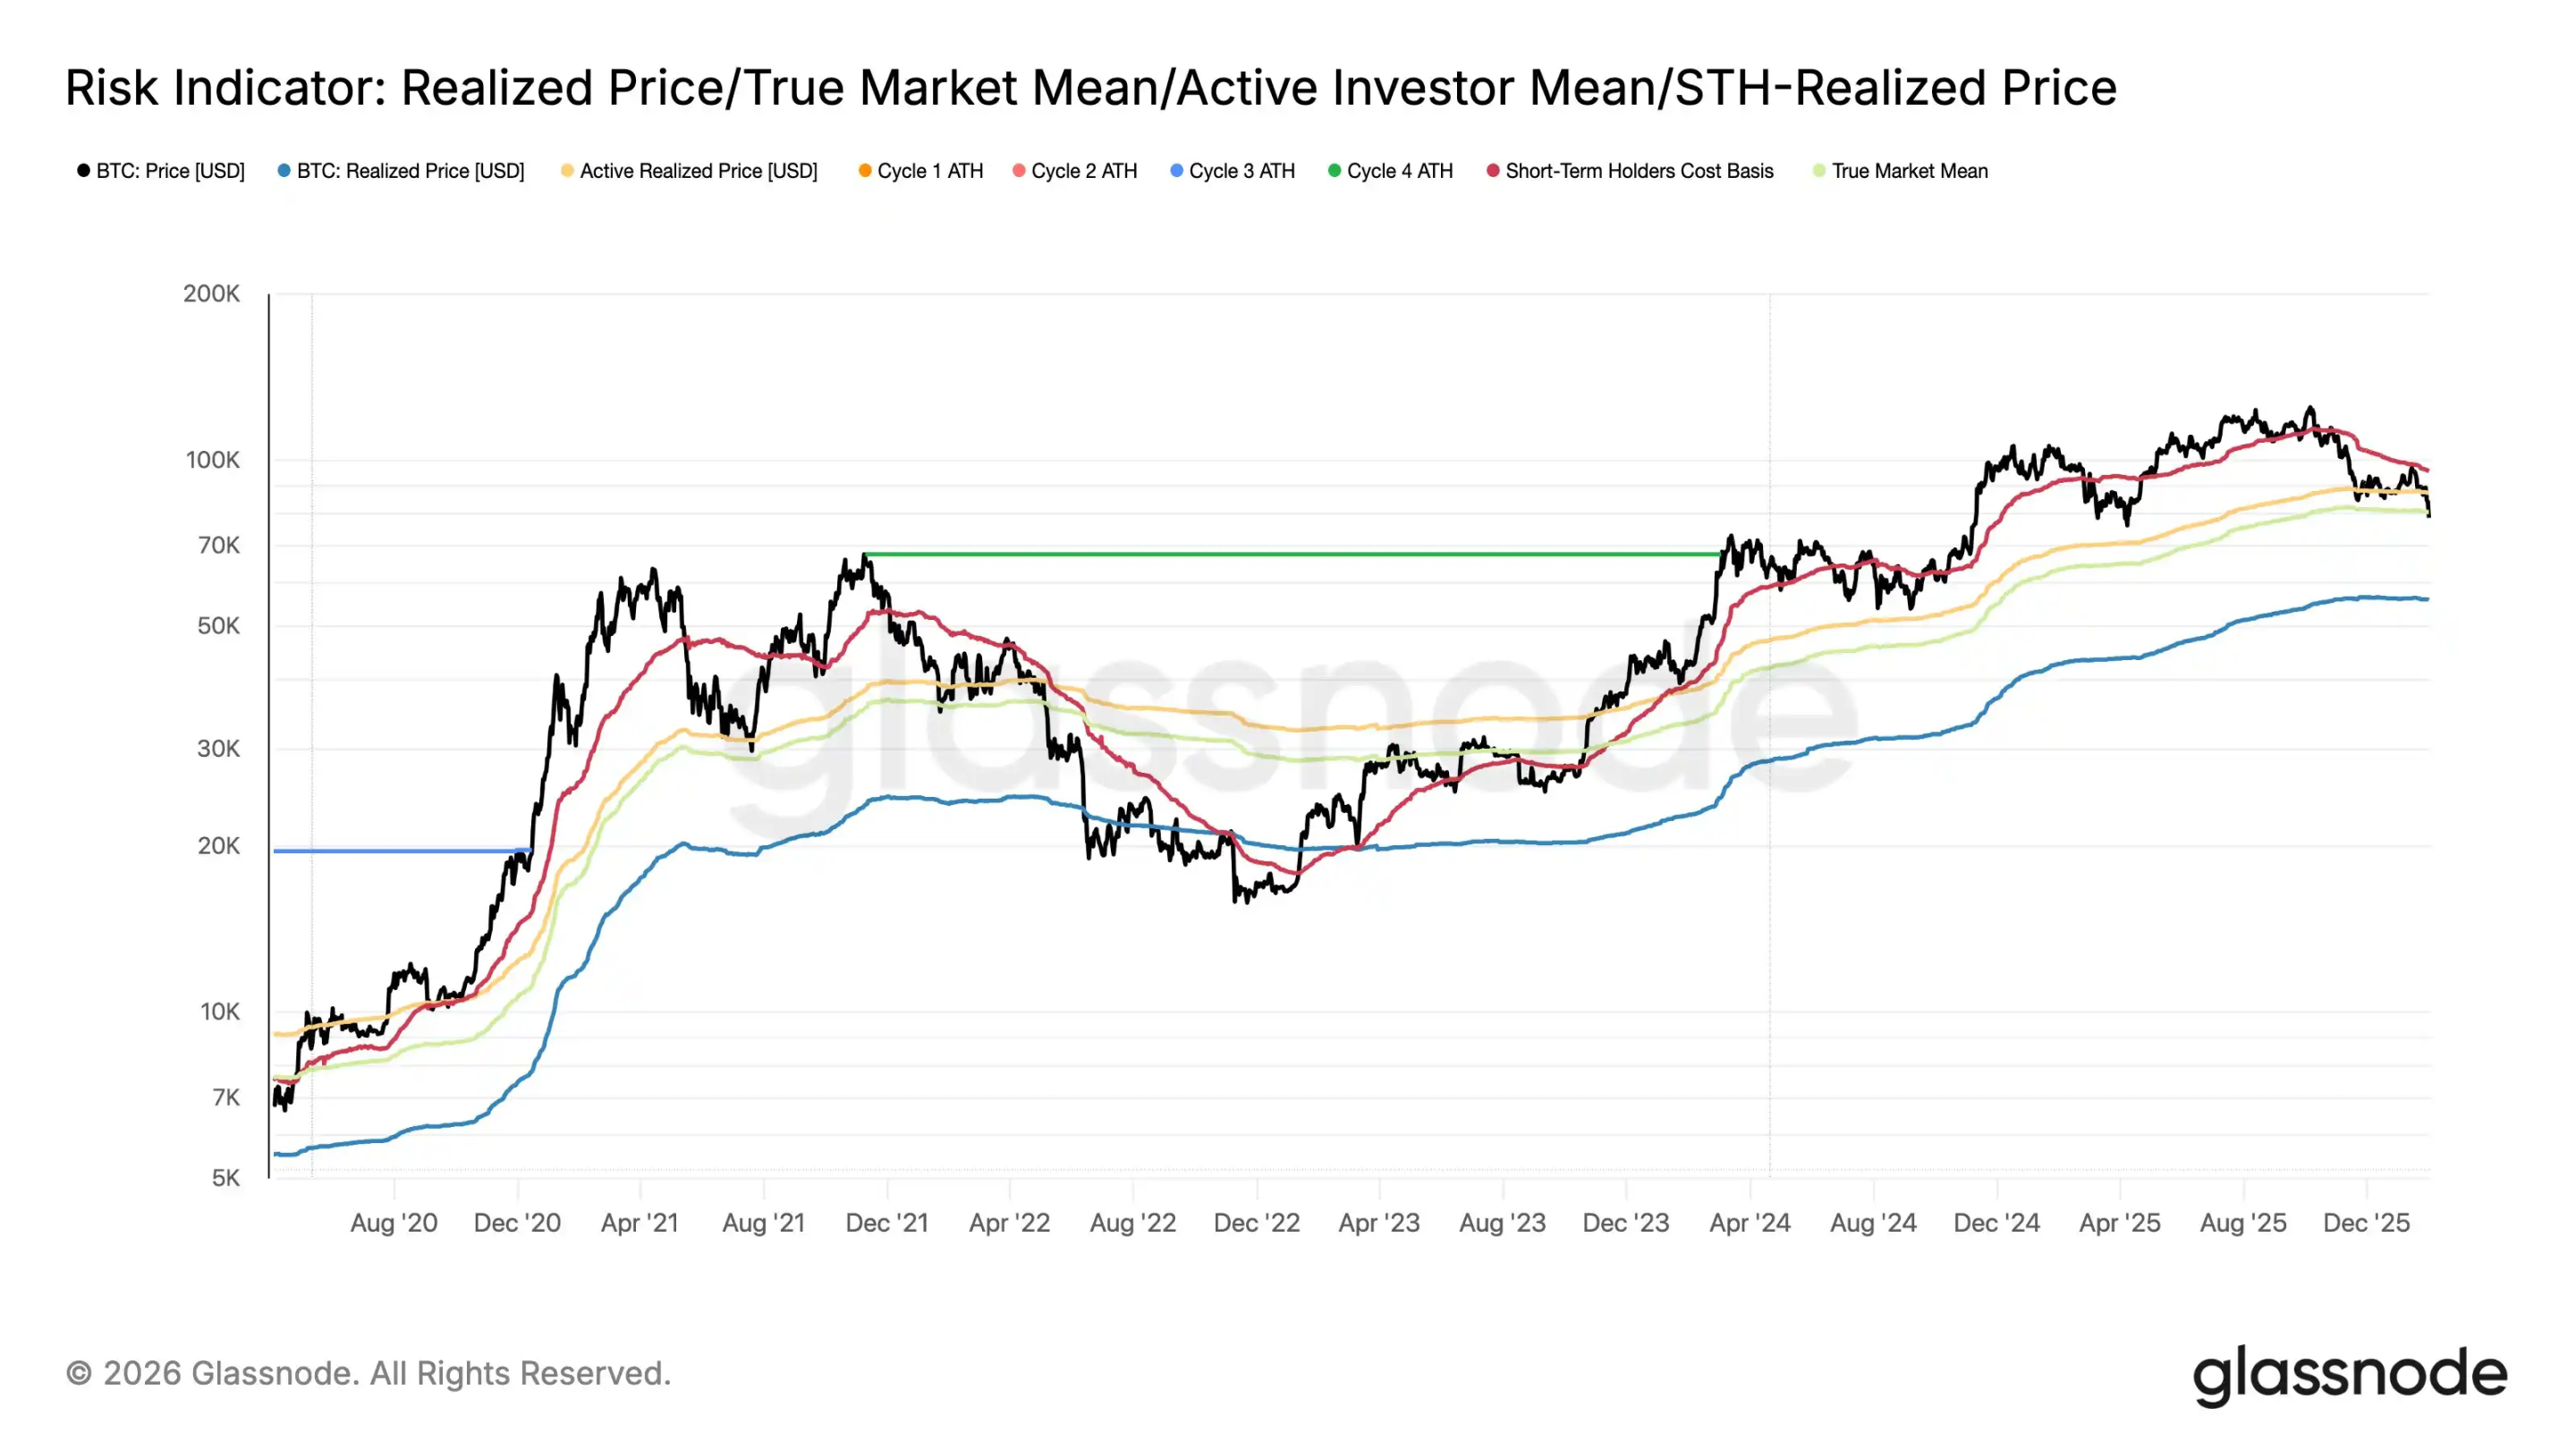
The average investment of active investors, representing the average holding cost of traders currently "on the field," is $87,300; the Realized Price, focusing on the cost basis of actual traders in the secondary market, is $80,500. The Coin Price, representing the average cost basis of all coins across the entire network, is $55,900.

This means that when the BTC price is below $80,500, your purchase price is lower than the cost price of other recent traders. If BTC falls below $55,900, it means your purchase price is already below the average cost of the entire network.

In the 2022 cycle, the BTC price once fell below the entire network's average cost basis. In this cycle, influenced by macro liquidity, spot ETFs, and other factors, whether BTC will fall below $55,900 remains unknown.

Ahr999 Indicator Shows Accumulation Signal

The ahr999 indicator was invented years ago by Weibo user ahr999 to evaluate BTC's short-term returns and price deviations. The calculation formula is (Current Price / 200-day Dollar-Cost Average) × (Current Price / Exponential Growth Valuation), where the exponential growth valuation is based on a fitting curve of historical prices and block height, representing the long-term "fair value." Historical experience shows: ahr999 1.2 is the high-price zone.
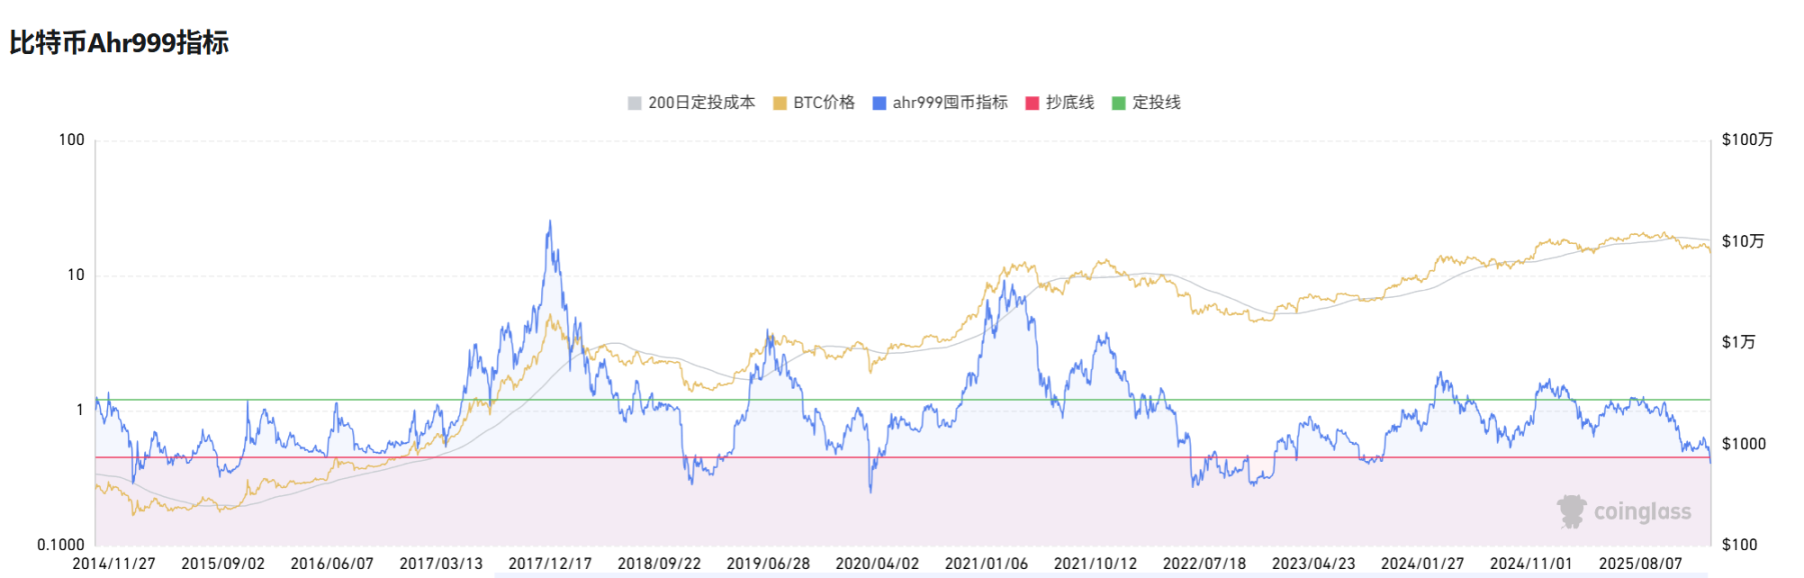
On February 1, 2026, ahr999 fell below 0.45 for the first time, the first occurrence in 839 days since October 16, 2023, marking a potential market bottom. The current break below the threshold suggests the BTC price is significantly below long-term growth expectations, similar to the end of the 2023 bear market. This signal strongly suggests buying the dip, but it needs to be confirmed with trading volume to avoid false breakouts. Buying strategy: If ahr999 stabilizes below 0.45, consider buying in batches below $76,000, and reduce positions when it rebounds above 1.2.

Willy Woo Indicator Shows BTC's Hard Bottom Is $45,000

The indicator developed by renowned analyst Willy Woo is the CVDD model. "When Bitcoin transfers from an old investor who bought at $1 to a new investor who buys at $100,000, the new investor will value these Bitcoins with a higher floor price, which helps raise the perceived floor price of the entire Bitcoin supply globally. Active custodian rotation (i.e., frequent transfers of Bitcoin between different investors or custodians) may also indicate that investors value these Bitcoins highly."

When many whales transfer BTC to new Bitcoin wallet addresses, the market's bottom price is rising.
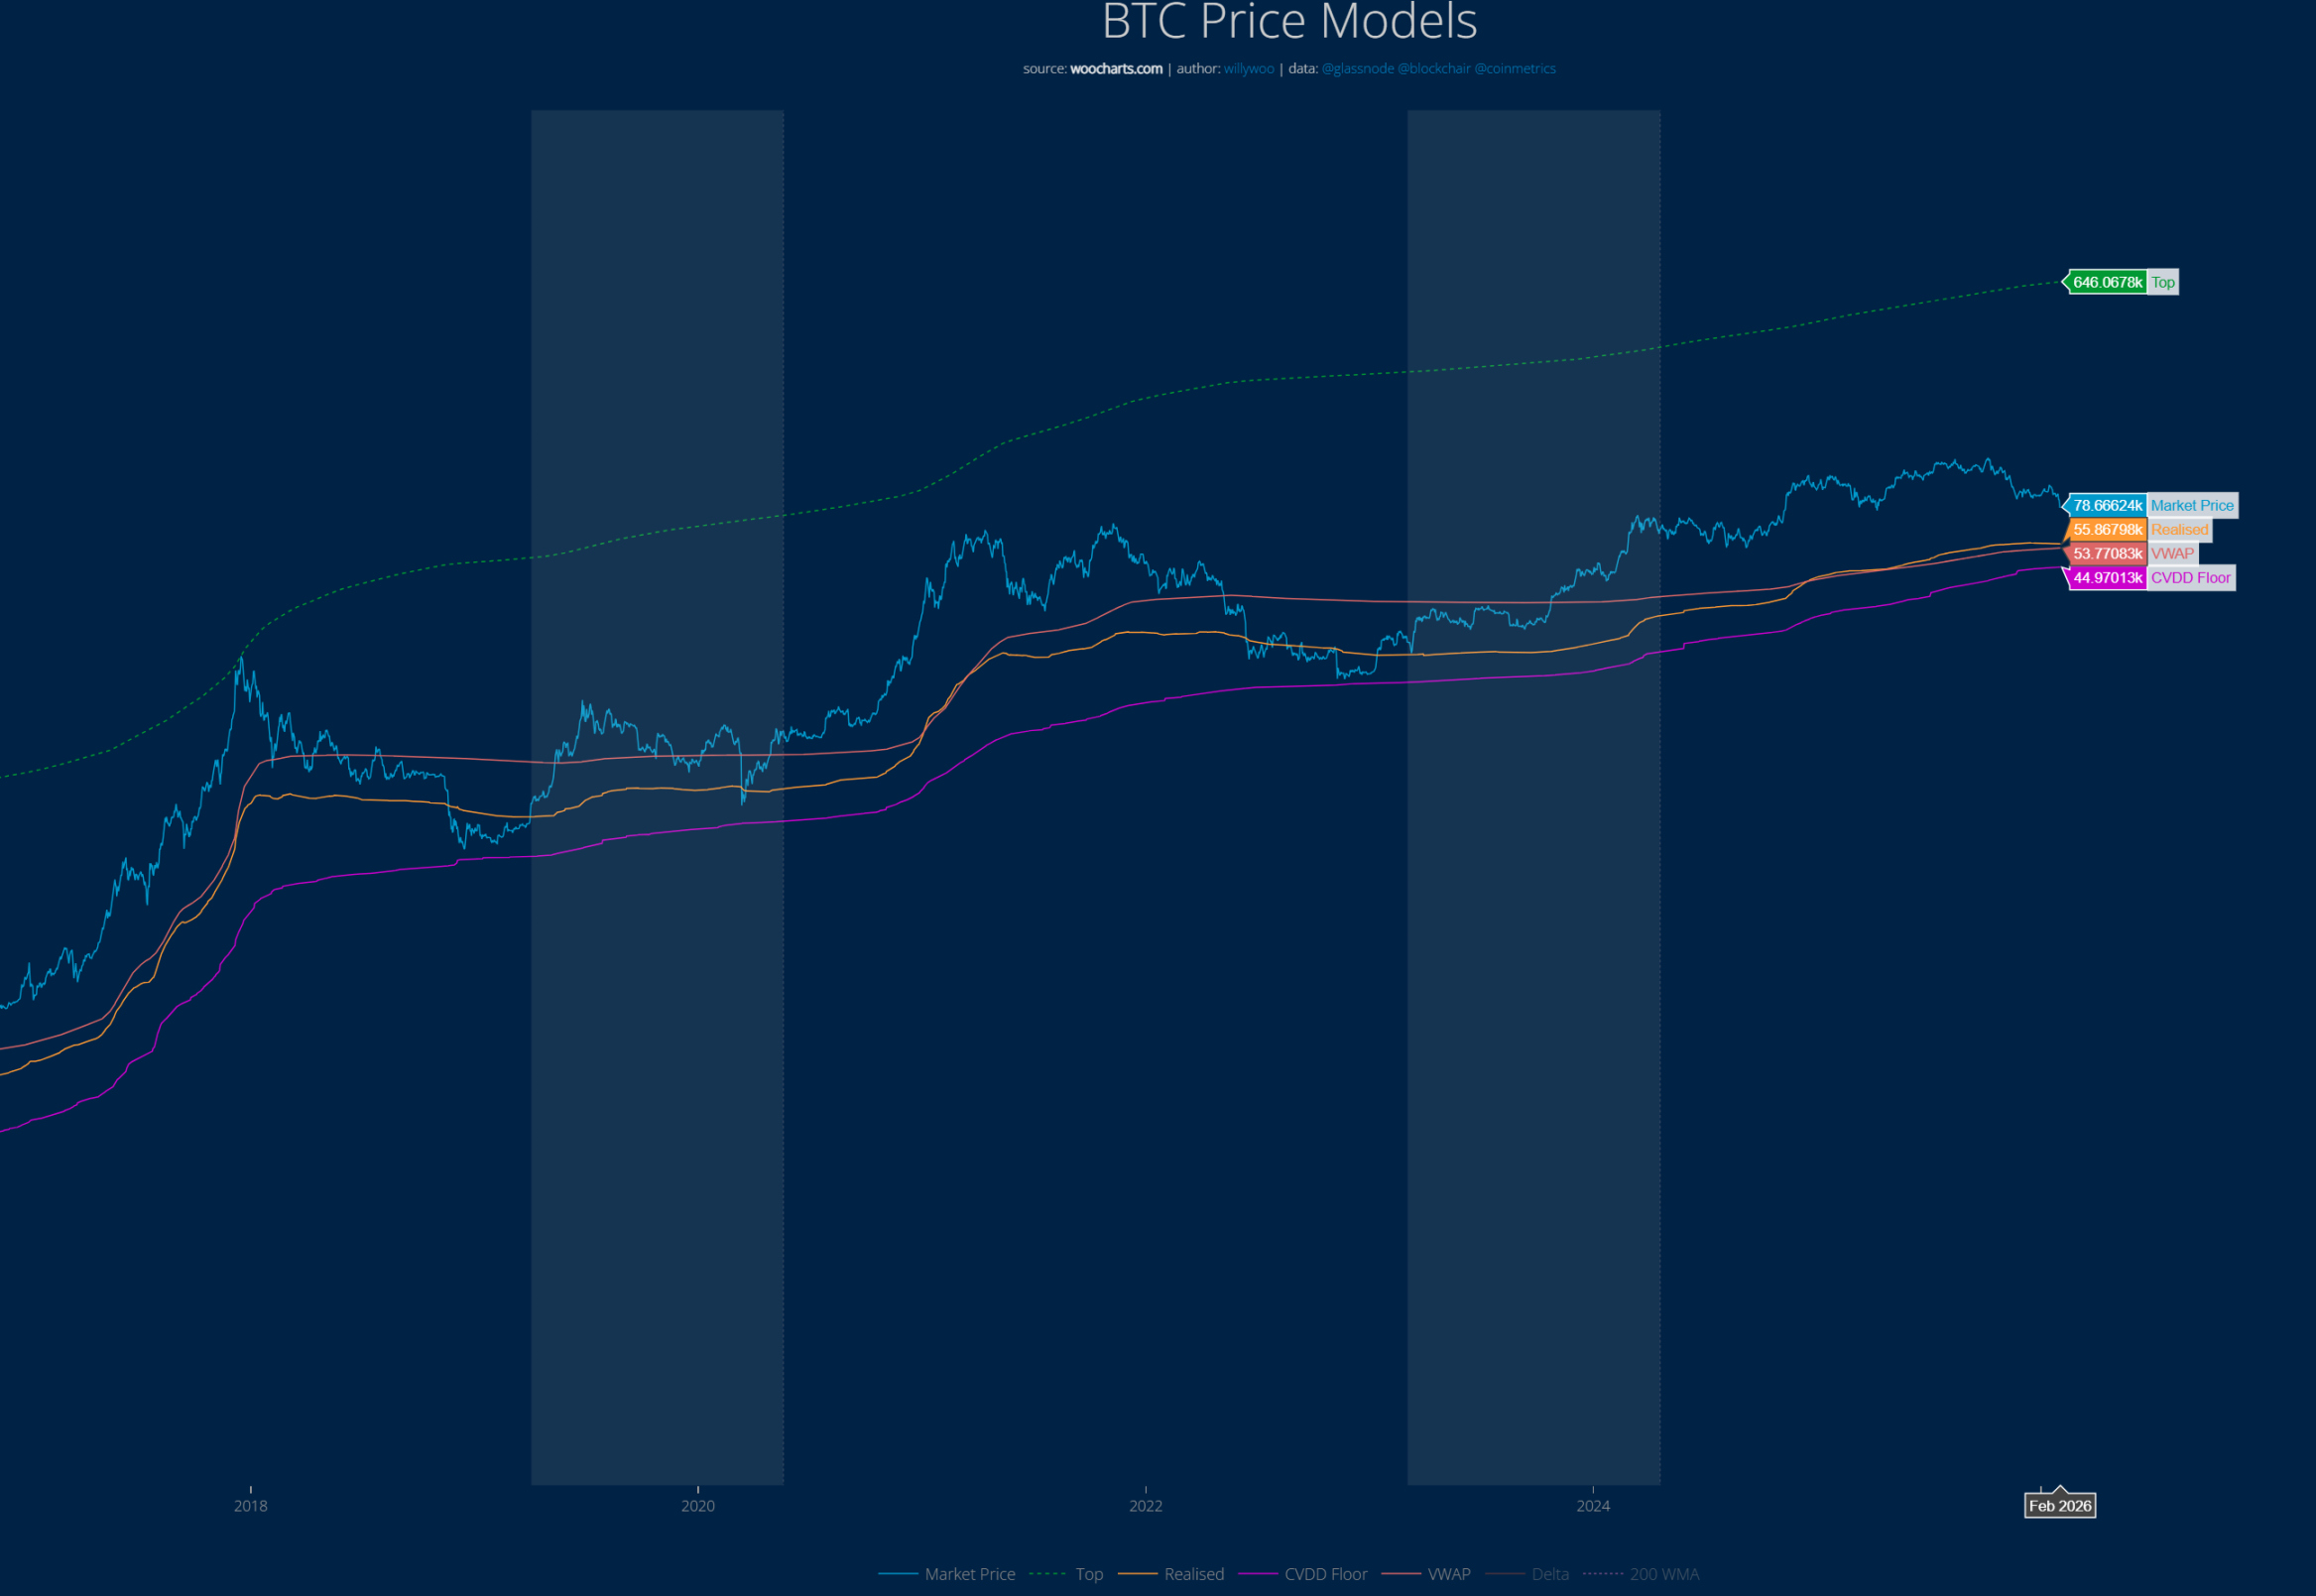
The BTC price has never fallen to the red line (CVDD model). Currently, the CVDD indicator shows a hard bottom of approximately $45,000. In past cycles, BTC once fell below the yellow line in the chart, which currently ranges from $53,000 to $56,000.

Strategy's Bitcoin Cost Price Is $76,040

As of February 2, the well-known Bitcoin accumulation大户 (large holder) Strategy holds a total value of approximately $54.2 billion, with 712,647 BTC. Their average holding cost is about $76,040.
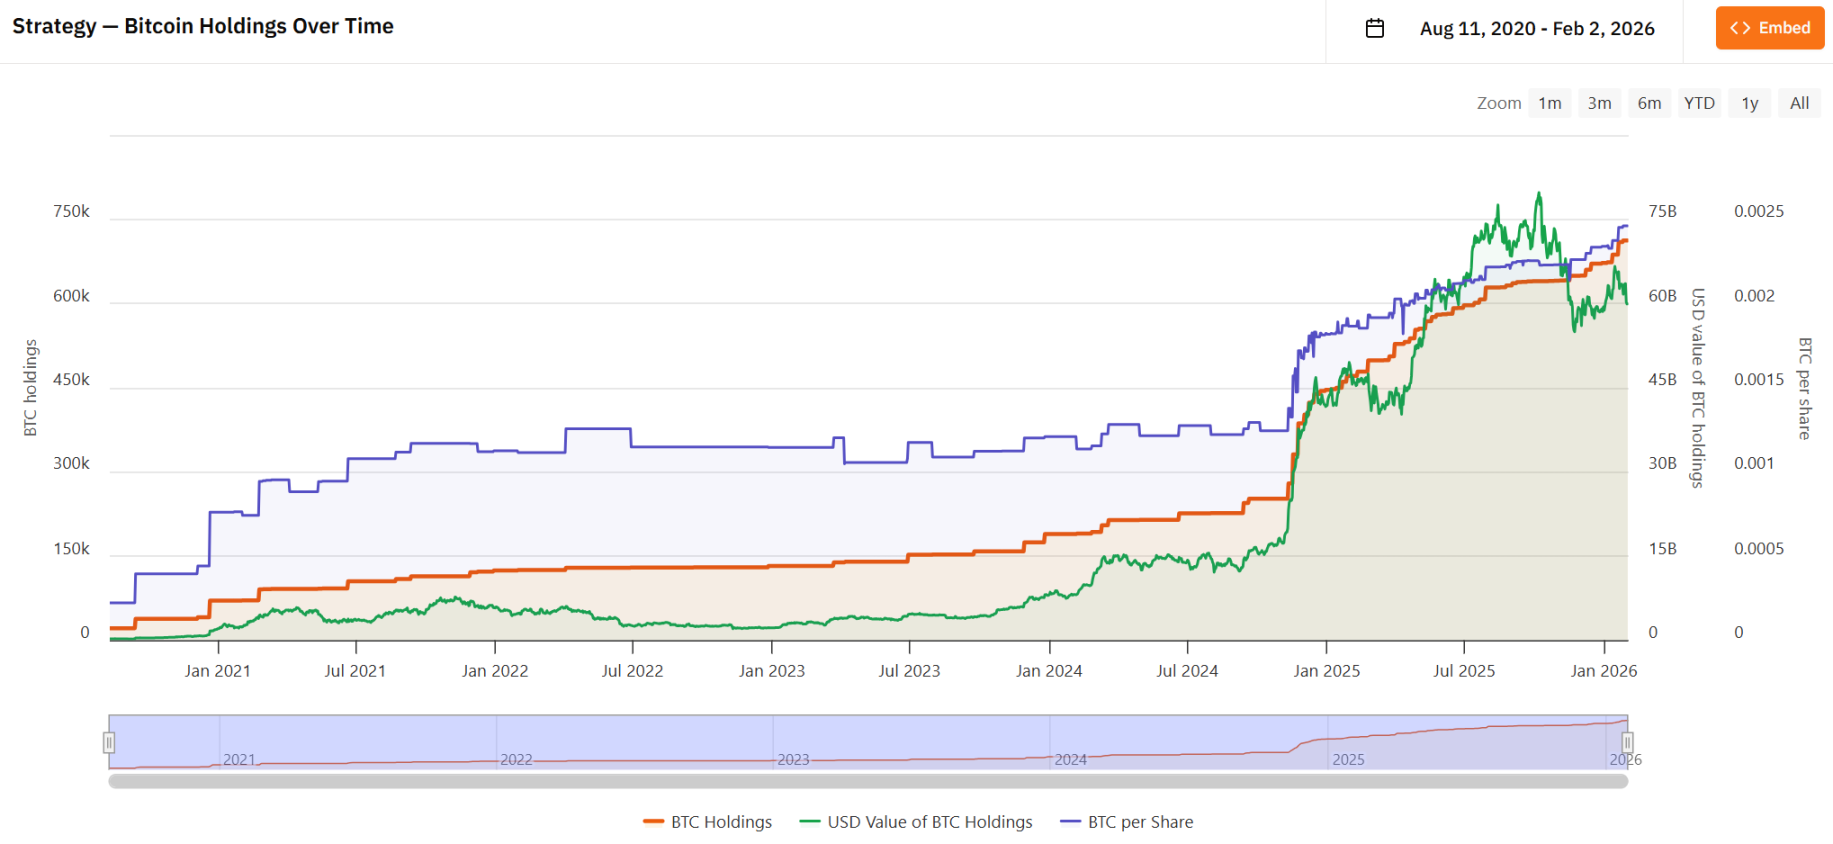
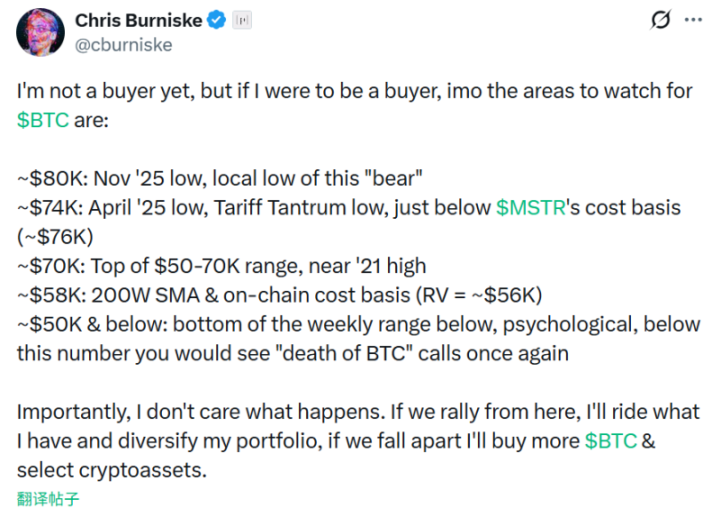
Historically, the area below this average cost has been the bottom range. Placeholder partner Chris previously stated that the $74,000 to $76,000 range is a price line worth paying close attention to.

Twitter:https://twitter.com/BitpushNewsCN

Bitpush TG Discussion Group:https://t.me/BitPushCommunity

Bitpush TG Subscription: https://t.me/bitpush

Original link:https://www.bitpush.news/articles/7608002

İlgili Sorular

QWhat is the current market sentiment according to the Fear & Greed Index mentioned in the article?

AThe market sentiment is at 'Extreme Fear', with a Fear & Greed Index reading of 15.

QAccording to the ahr999 indicator, what is the signal for a potential market bottom and when did it last occur?

AThe ahr999 indicator falling below 0.45 is a signal for a potential market bottom. This last occurred on February 1, 2026, which was the first time in 839 days since October 16, 2023.

QWhat is the 'iron bottom' price for Bitcoin as indicated by Willy Woo's CVDD model?

AWilly Woo's CVDD model indicates an 'iron bottom' price for Bitcoin at approximately $45,000.

QWhat is the average on-chain cost basis for the entire Bitcoin network, as provided by glassnode?

AThe average on-chain cost basis for the entire Bitcoin network is $55,900.

QWhat price range did the majority of respondents in the Foresight News survey believe would be the bottom for BTC in 2026?

AThe majority of respondents (45.6%) believed the bottom price for BTC in 2026 would be in the range of $75,000 to $85,000.

İlgili Okumalar

What Happens When Two Miners Find a Block in the Same Second? How the 'Orphan Race' Unfolds

Bitcoin mining is a race without a real-time referee. A newly mined block must physically propagate across the global peer-to-peer network before consensus is reached on the chain's tip. This takes seconds, sometimes longer on congested connections. If a second miner finds a valid block before learning of a competing one, they build on their last-known version and broadcast their own block. For a short time, two equally valid blocks exist at the same height, creating a temporary chain split. The network resolves this not by voting or timestamps, but by Proof-of-Work: the chain that accumulates the most work becomes canonical. Blocks on the losing side are "orphaned" or "stale." Their miners lose the block reward and fees, though unconfirmed transactions return to the mempool. Usually, a single subsequent block resolves the tie. A notable two-block reorganization occurred on March 24, 2026. Antpool and Foundry USA mined competing versions of block 941,881 seconds apart. ViaBTC extended Antpool's chain, while Foundry extended its own, creating a one-block split. Foundry then pulled ahead by mining six consecutive blocks, making its chain the heaviest. All nodes switched to Foundry's chain, orphaning blocks from Antpool and ViaBTC. While such multi-block reorganizations are rare, the underlying race condition is common. Analysis shows about 9.2% of block intervals in a sample period were under 60 seconds, each representing a potential short-lived race. Fast relay networks have reduced propagation delays, making prolonged splits rarer. However, the event highlighted a trend of hash rate concentration, where well-resourced pools have a higher chance of winning any specific race and mining consecutive blocks, marginalizing smaller miners.

cryptonews.ru9 dk önce

What Happens When Two Miners Find a Block in the Same Second? How the 'Orphan Race' Unfolds

cryptonews.ru9 dk önce

AmericanFortress proposed a scheme to protect crypto wallets from quantum threats

AmericanFortress has published a preprint detailing ZKPoSP, a cryptographic scheme designed to protect hierarchically deterministic (HD) cryptocurrency wallets from potential quantum attacks without requiring users to change their addresses. The proposed scheme replaces classical digital signatures with non-interactive zero-knowledge (NIZK) proofs, aiming to maintain compatibility with existing address formats. The company also introduced the QBIP32 scheme, intended to generate a signing scalar, a separate quantum-resistant proof, and a chain code in a single function call. According to the authors, QBIP32 can be applied to various elliptic curves of prime order, including secp256k1 and Ed25519. The post-quantum security of the scheme is described as "conjectured," relying on the quantum resistance of the underlying hash functions and NIZK proofs. However, for the scheme to function in a given blockchain network (like Bitcoin, Ethereum, or Solana), nodes would need to support verification of these new proofs instead of standard signatures—a capability currently not implemented. An implementation in Rust using RISC Zero reportedly takes 12–13 seconds to generate a proof and 9–10 milliseconds to verify it. The publication follows other industry efforts to address quantum threats, including reports from Galaxy on vulnerable assets, new hardware wallets like the PQ1, and consortiums like the Bitcoin Security Consortium pledging funding for post-quantum cryptography research. This new work specifically focuses on HD wallets and positions ZKPoSP/QBIP32 as a general mechanism for multiple curves and networks.

cryptonews.ru19 dk önce

AmericanFortress proposed a scheme to protect crypto wallets from quantum threats

cryptonews.ru19 dk önce

Weekly On-Chain Data Review: Robinhood Chain Explodes, FWA Goes Viral, Mantle Doubles Down on RWA

**Chain Data Weekly Digest: Vault Regulation, Robinhood Memecoin Surge, and FWA's NFT Gamble** * **Vault Managers Face SEC Scrutiny:** SEC Commissioner Hester Peirce warned that some DeFi Vault strategies could trigger investment advisor regulations. This may lead to licensing requirements, potentially sidelining smaller managers while bringing more traditional finance firms on-chain. The industry debates whether Vaults are purely code-driven or resemble discretionary portfolio management. * **Robinhood Chain's Memecoin-Led Boom:** Despite its initial RWA focus, Robinhood Chain has seen explosive early growth driven by memecoin trading and launchpads, which now dominate its DEX volume. The chain facilitates memecoin trading via tokenized stock pairs. It boasts over $800M in on-chain assets, $5B in stablecoin market cap, and strong fee revenue, positioning it as a consumer trading hub. * **FWA Revives NFT Activity with a Gamble:** The Fake World Assets (FWA) protocol, a gachapon-style system on Ethereum where users pay to randomly win deposited NFTs, has rapidly captured 10% of Ethereum's mainnet gas consumption in its first week. It demonstrates how simple, consumer-facing mechanics can reignite NFT engagement, attracting a broad user base. * **CEX Consolidation & DEX Growth:** The closures of BitMEX and BitMart highlight intense central exchange (CEX) competition and consolidation. Meanwhile, the DEX/CEX spot trading volume ratio hit a record high of 24.3% in July, signaling a shift of trading activity and innovation to on-chain venues. * **Mantle's RWA Focus at 3 Years:** Celebrating its third anniversary, Mantle Network is solidifying its role as a "full-stack distribution layer" for tokenized real-world assets (RWA). It ended Q2 with $1.2B in DeFi TVL, $955M in stablecoin market cap, and a growing suite of native RWA trading infrastructure like Fluxion and xChange.

marsbit29 dk önce

Weekly On-Chain Data Review: Robinhood Chain Explodes, FWA Goes Viral, Mantle Doubles Down on RWA

marsbit29 dk önce

İşlemler

Spot
活动图片