Making the Forbes Cover: Why Has It Become a Curse for Crypto Titans?

比推2026-02-06 tarihinde yayınlandı2026-02-06 tarihinde güncellendi

Özet

The article explores the so-called "Forbes Cover Curse" in the cryptocurrency industry, where major figures featured on the magazine’s often coincide with market peaks followed by sharp downturns. It highlights three key examples: - Binance’s CZ appeared in February 2018 when Bitcoin was around $7,600. Soon after, BTC fell 58%. - FTX’s SBF was featured in October 2021 near Bitcoin’s then-all-time high. Thirteen months later, FTX collapsed and SBF was sentenced to prison. - MicroStrategy’s Michael Saylor graced the cover in January 2025 with BTC above $104,000. Within a year, the price dropped 40%, and his company faced billions in unrealized losses. The piece references the “magazine cover indicator” — a classic Wall Street concept suggesting that when a trend makes it to the cover of a major publication, it’s often near its end. The author argues that Forbes covers are not the cause of the decline but a symptom of market euphoria and overexposure. A notable exception was Justin Sun’s feature in March 2025, after which Bitcoin continued to rally. However, the frequency of crypto-related covers itself was seen as a signal of overheating optimism. The conclusion urges caution: when mainstream media celebrates crypto success and public excitement peaks, it may be time to consider reducing exposure — because “bull markets end on magazine covers.”

Author: Curry, Deep Tide TechFlow

Original Title: Forbes Editorial Department, the Most Accurate Short Signal in Crypto?

Bitcoin recently plunged to $60,000, marking its largest single-day drop since the FTX collapse.

Michael Saylor's company, Strategy (formerly MicroStrategy), holds 713,000 bitcoins with an average cost of $76,052. As of last night, the unrealized loss reached $6.5 billion. The stock price has fallen from a peak of $457 last year to $110, wiping out over three-quarters of its value.

However, a year ago, Saylor graced the cover of the renowned magazine Forbes. The headline read:

"The Bitcoin Alchemist." At that time, Bitcoin was priced at $104,000, and Saylor's net worth was $9.4 billion.

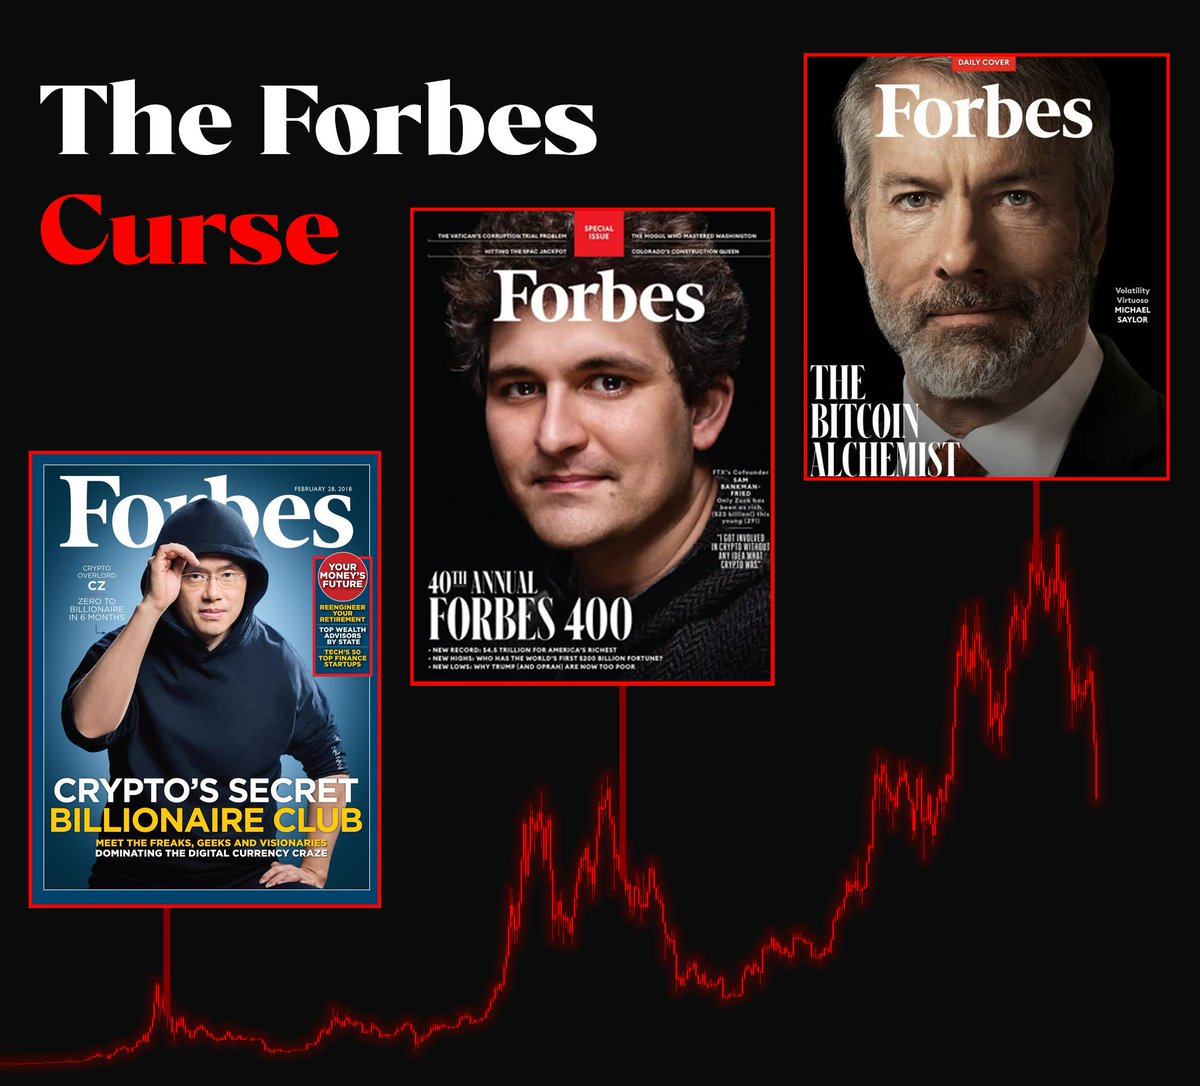
Now, a chart circulating on Twitter lines up three Forbes covers with Bitcoin's price chart below. Each cover perfectly marks the start of a sharp decline.

Of these three individuals, one has been to prison, one is currently in prison, and the third just lost $6.5 billion.

The Cover, Captured at the Peak of Hype

The first crypto figure to appear on Forbes' cover was CZ.

In February 2018, Forbes featured a cover titled "Crypto's Secret Billionaire Club," CZ stood in the center, hoodie up, exuding a rugged aura. The subtitle read:

From zero to billionaire in just 6 months.

At that time, Bitcoin had just fallen from nearly $20,000 at the end of 2017 to around $7,600. Forbes estimated CZ's net worth to be at least $1.1 billion. Binance, only six months old, was already the world's largest exchange by trading volume.

After the cover was released, Bitcoin briefly rebounded to $10,000. Then, it went nowhere but down.

By December 2018, Bitcoin had dropped to $3,156. From the day the cover was published, the decline was:

58%.

CZ's later story is well-known. On Forbes' 2025 global billionaires list, CZ's net worth was $62.9 billion, ranking first in the crypto industry.

But he hasn't been on the cover since.

The second crypto figure to appear on Forbes' cover was Sam Bankman-Fried.

In October 2021, Forbes released its 40th Forbes 400 Richest Americans list, featuring SBF on the cover. Under 30 years old, with a net worth of $26.5 billion, he was the 41st richest person in the U.S.

On the cover, he wore his signature gray T-shirt, with curly hair, looking like a college student who had just pulled an all-nighter playing League of Legends.

In hindsight, the magazine's tone was surreal. Forbes called him "the most powerful person in crypto," portraying him as a blend of Wall Street and Silicon Valley, building an exchange while donating to charity.

When the cover was released, Bitcoin was around $60,000, just a step away from its then-all-time high of $69,000.

Thirteen months later, FTX collapsed.

SBF had misappropriated over $8 billion in customer funds to cover losses at his other company, Alameda Research. In November 2022, users rushed to withdraw, and FTX couldn't meet the demand. Within a week, it went from the world's third-largest exchange to a bankrupt company. Bitcoin plummeted from $20,000 to $16,000.

Ultimately, SBF was arrested in his luxury apartment in the Bahamas.

Found guilty on all seven charges, he was sentenced to 25 years. Forbes later created a "30 Under 30 Hall of Shame," with SBF prominently featured.

From cover to handcuffs:

13 months.

The third was Michael Saylor.

On January 30, 2025, Forbes featured him on the cover with the title "The Bitcoin Alchemist." Bitcoin had just broken through $100,000, and Saylor's net worth surged from $1.9 billion the previous year to $9.4 billion, nearly quintupling. His company MicroStrategy's stock had risen 700% in a year and was newly included in the Nasdaq 100 index.

The Forbes piece included a detail:

On New Year's Eve, Saylor threw a 500-person party at his estate in Miami. Dancers waved orange Bitcoin glow balls, and outside waited a 154-foot yacht named Usher, ferrying institutional investors and crypto bigwigs to the event.

At the time, Saylor told Forbes:

"We've placed a crypto reactor in the middle of the company, sucking in capital and spinning it. Volatility drives everything." This statement was, of course, sincere. Saylor's alchemy boils down to one thing: issuing debt to buy Bitcoin.

When the Forbes cover was released, Bitcoin was at $104,000. One year and six days later, it's at $63,000. A decline of:

40%.

Saylor said on an earnings call that Strategy has built a "digital fortress."

The last crypto mogul to call his company a "fortress" was SBF. That was in June 2022. Five months later, FTX filed for bankruptcy.

The Cover: Both Praise and Curse

Wall Street has an old concept called the "magazine cover indicator":

When a trend makes it to the cover of a mainstream magazine, the trend is usually at its end.

The reasoning is simple. Forbes editors aren't prophets; like all retail investors, they only notice a story when it's at its most hyped.

The moment a magazine deems "someone in some industry worthy of a cover" is precisely the moment market frenzy peaks.

The cover isn't the cause of the curse; it's a symptom of the bubble.

However, there was one brief exception to this rule.

Last March, Justin Sun graced the Forbes cover with the title "The Crypto Billionaire Who Made the Trump Family $400 Million."

When the cover came out, Bitcoin was at $87,000. It didn't crash; instead, it rallied to an all-time high of $126,000 by October.

Did the curse fail?

Not entirely. When Sun appeared on the cover, it was only two months after Saylor's feature. One cover in January, another in March—the密集 appearance of crypto figures on mainstream magazine covers was itself a signal. It indicated the industry's narrative had become so hot that even Forbes editors felt one issue wasn't enough.

When covers start appearing in clusters, in hindsight, there might be a checklist of bull market top symptoms:

Forbes covers, taxi drivers discussing crypto, relatives asking how to open an account... If two out of three signals appear, it's time to reconsider your positions.

So, the real question isn't "Is the Forbes cover accurate?" but rather:

When everyone around you is telling the same story, when the story is so good even non-traders have heard of it, when mainstream media starts deifying figures in an industry...

Are you the one still buying, or the one already selling?

Bull markets don't end in panic. They end on the cover.

It's just that the cover stars may change, but the long bear market is always my bill to pay.


Twitter:https://twitter.com/BitpushNewsCN

Bitpush TG Group:https://t.me/BitPushCommunity

Bitpush TG Channel: https://t.me/bitpush

Original link:https://www.bitpush.news/articles/7609729

Trend Kriptolar

İlgili Sorular

QWhat is the 'magazine cover indicator' mentioned in the article, and how does it relate to the cryptocurrency market?

AThe 'magazine cover indicator' is an old Wall Street concept suggesting that when a trend makes the cover of a mainstream magazine, it has often reached its peak. In the context of the cryptocurrency market, it means that when a crypto figure like CZ, SBF, or Michael Saylor is featured on the Forbes cover, it signals the top of market euphoria and is often followed by a significant price decline.

QWhich three crypto figures were featured on Forbes covers, and what were the consequences for the market after their features?

AThe three crypto figures featured were CZ (2018), SBF (2021), and Michael Saylor (2025). After CZ's feature, Bitcoin fell 58%; after SBF's feature, FTX collapsed and Bitcoin dropped sharply; and after Saylor's feature, Bitcoin fell 40% from its high.

QWhy did the Forbes cover 'curse' seemingly not affect Justin Sun when he was featured in March?

AThe curse appeared not to affect Justin Sun immediately because his cover in March 2025 was followed by a continued bull run to a new all-time high of $126,000 in October. However, the article suggests that the high frequency of crypto covers (Saylor in January, Sun in March) was itself a symptom of peak market euphoria, a sign that the bull market was nearing its end.

QAccording to the article, what are some signals that might indicate the top of a bull market in cryptocurrency?

ASignals of a market top include a crypto figure being featured on the Forbes cover, taxi drivers talking about crypto, and relatives asking how to open a trading account. The article suggests that if two of these three signals appear, it might be time to reconsider one's investment position.

QWhat was the common outcome for the crypto billionaires who appeared on the Forbes cover, as described in the article?

AThe common outcome was a significant personal or professional downturn coinciding with a major market crash. CZ faced legal issues (though his wealth later grew), SBF was arrested and sentenced to 25 years in prison, and Michael Saylor's company faced massive paper losses on its Bitcoin holdings after the price declined.

İlgili Okumalar

STAR 50 Soars 10.73%, Why Did A-Shares Stage a "V-Shaped Reversal"?

After a prolonged decline, the Chinese A-share market staged a strong rally on July 21. The STAR 50 index surged 10.73%, its largest single-day gain in nearly a year, leading a broad-based "V-shaped" reversal. The Shanghai Composite Index rose 1.79%, the Shenzhen Component Index gained 4.81%, and the ChiNext Index jumped 7.05%. Total market turnover reached 2.97 trillion yuan, an increase of 256.1 billion yuan from the previous session, with over 3,100 stocks advancing. The semiconductor sector spearheaded the rebound, with related ETFs posting significant gains. Analysts attribute the surge to three converging factors. First, coordinated capital inflows from "national team" institutions, insurance funds, listed company buybacks, and fund house self-purchases have bolstered market liquidity and confidence. Second, supportive policy signals, including commitments from regulators to ensure stable market operations, provided a favorable backdrop. Third, a stabilization and recovery in overseas markets, notably South Korea, created a positive external environment. Institutions suggest the most severe panic selling phase for the tech sector has likely passed, following a significant digestion of crowded positions and leveraged funds. While short-term volatility may persist, the medium to long-term outlook remains underpinned by enduring trends like AI computing demand expansion and semiconductor localization. The market's focus now shifts to the sustainability of supportive fund flows, earnings reports, and upcoming catalysts from the global AI industry chain.

marsbit11 dk önce

STAR 50 Soars 10.73%, Why Did A-Shares Stage a "V-Shaped Reversal"?

marsbit11 dk önce

U.S. Tech Momentum Stocks Post Largest Single-Day Gain Ever, But Is the Plunge Over?

US tech momentum stocks staged a sharp rebound on Tuesday (July 21st). Morgan Stanley's TMT Momentum Factor surged over 12%, marking its largest single-day gain on record, exceeding even peaks from the 2000 dot-com bubble. Key momentum indices from Goldman Sachs also posted their strongest daily performances in years. The rally was led by semiconductors, with the Philadelphia Semiconductor Index jumping 4.6%. This rebound followed three consecutive down days and a cumulative 33% plunge in momentum stocks, one of the steepest drawdowns since the dot-com era. Analysts attribute the surge largely to a short squeeze. Heavy selling had pushed high-beta momentum stocks into deeply oversold territory, forcing many short sellers, particularly in Asia, to cover their positions, creating a self-reinforcing buying spiral. However, the rebound's internals appear weak. Trading volume was notably low, and advancing stocks still lagged decliners on the S&P 500, indicating a narrow, concentrated rally rather than broad market participation. Diverging views emerge on the outlook. BTIG warns the bounce has hit key resistance and recommends selling into strength, citing extreme volatility and historical parallels to past market tops. Conversely, Goldman Sachs and UBS believe the momentum unwind is nearing its end, suggesting it may be time to gradually add exposure, as positioning has been significantly reduced. They caution, however, that high volatility warrants a measured approach, potentially using defined-risk strategies. The upcoming earnings season, particularly reports from major tech firms like Alphabet, is seen as a critical test for the rally's sustainability. Simultaneously, bond markets flashed a warning, with yields rising partly due to spiking oil prices. Analysts note that if long-term Treasury yields break decisively higher, it could pose a significant headwind for equities, especially growth stocks.

marsbit18 dk önce

U.S. Tech Momentum Stocks Post Largest Single-Day Gain Ever, But Is the Plunge Over?

marsbit18 dk önce

U.S. Tech Momentum Stocks Record Largest Single-Day Gain Ever, but Has the Rout Ended?

U.S. tech momentum stocks staged a dramatic rebound on Tuesday, July 21st. Key momentum indices like the Morgan Stanley TMT Momentum Factor and Goldman Sachs' High Beta Momentum Long Index posted historic or near-historic single-day gains, fueled largely by semiconductor stocks. This sharp rally followed a severe three-day sell-off that saw momentum stocks plunge 33%, marking one of the steepest pullbacks since the dot-com bubble. Analysts attribute the bounce primarily to a short squeeze, as forced covering from over-leveraged traders, particularly in Asia, created a buying spiral. However, the rally's health is questioned due to weak market breadth—overall trading volume was low, and decliners outnumbered advancers in the S&P 500 despite the index's gain—suggesting a narrow, concentrated surge rather than broad recovery. Opinions on the sustainability diverge. BTIG strategists warn the rebound has hit key resistance levels, citing extreme volatility and historic stock dispersion as signs of an ongoing broader correction, and recommend selling into strength. Conversely, Goldman Sachs and UBS view the aggressive momentum unwinding as nearing its end, noting reduced positioning and a lack of new fundamental catalysts. They suggest the sell-off presents a selective opportunity to add exposure, albeit cautiously and gradually using defined-risk strategies. The immediate trajectory hinges on the ongoing earnings season, with market focus on Alphabet's capital expenditure guidance for AI investment clarity. Meanwhile, bond markets present a risk, with rising Treasury yields—potentially heading toward 5.5%—and widening credit spreads for mega-cap tech companies posing a threat to equity valuations. The combination of technical factors, earnings results, and macro conditions leaves the durability of the rebound in doubt.

链捕手20 dk önce

U.S. Tech Momentum Stocks Record Largest Single-Day Gain Ever, but Has the Rout Ended?

链捕手20 dk önce

Long-Divided Must Unite, Long-United Must Divide: When L1 Becomes Its Own Rollup, What Is Ethereum's Endgame?

"The Inevitable Cycle: When L1 Becomes Its Own Rollup – What is Ethereum's Endgame?" For years, the Ethereum community grappled with concerns that L2s were fragmenting the ecosystem and eroding L1's value. While L2s provided cheaper execution, they also splintered liquidity and the unified user experience of a single chain. This has prompted a fundamental reassessment of the relationship between L1 and L2. Ethereum's roadmap is evolving. The "Scale" initiative merges L1 and L2 expansion into a holistic framework. L1 itself is advancing with higher gas limits, statelessness, and zkEVM verification, no longer content to be just a low-throughput settlement layer. Consequently, the primary value proposition of L2s is shifting from merely providing cheap blockspace to offering L1 cannot easily provide: application-specific optimizations, privacy features, and flexible governance models. L2s are becoming a spectrum of execution environments with varying degrees of security inheritance from Ethereum. A critical challenge in this multi-chain future is interoperability. The vision is to make Ethereum "feel like one chain again." This relies on advancements in native account abstraction (like EIP-7702) and intent-based architectures (Open Intents Framework), where users declare desired outcomes, and solvers handle the complex cross-chain execution. Furthermore, shortening Ethereum's finality time from minutes to seconds is crucial, as it underpins trust between chains for bridges, stablecoins, and cross-chain applications. Perhaps the most provocative idea is that Ethereum L1 itself could become a form of "its own Rollup." As zkEVM and proof systems mature, high-performance nodes could execute transactions and generate validity proofs. Regular validators would then verify these proofs instead of re-executing all transactions. This blurs the traditional L1/L2 hierarchy, making "Rollup" more of a general execution-verification architecture. Native Rollup aims to integrate L2 validation more directly into the Ethereum protocol, allowing L2s to inherit L1's security more fully and move away from reliance on security councils. In the end, L2s are not destined to replace L1 or be made obsolete by it. The likely future is a unified system where diverse execution environments—each optimized for specific use cases like DeFi, gaming, or privacy—coexist. They will share a common foundation of security, liquidity, and verifiable state, seamlessly connected to restore a cohesive user experience. The next phase for Ethereum is not just about scaling through separation, but about intelligently reintegrating what was separated back into a coherent whole.

链捕手37 dk önce

Long-Divided Must Unite, Long-United Must Divide: When L1 Becomes Its Own Rollup, What Is Ethereum's Endgame?

链捕手37 dk önce

İşlemler

Spot

Popüler Makaleler

T Nasıl Satın Alınır

HTX.com’a hoş geldiniz! Threshold Network Token (T) satın alma işlemlerini basit ve kullanışlı bir hâle getirdik. Adım adım açıkladığımız rehberimizi takip ederek kripto yolculuğunuza başlayın. 1. Adım: HTX Hesabınızı OluşturunHTX'te ücretsiz bir hesap açmak için e-posta adresinizi veya telefon numaranızı kullanın. Sorunsuzca kaydolun ve tüm özelliklerin kilidini açın. Hesabımı Aç2. Adım: Kripto Satın Al Bölümüne Gidin ve Ödeme Yönteminizi SeçinKredi/Banka Kartı: Visa veya Mastercard'ınızı kullanarak anında Threshold Network Token (T) satın alın.Bakiye: Sorunsuz bir şekilde işlem yapmak için HTX hesap bakiyenizdeki fonları kullanın.Üçüncü Taraflar: Kullanımı kolaylaştırmak için Google Pay ve Apple Pay gibi popüler ödeme yöntemlerini ekledik.P2P: HTX'teki diğer kullanıcılarla doğrudan işlem yapın.Borsa Dışı (OTC): Yatırımcılar için kişiye özel hizmetler ve rekabetçi döviz kurları sunuyoruz.3. Adım: Threshold Network Token (T) Varlıklarınızı SaklayınThreshold Network Token (T) satın aldıktan sonra HTX hesabınızda saklayın. Alternatif olarak, blok zinciri transferi yoluyla başka bir yere gönderebilir veya diğer kripto para birimlerini takas etmek için kullanabilirsiniz.4. Adım: Threshold Network Token (T) Varlıklarınızla İşlem YapınHTX'in spot piyasasında Threshold Network Token (T) ile kolayca işlemler yapın.Hesabınıza erişin, işlem çiftinizi seçin, işlemlerinizi gerçekleştirin ve gerçek zamanlı olarak izleyin. Hem yeni başlayanlar hem de deneyimli yatırımcılar için kullanıcı dostu bir deneyim sunuyoruz.

634 Toplam GörüntülenmeYayınlanma 2024.12.10Güncellenme 2026.06.02

T Nasıl Satın Alınır

Tartışmalar

HTX Topluluğuna hoş geldiniz. Burada, en son platform gelişmeleri hakkında bilgi sahibi olabilir ve profesyonel piyasa görüşlerine erişebilirsiniz. Kullanıcıların T (T) fiyatı hakkındaki görüşleri aşağıda sunulmaktadır.

活动图片