LayerZero rallies 11% as market activity overheats: Can ZRO push past $2.28?

ambcrypto2026-03-17 tarihinde yayınlandı2026-03-17 tarihinde güncellendi

Özet

LayerZero (ZRO) surged over 11% in 24 hours, with trading volume jumping more than 140%, pushing its price toward the key $2.286 resistance level. The token recovered from a February low below $1.60, showing a sequence of higher lows and improved trend stability. Technical indicators like the positive MACD crossover and green histogram bars suggest growing buying momentum. However, spot market data signals overheating, with high speculative activity and persistent taker sell dominance creating short-term imbalance. Derivatives data shows higher short liquidations, amplifying volatility. While buyer interest is strong, overcoming the $2.286 barrier remains uncertain due to potential selling pressure. A breakout depends on sustained demand versus speculative activity.

LayerZero rallied more than 11% in the last 24 hours as trading activity intensified and 24-hour volume jumped over 140%, pushing ZRO toward key resistance.

Rising participation has pushed ZRO back into focus across spot and derivatives markets. Buyers have returned aggressively after weeks of choppy consolidation.

At the time of press, LayerZero [ZRO] traded at around $2.20, reflecting renewed speculative interest. Volume expansion usually signals strong participation; however, overheated conditions sometimes follow rapid spikes.

Traders therefore continue monitoring whether this surge reflects sustained demand or short-term speculation.

ZRO climbs toward major resistance barrier

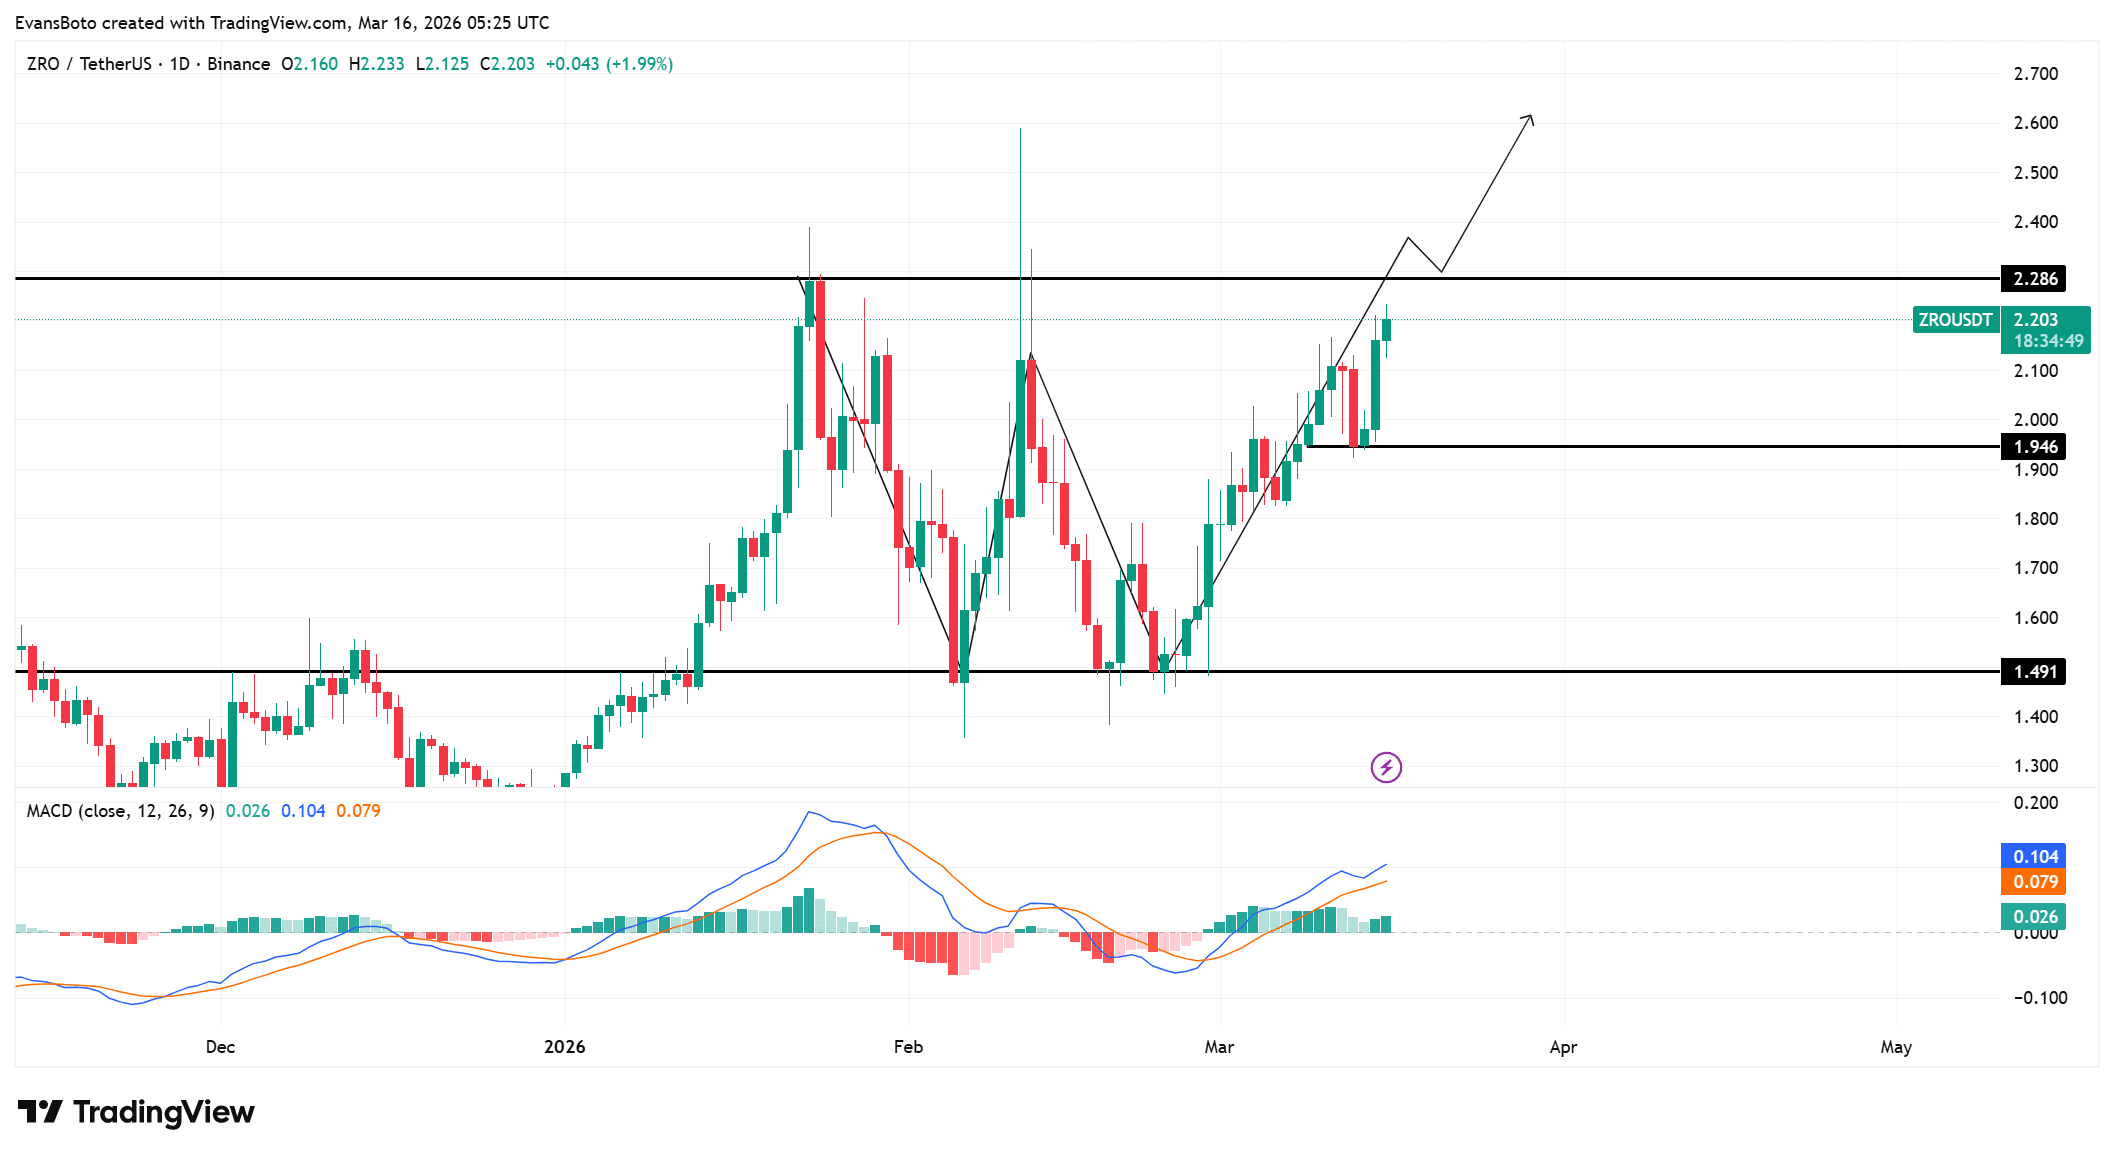
Recent price action shows LayerZero recovering strongly from the $1.491 support level and steadily advancing toward the $2.286 resistance zone.

Buyers regained control after the February decline pushed the price briefly below $1.60. Since then, a sequence of higher lows has developed across the daily chart.

This structure reflects improving trend stability. Price has already reclaimed the intermediate $1.946 level, which now acts as a support pivot.

However, the $2.286 region represents a major barrier where previous rallies stalled earlier this year. Sellers previously defended that zone aggressively.

If buyers maintain pressure near current levels, price could attempt another breakout toward higher targets.

The MACD line currently sits around 0.104, while the signal line remains near 0.079, confirming a positive crossover.

Histogram bars have also turned green near 0.026, showing strengthening buying pressure over recent sessions. This configuration normally appears during early trend recovery phases.
Source: TradingView

Spot market overheating raises caution signals

While price strength has attracted buyers, Spot market data suggests traders have started pushing activity into overheated territory.

The Spot Volume Bubble Map currently signals overheating conditions following the rapid surge in trading activity. Large bursts of volume often appear when speculative interest intensifies.

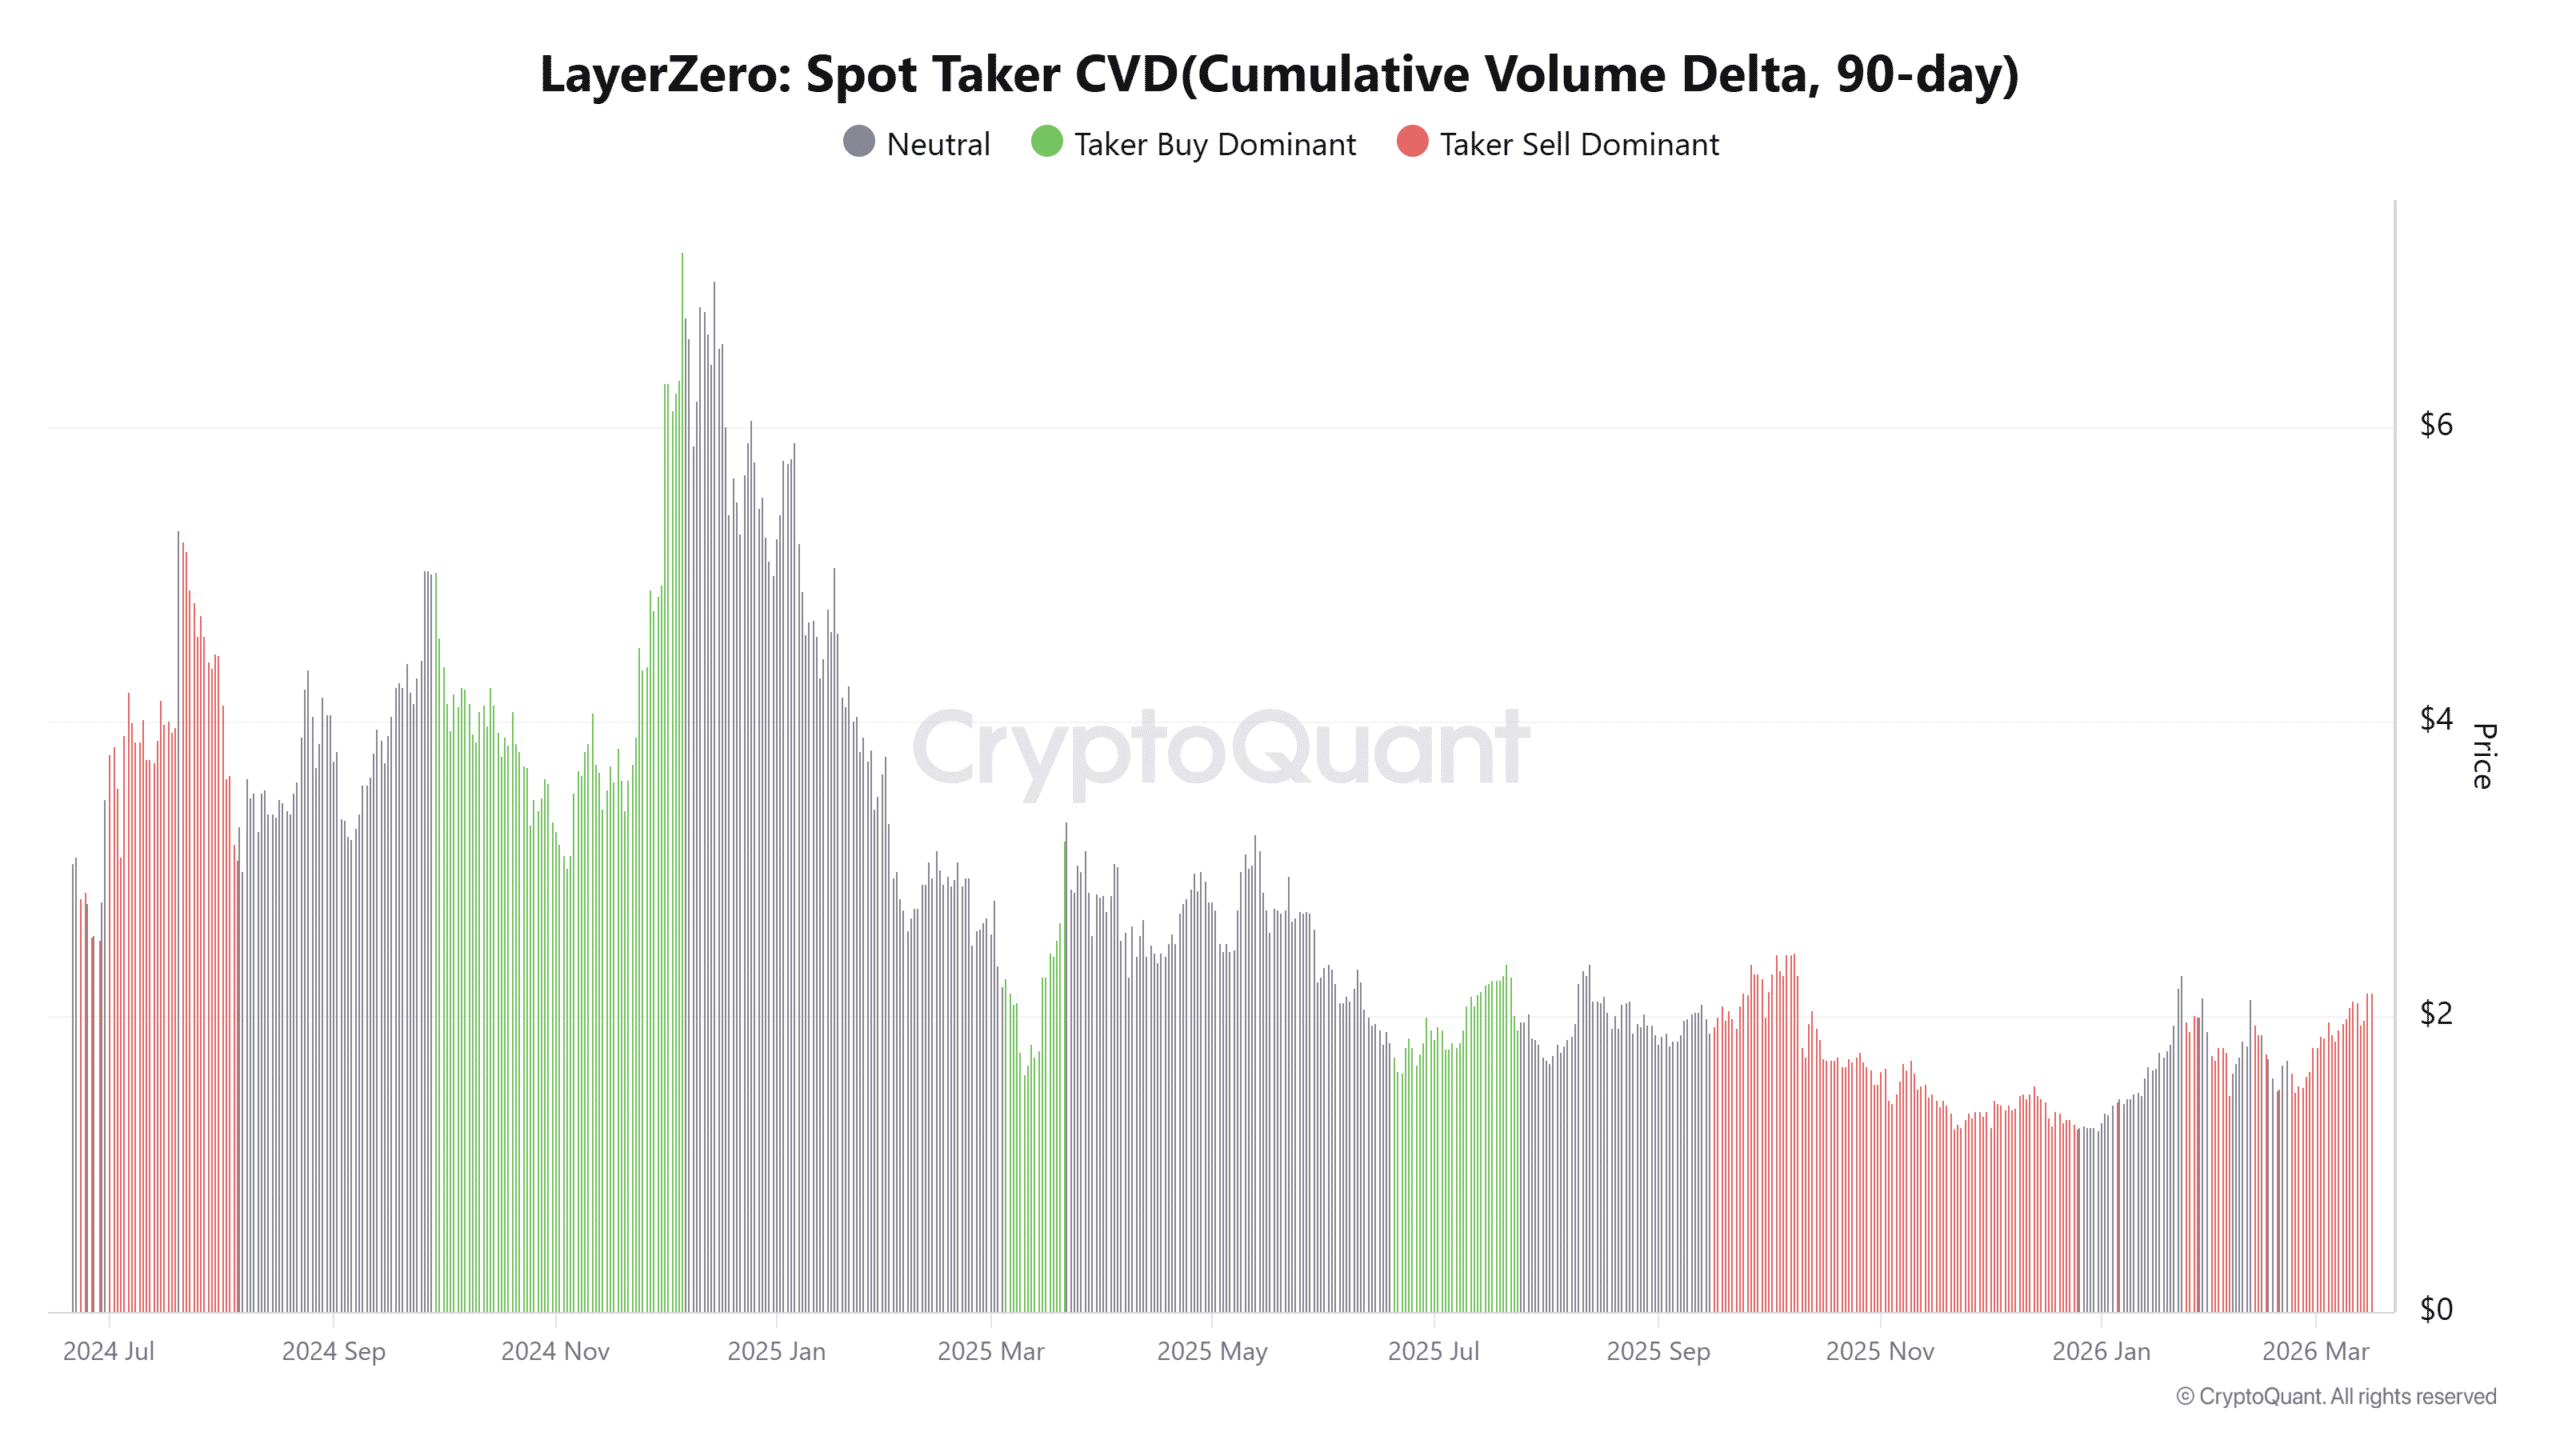
However, the 90-day Spot Taker CVD continues reflecting taker sell dominance, indicating that market sell orders still outweigh aggressive buying.

This imbalance creates a conflicting signal for short-term direction. Price rises while sellers remain active, which sometimes leads to brief volatility spikes.
Source: CryptoQuant

Short liquidations hint at growing volatility

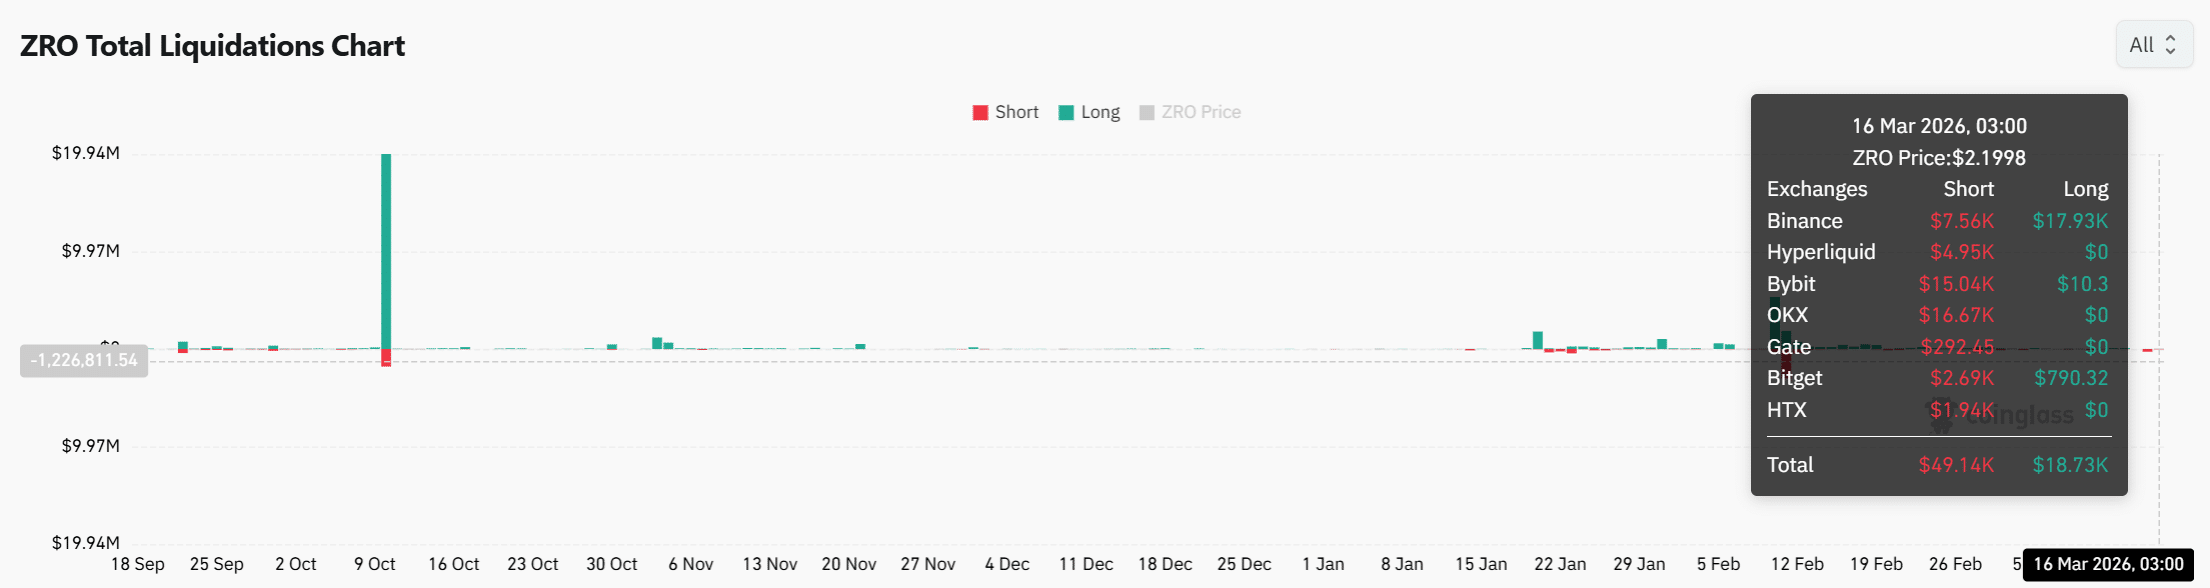
Derivatives data has also started reflecting the renewed price expansion across LayerZero markets. The total liquidation chart shows short positions absorbing slightly higher pressure during the latest move.

At the latest data point, short liquidations reached about $49.14K, while long liquidations remained near $18.73K.

This imbalance shows that rising prices have forced several short traders to close positions. Forced exits usually amplify volatility because liquidations trigger additional buying pressure.

Exchanges such as OKX and Bybit have recorded some of the largest short liquidations. However, the overall scale of liquidations remains moderate compared with earlier spikes.
Source: CoinGlass

LayerZero’s rally has pushed the price close to the $2.286 resistance, while indicators and liquidation data suggest strengthening market activity.

However, overheating spot signals and persistent taker sell dominance introduce short-term uncertainty.

If buyers sustain pressure near current levels, ZRO could challenge resistance again. However, heavy selling activity may still slow the advance before a confirmed breakout.


Final Summary

  • Growing participation has revived LayerZero interest; however, resistance pressure could still challenge sustained upside continuation soon.
  • Rising volatility and strong buyer activity could sustain ZRO’s recovery if resistance pressure weakens across markets.


İlgili Sorular

QWhat was the percentage increase in LayerZero (ZRO) over the last 24 hours and what key resistance level is it approaching?

ALayerZero rallied more than 11% in the last 24 hours and is approaching the key resistance level of $2.286.

QWhat technical indicator is mentioned as confirming a positive crossover and what does this signal?

AThe MACD indicator is mentioned, with the MACD line at 0.104 and the signal line at 0.079, confirming a positive crossover which is a signal that often appears during early trend recovery phases.

QAccording to the Spot Volume Bubble Map, what condition is the market signaling and what does a 90-day metric show?

AThe Spot Volume Bubble Map is signaling overheating conditions, while the 90-day Spot Taker CVD continues to reflect taker sell dominance, indicating that market sell orders still outweigh aggressive buying.

QWhat does the imbalance between short and long liquidations suggest about recent market activity?

AThe imbalance, with short liquidations at $49.14K and long liquidations at $18.73K, suggests that rising prices have forced short traders to close positions, which can amplify volatility by triggering additional buying pressure.

QWhat are the two potential outcomes for ZRO's price mentioned in the final summary regarding resistance?

AThe final summary states that if buyers sustain pressure, ZRO could challenge the $2.286 resistance again, but heavy selling activity may slow the advance before a confirmed breakout occurs.

İlgili Okumalar

Why Bitcoin Holds Above $64,000 After Fed's Hard Pause

**Bitcoin Stabilizes Near $64,000 Following Hawkish Fed Pause** The cryptocurrency market, led by Bitcoin, remained stable around $64,000 despite a volatile reaction to the latest U.S. Federal Reserve meeting. The Fed paused interest rates but signaled a hawkish stance, with three committee members voting for an increase—the highest dissent since 2016. This limits risk appetite but hasn't triggered panic selling. Key market highlights include Bitcoin ETFs seeing a net inflow of $32.1 million, breaking a streak of outflows, while Ethereum ETFs experienced outflows of $18.65 million. Liquidations affected about 90,000 traders. Technically, Bitcoin finds support around $63,000-$63,500, with major resistance near $66,000. While its price is about 49% below its all-time high, institutional demand via ETFs and the absence of mass capitulation support a potential recovery scenario in the second half of the year. Major altcoins showed mixed movements, with Solana attracting capital while Ethereum faced selling pressure despite strong on-chain metrics like a growing staking queue. Regulatory news took a pause as the U.S. Senate delayed the CLARITY Act vote until at least autumn. For the final trading day of July, U.S. inflation and consumer spending data will be crucial. Bitcoin's key levels to watch are $63,000 support and $66,000 resistance. Sustained ETF inflows and Bitcoin holding above $63,000 are seen as positive signs for a potential market recovery later in the year.

cryptonews.ru1 saat önce

Why Bitcoin Holds Above $64,000 After Fed's Hard Pause

cryptonews.ru1 saat önce

Participants in XRP Fraud Scheme That Stole $9 Million from 71 Investors Arrested

South Korean police have arrested three individuals accused of operating a fraudulent investment platform that stole approximately 3.4 million XRP (worth about $9 million) from 71 investors between October 16 and 23. The suspects promoted the site Fxrpntwork.com through blogs, online articles, and YouTube videos, promising guaranteed principal and monthly returns of 1.5% to 1.8%. Investors were instructed to transfer XRP from Korean exchanges to overseas platforms and then to wallets controlled by the group before the site was shut down. The scammers copied the branding of legitimate projects Flare Network and FXRP to appear credible. Authorities warn that such impersonation frauds, which use familiar branding and urgent promises of guaranteed profits, are a common red flag. Legitimate companies do not solicit cryptocurrency transfers through unsolicited promotions. Seoul police have issued an Interpol Red Notice for a fourth suspect abroad and are investigating others involved in creating and promoting the fraudulent website. While investigators froze 17.3 billion won in assets, approximately 10 billion won was moved during the probe, with wallet analysis revealing transfers totaling 27.3 billion won, suggesting there may be additional unidentified victims and accomplices. The case underscores the organized, cross-border nature of crypto investment fraud.

cryptonews.ru1 saat önce

Participants in XRP Fraud Scheme That Stole $9 Million from 71 Investors Arrested

cryptonews.ru1 saat önce

İşlemler

Spot
活动图片




