In 2025, the total market capitalization of the crypto market repeatedly hit new all-time highs, with the scale of on-chain stablecoins and asset tokenization continuing to expand. The flow of funds between on-chain and centralized trading platforms accelerated significantly. In this environment of high volatility and high supply, the ability of platforms to cover and screen new assets, as well as the price discovery and pricing trajectory after asset listing, have become critical points for observing liquidity absorption efficiency and changes in risk appetite. Based on a sample of 447 newly listed assets on Gate's spot market in 2025, this article provides a statistical review of multiple time windows from 5 minutes to 30 days after listing, using metrics such as the proportion of assets that increased, the average increase of rising samples, and the median to depict overall performance and its structural differences.
Overall Sample Overview: Listing Structure and First-Day Return Distribution
In terms of supply quantity, a total of 447 new assets were listed on Gate's spot market in 2025, including 318 initial listings (including 28 exclusives) and 129 non-initial listings, with initial listings accounting for approximately 71%. The platform's new asset supply primarily came from initial listing projects, rather than secondary listings of tokens already available on other platforms.
Using the opening price at listing as a unified benchmark, approximately 54.8% (245/447) of assets remained above the opening price 24 hours after listing. Among the rising samples, the average increase over 24 hours reached 635%; however, when observing the median value of the full sample (including declining projects), the median 24-hour increase was 7.57%, which further narrowed to 3.71% after excluding extreme fluctuations (increases >1,000% or declines <-90%). This contrast reflects significant excess return potential within the first 24-hour window, while also indicating that high-multiple increases are concentrated in a small number of tokens, with the overall return distribution exhibiting typical long-tail characteristics.
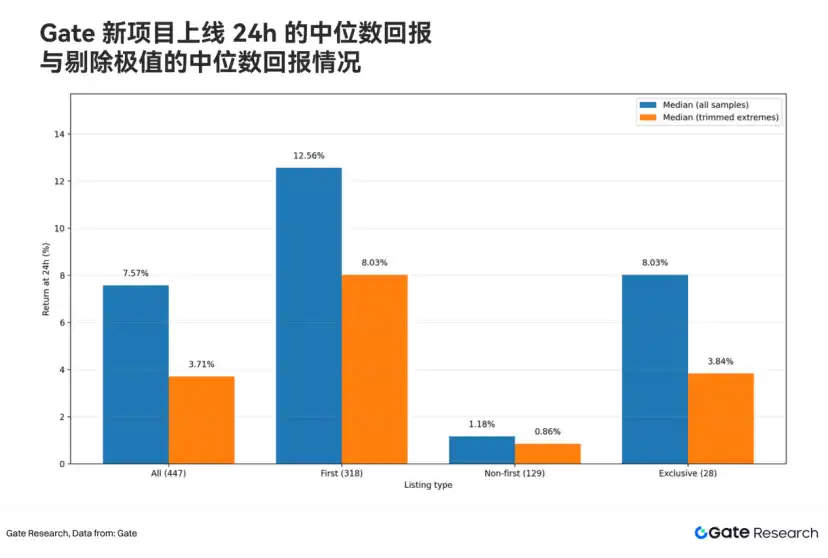
Further breaking down by listing type, there is a clear difference in performance between initial and non-initial listings on the first day: the median increase for initial listing projects in the 24-hour window for the full sample was 12.56% (8.03% after excluding extremes), significantly higher than the 1.18% for non-initial listings (0.86% after excluding extremes). These differences are not only evident in the 24-hour window but also become more pronounced at finer early time points, forming clearer stratified return curves between different types.
Multiple Time Windows: Return Trajectories from 5 Minutes to 30 Days
Breaking down by time dimension, segmented statistics were conducted for Gate's new tokens at 5 minutes, 30 minutes, 1 hour, 12 hours, 24 hours, 72 hours, 7 days, and 30 days after listing:
1. Short-Term Windows Show Higher Positive Return Coverage
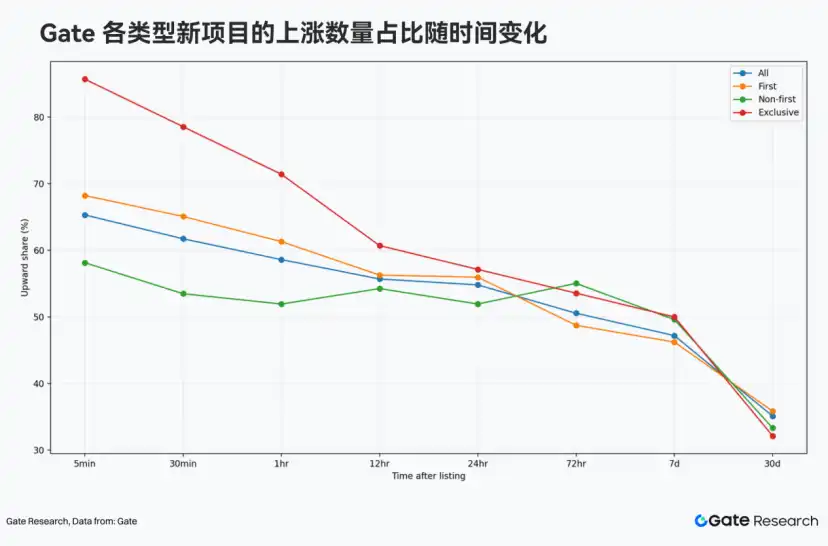
The 447 samples overall higher positive return coverage in short-term windows after listing, but this advantage diminishes as time extends.
Calculated for the full sample:
• 30 minutes: 276/447 increased, accounting for 61.74%
• 24 hours: 245/447 increased, accounting for 54.81%
• 72 hours: 226/447 increased, accounting for 50.56%
• 7 days: 211/447 increased, accounting for 47.20%
• 30 days: 157/447 increased, accounting for 35.12%
Overall, the proportion of increasing numbers exceeding half" mainly concentrated within 24 hours after listing; by around 72 hours, the proportion of increasing numbers was close to fifty-fifty; at the 30-day dimension, the number of increasing samples dropped to about one-third.
2. Significant Divergence in Median Returns Between Initial and Non-Initial Listings in Early Windows
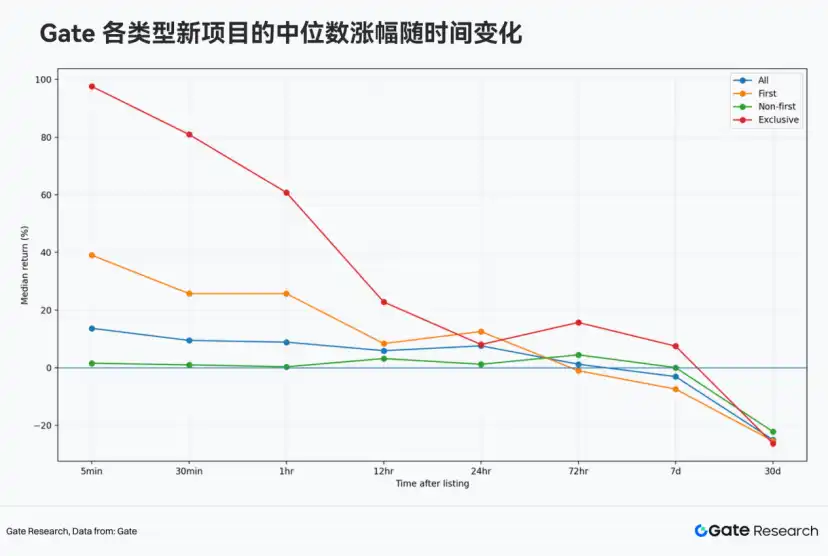
Looking at the time series of median returns, Gate's different types of new projects show clear stratification in the early windows after listing: initial listing projects, especially exclusive ones, maintain higher median return levels at multiple time points from 5 minutes to 24 hours; the median for non-initial listing projects overall stays closer to the zero axis. As the window extends to 72 hours and beyond, medians generally weaken and gradually converge.
Comparing median increases for the full sample versus initial and non-initial listing projects:
• 30 minutes: initial listings 25.69%, non-initial listings 0.98%
• 24 hours: initial listings 12.56%, non-initial listings 1.18%
There is also a gap in the number of increasing assets:
• 30 minutes: initial listings 65.09%, non-initial listings 53.49%
• 24 hours: initial listings 55.97%, non-initial listings 51.94%
It is evident that during the most critical price discovery window after asset listing, Gate's initial listing samples have a larger median return space, while non-initial listings are closer to "narrow fluctuations around the zero axis," particularly, Gate's exclusive listing projects show a higher positive return coverage: nearly 80% (22/28) increased within 30 minutes of opening, with a median increase of about 81%; in the 1-hour window, the median increase still exceeded 60%.
3. Around Three Days is the Key Turning Point from Overall Positive Returns to 'Only a Few Can Sustain Gains, Most Give Back or Weaken'
From the time series of the full sample median, the median increase in the 24-hour window is still positive (7.57%), but by 72 hours, it weakens significantly (median increase 1.20%, -0.49% after excluding extremes), meaning that around three days is close to the break-even line. Thereafter, entering the 7-day and 30-day windows, the median increases drop to -3.10% and -25.01% respectively (after excluding extremes: -5.72% and -24.12%), and the proportion of increasing projects also falls to 47.20% and 35.12%. These results indicate that the return structure of new tokens after listing does not show a linear continuation relationship; at around the three-day mark, the advantages of the price discovery phase gradually fade, and trend divergence and pullbacks among assets begin to dominate.
Initial, Exclusive, and Non-Initial Listings: Return Curve Divergence and Opportunity Density
From the data statistics across multiple time windows, it is clear that Gate's initial listing projects and non-initial listing projects exhibit different return curve patterns: initial listings are more likely to convert popularity into more visible increases and higher increase coverage, while non-initial listings are closer to relatively flat fluctuations around the zero axis. Behind this difference lies the systematic result of Gate's annual listing structure, project selection, and initial listing execution: initial listing projects not only constitute the main body of new supply in terms of quantity (318/447) but also更容易 form clearer market feedback during the most critical price discovery phase.
Within the initial listing system, exclusive listing projects further reinforce this characteristic: they are more like "curated samples" of Gate's initial listing capability, demonstrating higher positive return coverage and clearer price feedback in the early listing windows—exclusive projects have a positive return coverage of nearly 80% within 30 minutes of opening, with a median increase of about 81%, and over one-third of exclusive projects achieved a ≥100% increase within 30 minutes.
The significance of exclusive samples lies not only in the rise or fall of individual projects but also in their more direct reflection of Gate's comprehensive capabilities in project screening, initial listing execution, liquidity organization, and market heat capture—that is, the platform can not only provide new supply but also transform "new listings" into a process of trading, pricing, and wealth effect creation that can be quickly validated by the market.
Looking back at the trajectories of representative projects in 2025, Gate's initial listing system is not short of "dozens of times" wealth effect cases. From entry-type assets with超大 user and traffic bases, to technical narrative targets like AI infrastructure, to community culture-driven Meme assets, some initial listing projects completed rapid transitions from attention to trading heat to price revaluation in short cycles. Although high-multiple returns do not occur uniformly across all assets, exclusive projects within initial listings显然更容易 form strong market feedback, which precisely reflects Gate's screening efficiency, initial listing execution speed, and liquidity absorption capability for high-attention assets in critical windows.
1. Among assets with "超大 user scale and traffic entry," projects like Pi Network (PI) have extremely strong external attention and community foundations. After listing on Gate, PI increased nearly 60 times in 7 days. For the platform, the challenge with such assets is not just "whether to list," but also whether it can quickly absorb concentrated incoming trading demand, promote efficient price discovery within critical windows, and convert attention into tangible trading heat and wealth effects.
2. As the AI narrative continued to扩散 in 2025, moving from the application layer to the infrastructure layer, Gate continuously covered AI+Infra direction assets, forming a more complete listing structure between "流量型" and "技术型" assets. Taking early AI infrastructure potential targets like Unibase (UB) related to the x402 protocol as an example, its phased trend after listing on Gate showed characteristics of steady elevation, and it remained relatively stable and continued to rise during the market剧烈波动 on October 11, eventually reaching an ATH of $0.086 on October 30, an increase of over 500% from the opening price.
3. In a cycle where Crypto-native driven Meme and community culture accelerate segmentation, attention often exhibits high-frequency migration, explosive dissemination, and rapid differentiation. Projects represented by Mubarak (MUBARAK) and Useless (USELESS) have pricing logic that comes more from cultural symbols, dissemination efficiency, and the diffusion speed of community consensus. The platform's capability for such assets关键在于 whether it can respond quickly and absorb trading demand in a timely manner during the heat uptrend phase. After Gate listed MUBARAK in the early stage of heat, its single-day increase once exceeded 120%. Behind this is Gate's敏锐把握 of the rhythm of the attention economy—keeping up and catching up during heat uptrends, also allowing the initial listing pool to maintain stronger participation and higher opportunity density in narrative rotations.
Summarizing the 447 new asset samples listed on Gate's spot market in 2025, the data presents three relatively clear conclusions: First, in a market environment of high volatility and high supply, Gate maintained a high density of new asset supply, with initial listings accounting for about 71%, making the initial listing pool the main structure of the platform's new supply; second, from the critical price discovery windows of 5 minutes to 24 hours, the median returns and positive return coverage of initial and exclusive samples are more prominent, indicating that Gate not only lists quickly but also更容易 forms perceptible wealth effects in early windows; third, when extended to 72 hours, 7 days, and 30 days, the median increases of samples gradually weaken and enter a differentiation interval, suggesting that new token return structures are not linearly continuous, but this恰恰 highlights the screening and execution value of the platform in early windows—in a cycle where narrative rotation accelerates and attention migrates frequently, Gate's initial and exclusive system can more easily convert attention into trading heat and pricing results, and form stronger wealth effects and market responses on some high-potential projects.
Gate Research Institute is a comprehensive blockchain and cryptocurrency research platform, providing readers with in-depth content, including technical analysis, hot spot insights, market reviews, industry research, trend predictions, and macroeconomic policy analysis.
Disclaimer
Cryptocurrency market investment involves high risks. It is recommended that users conduct independent research and fully understand the nature of the assets and products purchased before making any investment decisions. Gate is not responsible for any losses or damages caused by such investment decisions.






