Source: Insightful Commentary
JPMorgan Global Market Strategy: What Signals Are Commodities Sending Us? February 5, 2026
The chaotic start to February raises a question: Is the volatility in commodity markets a precursor to future trends, or merely an adjustment?
We believe this is a healthy adjustment, not a turning point, presenting buying opportunities for metals, while expecting further declines in the energy sector.
Although global growth is recovering and manufacturing activity is shifting, providing support on the demand side, the divergence between energy and metals primarily stems from different supply dynamics.
From gold and silver to copper and Bitcoin, all commodity prices plummeted last Friday, marking the most significant market turmoil since last November. Gold experienced its sharpest single-day drop since 1983, falling over 9%, while silver plunged 26%, its largest single-day decline on record. Grain and livestock futures also crashed amid the turmoil in the precious metals market.
The sell-off continued into Monday, pressuring energy markets: global natural gas prices collapsed, and oil prices recorded their largest drop in six months. Precious metals selling accelerated after U.S. and Chinese exchanges raised margin requirements, compounded by a wave of seasonal selling ahead of the Lunar New Year, exacerbating the decline.
Overall, commodities lost nearly 8% in a brutal three-day plunge, with U.S. natural gas prices plummeting 57%, silver falling 33%, gold dropping 13%, and both copper and oil declining 7%. This intense volatility persisted into mid-week, with prices falling again after a rebound due to choppy trading (Figures 1 and 2). The commodity decline dragged U.S. stock index futures lower, while Asian stocks suffered their worst two-day drop since last April on Monday.
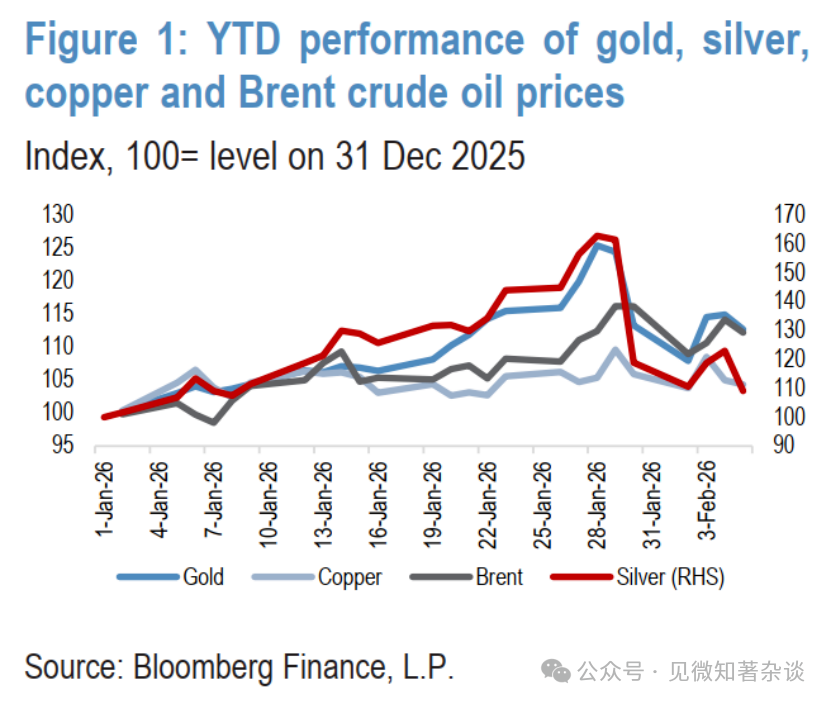
Figure 1: Year-to-date performance of gold, silver, Shanghai copper, and Brent crude oil prices
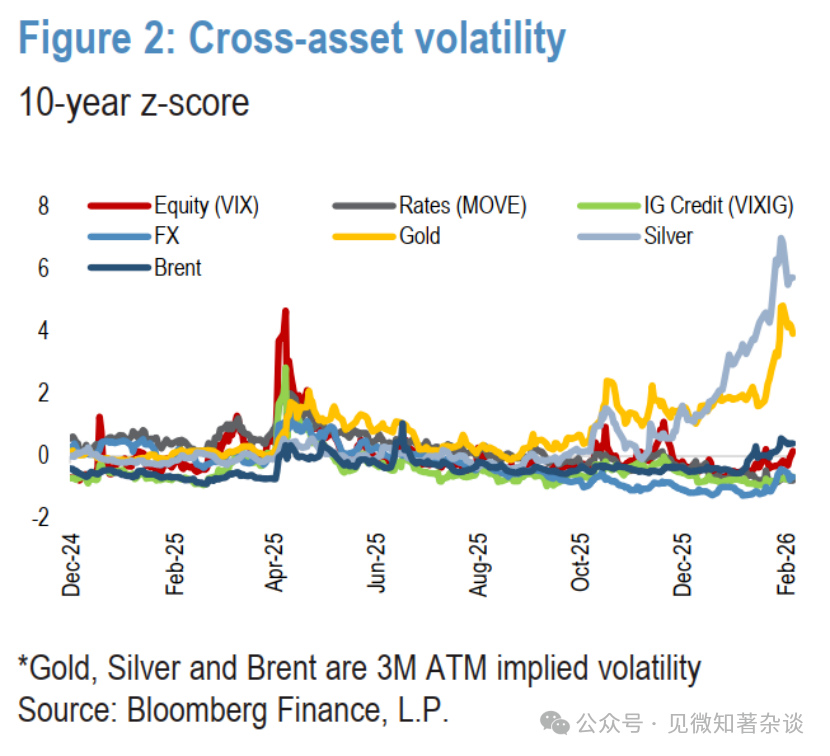
Figure 2: 10-year z-score of cross-asset volatility
This week's chaotic start raises the question: Is the commodity sell-off a precursor to future trends, or merely an adjustment?
We believe it is not a turning point but a healthy adjustment, a buying opportunity for metals, with more selling expected in energy.
1. The first argument revolves around the recovery in global growth
Since the fourth quarter of last year, a clear pro-cyclical rotation has emerged in global markets, reflected in metals, equities, and foreign exchange. This recovery is a direct result of:
· Less restrictive monetary policies in developed countries (Figure 3)
· Expansionary fiscal policies in most major economies. In the U.S., the Congressional Budget Office predicts that legislative measures like the "Bundle of Goodness Act" will boost U.S. growth by 0.9%. Expansionary fiscal policy is not unique to the U.S. The IMF estimates that fiscal measures will push growth in Germany by 1% and Japan by 0.5% in 2026. Ultimately, fiscal policy in the G3 economies will be highly expansionary in the coming quarters.
· Significant upside catalysts for U.S. growth and inflation as headwinds from trade wars and immigration restrictions fade. Strong AI and data center spending, along with high AI stock prices, are boosting the wealth effect for consumers. Additional tailwinds include a weaker dollar and (until recently) falling oil prices, as well as economic stimulus from hosting the World Cup and activities related to the U.S. Semiquincentennial.
The "Bundle of Goodness Act" further supports the outlook by cutting taxes on overtime and consumption, increasing the child tax credit, and extending full expensing for equipment and plants, which is increasing household rebates and driving a capital expenditure boom (Figure 4).
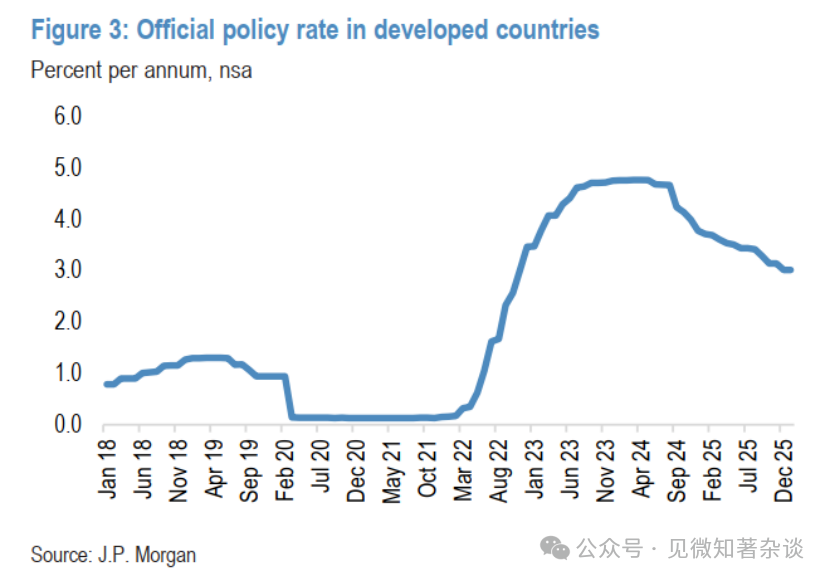
Figure 3: Official policy rates in developed countries
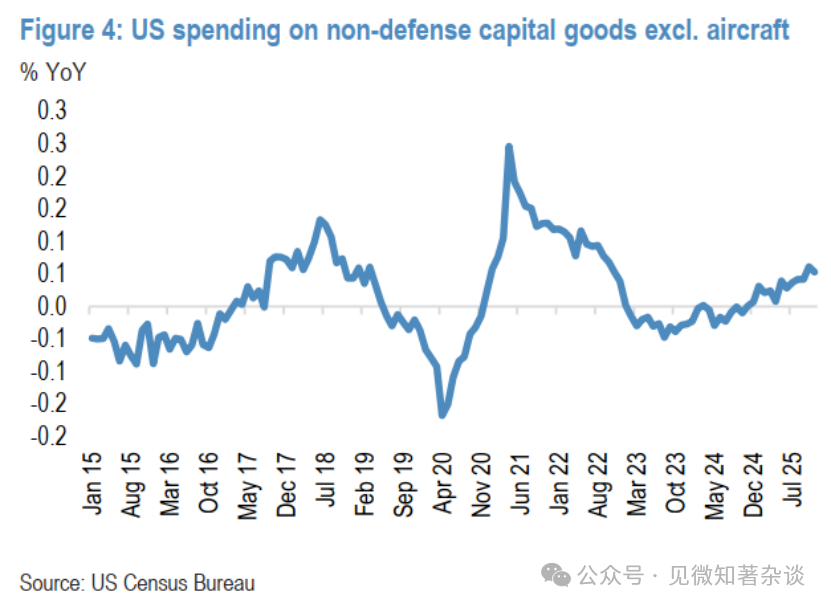
Figure 4: U.S. non-defense capital goods (excluding aircraft) spending
2. Global manufacturing activity is turning
Recent PMI data confirm that a global growth rebound is underway and broadening, supported by global monetary easing and a surge in tech investment. The increase in the number of economies reporting higher output is particularly encouraging. In developed markets, the U.S. recorded its strongest ISM manufacturing data since August 2022, Japan showed significant improvement, and Western Europe clearly strengthened. While China's output PMI was largely unchanged, the key bellwether of emerging Asia ex-China saw substantial growth. Overall, the global PMI is running at a solid, above-trend pace, with rising new orders providing constructive signals for the sustainability of the recovery.
3. Given the reassessment of global growth, the 2026 reflation trade has unfolded, with commodities, materials, and industrial stocks performing well
Based on the relationship between copper prices and the global manufacturing PMI over the past fifteen years, the magnitude of the recent copper price increase suggests a PMI reading near 53—well above the latest data of around 50.5 and more optimistic than any other cyclically sensitive market we track. While copper's year-on-year performance may exaggerate the market's pro-cyclical optimism, other markets also clearly show a degree of optimism. For example, a simulated basket of semiconductor stocks (showing similar explanatory power over the same period, R-squared around 0.42) suggests the PMI will rise to around 52 by the end of Q1 2026. The sustained bullish trend in this stock basket after breaking out of a multi-year range indicates that the pro-cyclical component of market trends remains strong, despite recent short-term reversals in metals (Figures 5 and 6).
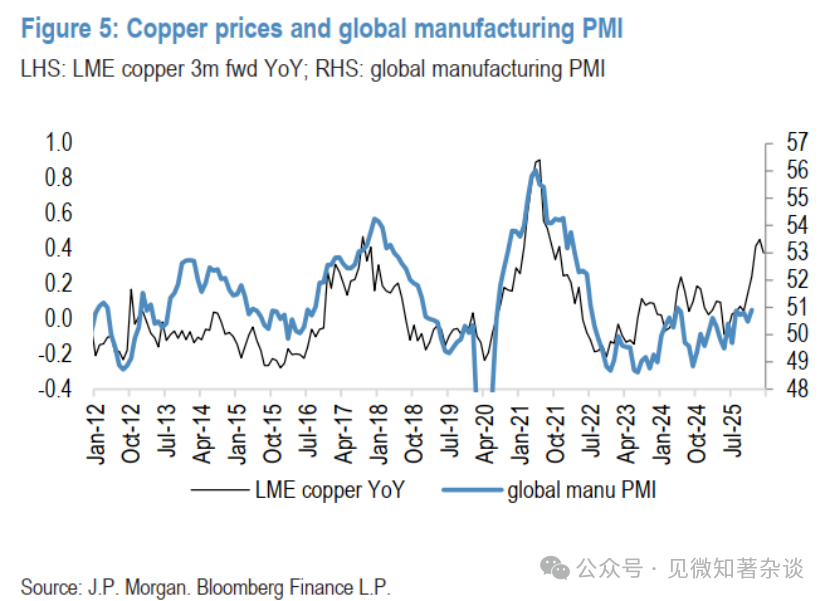
Figure 5: Copper price vs. global manufacturing PMI
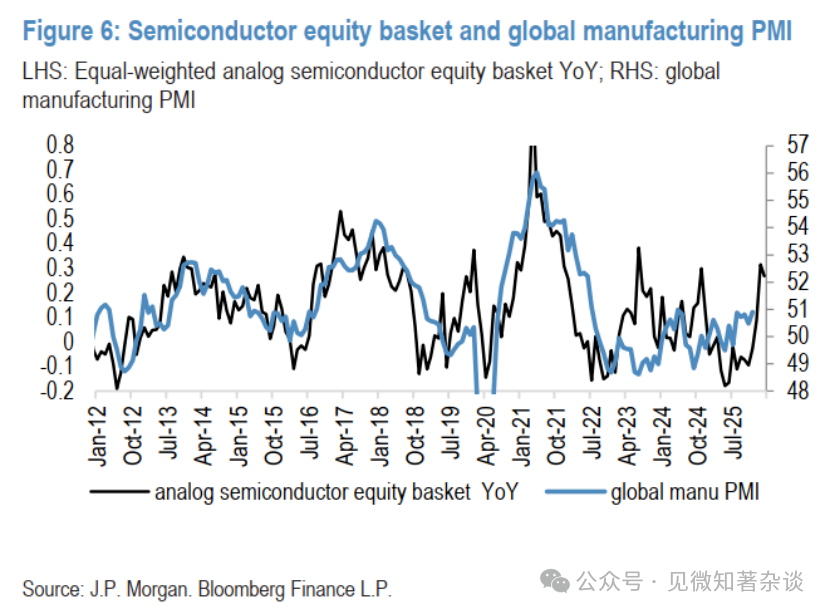
Figure 6: Semiconductor stock basket vs. global manufacturing PMI
4. However, the similarities within commodities end here
The sharp correction in precious metals prices last week was triggered by a dollar rebound (following the nomination of Kevin Warsh as the next Fed Chair), but the severity of the pullback was more due to the rapid unwinding of massive long positions quickly built up after prices accelerated unsustainably and became overextended in the prior two weeks. In short, prices went too far, too fast, with short-term momentum indicators jumping to levels rare in precious metals markets.
In contrast, the 11% rise in Bloomberg Energy prices since the start of the year was driven by temporary factors like weather and geopolitical escalation. A massive winter storm and freezing temperatures in parts of the U.S. caused production disruptions and boosted heating fuel demand, while cold weather in Europe disrupted oil loadings and depleted gas storage. However, the most significant impact on oil prices was the escalation of tensions with Iran, which we do not expect to be lasting given this is a U.S. midterm election year.
Looking through the current volatility, we remain bullish on gold and copper while maintaining a lower outlook for energy prices—a divergence driven primarily by different supply dynamics.
5. Staying bullish on gold; copper's fundamental peak is still ahead
Staying bullish on gold. As we have seen over the past six months, this long-term rally in gold is not linear, nor will it be in the future, and we continue to view such pullbacks as healthy and necessary, not a challenge to our structural bullish view. In fact, as gold remains a dynamic, multi-faceted portfolio hedge with a clear structural story, we have already seen physical bargain-hunting emerge.
Beyond recent support from retail investors, we continue to expect central banks to remain steadfast as significant bargain buyers, and we now forecast official net purchases to reach 800 tonnes of gold this year, still 70% above pre-2022 levels (Figure 7).
Overall, we continue to see room for the gold diversification trend to run further, as in an environment where physical assets continue to outperform paper assets, we expect demand from both central banks and investors this year to be sufficient to ultimately push gold to $6,300 per ounce by the end of 2026 (Figure 8).
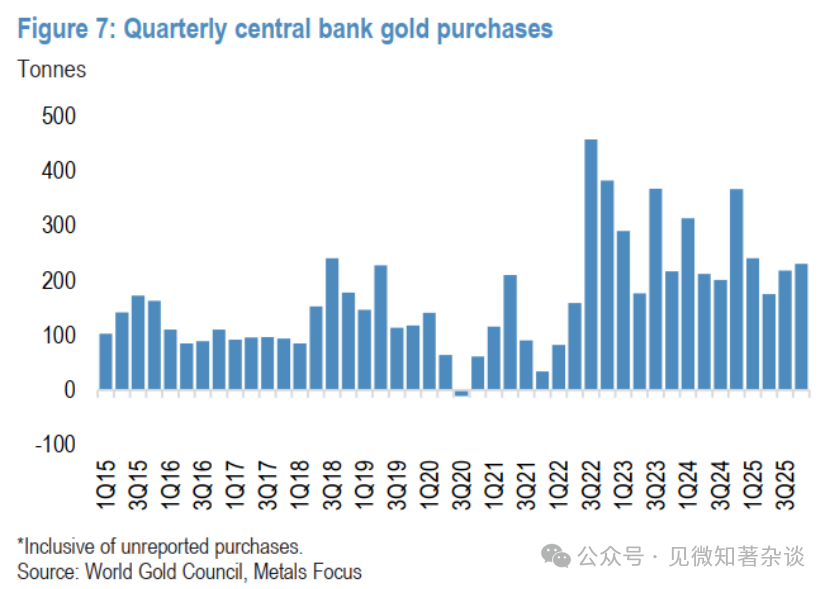
Figure 7: Central bank quarterly gold purchases
İlgili Sorular
QWhat is J.P. Morgan's overall view on the recent commodity market sell-off, and what opportunities do they see?
AJ.P. Morgan views the sell-off as a healthy correction rather than a trend reversal. They see it as a buying opportunity for metals like gold and copper, while expecting further declines in the energy sector.
QAccording to the report, what are the key factors driving the divergence between metal and energy commodities?
AThe divergence is primarily driven by different supply dynamics. Metals are supported by structural stories and central bank buying, while the energy price surge was fueled by temporary factors like severe weather and geopolitical tensions.
QWhat is J.P. Morgan's specific year-end price target for gold and the main reasons supporting this bullish outlook?
AJ.P. Morgan maintains a bullish outlook on gold with a price target of $6,300 per ounce by the end of 2026. This is supported by expectations of strong demand from both central banks (forecasting 800 tons of net official purchases) and investors seeking portfolio diversification.
QWhy is the bank more cautious on silver compared to gold in the short term?
AThe bank is more cautious on silver because it is a smaller, more volatile market that lacks central banks as structural buyers. Its relatively higher valuation compared to gold makes it at risk for a deeper correction and two-way overshoot risk.
QHow much geopolitical risk premium does J.P. Morgan estimate is currently priced into oil, and what is their expectation for it?
AJ.P. Morgan estimates that oil prices contain about $7 per barrel of geopolitical premium, largely due to escalated tensions between the US and Iran. They expect this premium to fade, as they do not a lasting disruption to oil supply, allowing prices to fall back towards fair value.





