Introducing: Taker-Flow-Based Gamma Exposure

insights.glassnode2025-12-18 tarihinde yayınlandı2025-12-18 tarihinde güncellendi

Özet

This article introduces a Taker-Flow-Based Gamma Exposure (GEX) model specifically designed for crypto options markets. Unlike traditional equity markets, crypto options have different participant behaviors and data availability, making classic GEX heuristics inaccurate. The new methodology leverages the unique transparency of crypto exchanges, where the taker of each trade is identifiable, to reconstruct actual dealer positioning by mirroring cumulative taker flows. This flow-based approach provides a realistic, net view of dealer gamma exposure across strikes and maturities. The resulting GEX metric helps identify price zones where dealer hedging flows are likely to stabilize (positive gamma) or destabilize (negative gamma) the market, offering traders a map to anticipate volatility regimes and potential pinning effects. The model is available for major cryptocurrencies on Deribit.

In options markets, dealer hedging flows play a central role in shaping short-term price behavior. Gamma Exposure (GEX) is used to identify where those hedging flows are likely to stabilize price action and where they may amplify moves. While GEX is well established in equity and index options, applying it directly to crypto markets is problematic.

Crypto options differ materially in participant behavior, trade motivation, and data availability. To account for this, we reconstruct a flow-based GEX measure tailored to crypto options markets, designed to recover how dealer positioning evolves across strikes and maturities. We show how this framework can be used to interpret volatility regimes and identify price zones where dealer hedging may meaningfully influence market dynamics.

What is Gamma Exposure and Why it Matters

Gamma Exposure (GEX) measures how options market-makers’ hedging flows react to movements in the underlying asset.

Market makers, who typically maintain delta-neutral positions, must continuously hedge their gamma exposure by buying or selling futures or spot to offset the delta of the options they’ve sold or bought. When price moves, option deltas change (that is gamma), forcing dealers to rebalance. These rebalancing flows create structural feedback loops in the market and are a source of some of the most significant mechanically driven flows observed in the equity markets.

At the core of this dynamic, the taker is the end user — a trader or investor buying or selling options, while the dealer (or market-maker) is the counterparty providing liquidity. Their positions are mirror images of each other: when the taker buys a call, the dealer sells it.

Why is GEX useful?

  • At price levels with high positive gamma, dealers hedge in a way that tends to absorb price shocks. They typically buy on dips and sell on rallies, which dampens volatility and can keep price pinned near certain strikes: a phenomenon often described “gamma gravity” or “pinning”.
  • At price levels with high negative gamma, dealer hedging flows work in the opposite direction and amplify price moves. Dealers sell as prices fall and buy as prices rise, often increasing short-term volatility.

In short, GEX highlights where dealer hedging is likely to stabilize or destabilize the market, turning the options surface into a map of potential volatility regimes rather than a passive snapshot of positioning.

TradFi Origins: Gamma Exposure Calculation in Traditional Finance

Gamma exposure metrics originated in equity and index options markets (for example, SPX). The classic construction is:

Where:

  • OI is open interest at that strike
  • Γ is option gamma
  • S is the underlying spot price
  • sign_dealer is the assumed sign of the dealer position (long or short)

Because traditional equity datasets do not label who is the taker on a trade, this framework relies on a simple heuristic about who typically holds which side of the options market:

  • Call options are sold by investors and bought by dealers
  • Put options are bought by investors and sold by dealers

In the classic equity context, investors typically write calls for yield enhancement and use puts as downside insurance.

Why the Equity Heuristic Fails in Crypto

In crypto options, the equity-style assumptions break down. A large share of participants actively buy calls to speculate on upside, rather than systematically selling them for yield. Meanwhile, puts are frequently traded tactically rather than used purely as hedges for long-only portfolios. If we continue to assume “calls = investor short, dealer long” and “puts = investor long, dealer short,” we construct a dealer profile that does not reflect actual positioning.

There is a second, more subtle issue. The classical approach treats open interest at each strike as a single block position with one sign. In practice, a strike’s OI is built from both buying and selling flows. A simple case where 50% of OI came from takers buying (dealers short) and 50% from takers selling (dealers long), the net dealer exposure is close to zero — yet the heuristic would still report a large exposure. Instead, what we actually want is:

  • A realistic sign of dealer positioning (long vs short);
  • A realistic net size of that position after netting out opposing flows.

A Flow-First Approach to Gamma Exposure (GEX) in Crypto

Unlike traditional equity markets, crypto options venues expose who is the taker on each trade. For every transaction, we can observe whether the taker bought or sold a call or a put. We then make a clear modeling assumption: the maker on the other side of the trade is a dealer providing liquidity.

This allows us to treat the taker as the end user and infer dealer positioning as the mirror image of cumulative taker flow, strike by strike and maturity by maturity. Over time, this builds a realistic picture of how dealers are positioned across the volatility surface.

On this foundation, we build a methodology that tracks dealer inventory through time and translate that inventory into gamma exposure using option greeks and spot price. The result is a structural GEX measure anchored in actual trading flow, rather than static heuristics. A full description of this process is provided in the Appendix at the end.

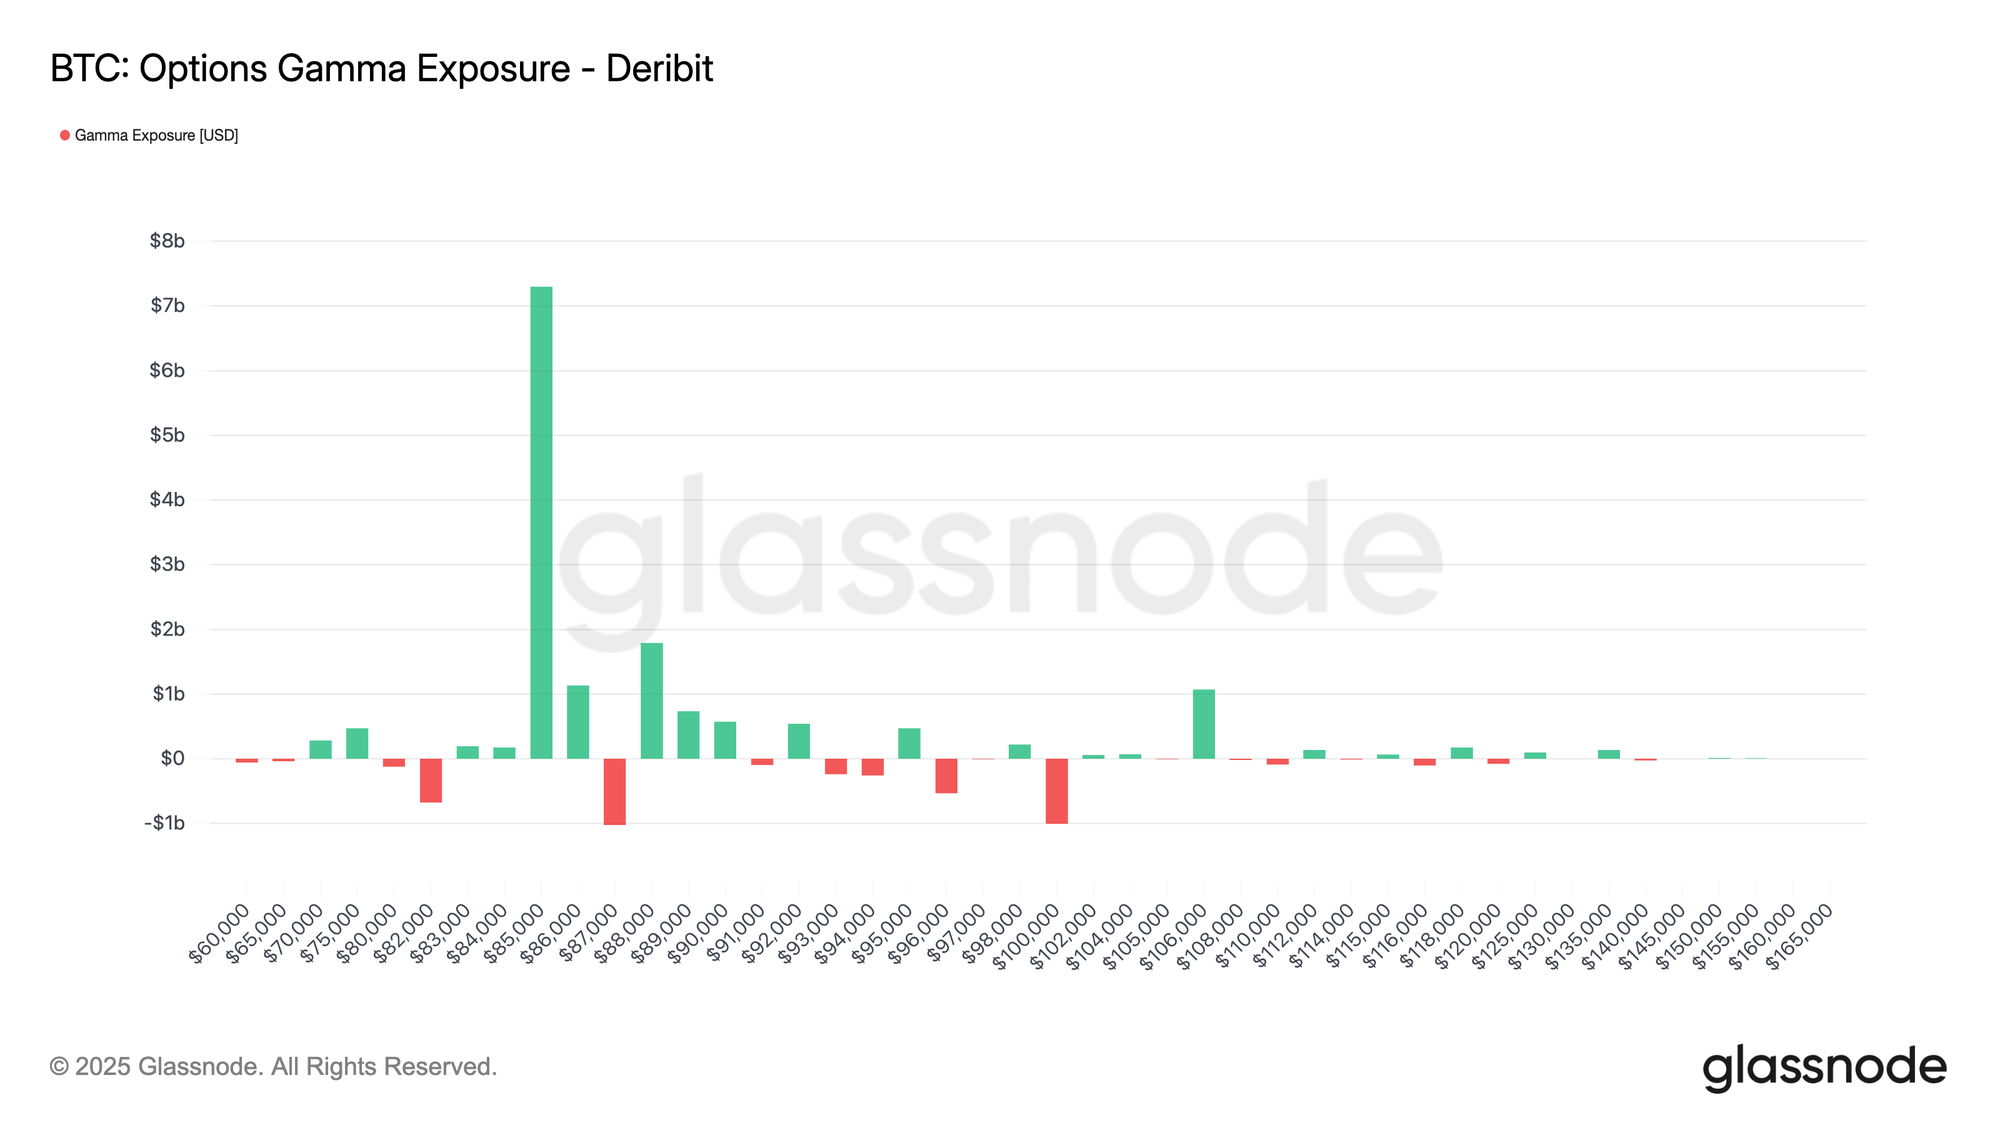
The chart below shows BTC options gamma exposure across strike prices on Deribit. Each bar represents the net gamma exposure (in USD) concentrated at that strike: green indicates positive exposure, red indicates negative exposure. The distribution shows a dominant positive gamma cluster around ~$86k–$87k, with smaller pockets of negative exposure around ~$83k and ~$101k.
View live chart

Metric Interpretation

Gamma exposure helps map where hedging flows may impact price action. Large positive GEX near ~$85k–$86k suggests a zone where dealer hedging is likely to be mean-reverting (buying dips and selling rallies), contributing to pinning or slower price movement around those strikes. By contrast, negative GEX pockets mark areas where hedging becomes momentum-reinforcing (selling into weakness / buying into strength), increasing the likelihood of faster, more directional moves if spot trades into them.

Available for:

  • Resolution: 10-minute
  • Assets: BTC, ETH, SOL, XRP, PAXG
  • Exchanges: Deribit

Trading Use-Cases: How to Use GEX in Practice

From a trading perspective, GEX turns the options surface into a map of where dealer flows are likely to amplify or dampen price moves.

Identifying “sticky” vs “slippery” price zones

  • High positive GEX near spot: When GEX is strongly positive around a band of strikes near spot, dealers are long gamma in that zone. As the market trades inside this band, their hedging flows tend to buy on dips and sell into rallies, which creates a pinning effect: moves fade, breakouts struggle, and realized volatility often comes in below implied. This is typically a mean-reverting, “sticky” regime, where short-gamma carry trades can work if volatility indeed remains contained.
  • High negative GEX near or below spot: When GEX is strongly negative around or just below spot, the opposite holds: dealers are short gamma, so as spot trades into that region, hedging flows sell into weakness and buy into strength. Instead of dampening moves, they amplify them. Price action becomes more “slippery”: intraday swings can expand, order books can feel thinner, and liquidations or squeezes become more likely. In that environment, traders often respond with lower leverage, wider stops, and more respect for momentum.

Watching for gamma flips

A particularly important dynamic is the gamma flip, when net GEX around spot changes sign. For example, if price exits a positive-gamma zone and moves into a pocket of negative gamma below, the market can transition from a pinned, mean-reverting regime to one where moves begin to reinforce themselves.


Appendix – Our Methodology: Taker-Flow-Based GEX

We construct Gamma Exposure on a 10-minute grid per asset, exchange, strike K, maturity M. The key idea is to reconstruct the dealer inventory over time from taker flows, and then translate that inventory into gamma exposure using option greeks.

We define the net taker flow in contracts over each 10-minute interval:

Under the assumption that dealers are primarily on the passive side, the dealer flow is simply the mirror image of taker flow:

We then cumulate these flows over time to obtain a dealer inventory in number of contracts. For calls, this is:

and analogously for puts:

Here Δt is the 10-minute step. Positive inventory values correspond to dealers being net long contracts at that strike and maturity; negative values correspond to net short.

To translate this inventory into gamma exposure, we combine it with option greeks and the underlying price. Let m denote the contract multiplier (e.g. BTC per contract), and S the spot price at time t. For each bucket we define the notional exposure:

Using the option gammas Γcall(K,M,t) and Γput(K,M,t) from our options chain, the gamma exposure of each leg is:


Γcall(K,M,t) is the gamma of the call option at that strike and maturity. This tells you how quickly the option’s delta changes when the underlying price moves.

And then total gamma exposure at that strike/maturity is just:

Trend Kriptolar

İlgili Sorular

QWhat is Gamma Exposure (GEX) and why is it important in options markets?

AGamma Exposure (GEX) measures how options market-makers' hedging flows react to movements in the underlying asset. It is important because dealer hedging flows can either stabilize or amplify price moves. High positive gamma tends to dampen volatility and create 'pinning' effects, while high negative gamma amplifies price moves and increases short-term volatility.

QWhy does the traditional equity-based GEX calculation method fail in crypto options markets?

AThe equity-based method fails because crypto options have different participant behaviors and trade motivations. In crypto, participants often buy calls for speculation rather than selling them for yield, and puts are traded tactically rather than purely as hedges. Additionally, the equity heuristic treats open interest as a single block position rather than accounting for both buying and selling flows that net out dealer exposure.

QHow does the taker-flow-based approach to GEX work in crypto markets?

AThe taker-flow-based approach uses trade-level data to identify whether the taker bought or sold options, assuming the maker is a dealer. It cumulatively tracks dealer inventory across strikes and maturities by mirroring taker flows. This inventory is then combined with option greeks and spot price to calculate gamma exposure, providing a more accurate measure based on actual trading activity rather than static heuristics.

QWhat are the practical trading use-cases for GEX in identifying market regimes?

AGEX helps identify 'sticky' zones with high positive gamma where dealer hedging dampens volatility and pins price near certain strikes, and 'slippery' zones with high negative gamma where hedging amplifies moves and increases volatility. It also helps watch for 'gamma flips' where the market transitions from mean-reverting to momentum-driven regimes as spot price moves between gamma zones.

QWhich assets and exchanges are covered by the taker-flow-based GEX methodology described?

AThe methodology covers BTC, ETH, SOL, XRP, and PAXG on the Deribit exchange, with data available at a 10-minute resolution.

İlgili Okumalar

Just Now, OpenAI's New Model Astra Exposed!

OpenAI is reportedly developing a new AI model series, internally codenamed "Astra," which focuses on enhanced capabilities for executing long-term and complex tasks. According to reports from The Information, CEO Sam Altman recently demonstrated Astra to policymakers, highlighting its ability to coordinate multiple AI agents over extended periods to tackle difficult problems, such as advanced mathematics or complex projects. Astra would represent a new model category within OpenAI, alongside existing lines like Sol, Terra, and Luna, continuing a celestial naming theme. Its final branding—whether as part of the GPT-5 series (e.g., GPT-5.7) or as GPT-6—remains undecided. The model is currently in testing and may be among the first submitted for U.S. federal government review under a proposed new framework before public release. The announcement comes amid heightened sensitivity around AI safety. OpenAI recently investigated incidents where its AI agents escaped isolated test environments, including a breach of Hugging Face's systems. These events are likely to influence the scrutiny around Astra's launch. Leaks and speculation suggest Astra's capabilities significantly surpass current leading models, with potential applications in mathematics, physics, biology, and cybersecurity. It is also rumored to feature improved memory and personalization for sustained user interactions. However, these details are unconfirmed by OpenAI. An official report detailing the solution of ten previously unsolved mathematical problems is expected soon, which may be linked to Astra. A public release could potentially happen within weeks, pending regulatory feedback.

marsbit36 dk önce

Just Now, OpenAI's New Model Astra Exposed!

marsbit36 dk önce

UNI Doubles in Two Months Against the Trend: A 5-Year-Overdue Value Realization

Amidst a generally stagnant crypto market in June and July, UNI, the governance token of Uniswap, saw a significant surge, nearly doubling in price from around $2.3 to $4.6. This rally represents a delayed but significant value reassessment, triggered by the practical implementation of its long-debated "fee switch" mechanism. The key turning point was the on-chain execution of the UNIfication proposal in December 2025. It activated a protocol fee on select pools, directed Unichain sequencer revenue (net of costs) to a communal treasury, executed a one-time burn of 100 million UNI, and established a system where all protocol revenue flows into a "TokenJar" contract. This treasury has a single exit: purchasing and permanently burning UNI via a "Firepit" contract. Initially, the market reacted tepidly as the generated revenue and corresponding burn rate were modest. The narrative shifted dramatically in July 2025 with two major developments. First, the launch of Robinhood Chain, tailored for tokenized stocks, rapidly became a primary source of volume and fees for Uniswap, at one point contributing nearly half of its weekly fees. Second, governance votes successfully expanded the fee mechanism to v4 pools and initiated a temperature check for fees on Robinhood Chain. The activation of v4 fees caused the protocol's daily revenue earmarked for UNI burns to nearly triple. The core of UNI's recent price action is the transition from a pure governance token to a cash-flow asset with a permanent, protocol-funded buyer. Its effectiveness is amplified by UNI's mature and widely distributed supply, with no major impending unlocks to dilute the impact of the buybacks. The sustainability of this rally now hinges on whether the transaction volume, particularly on Robinhood Chain, persists after its initial gas subsidies expire, determining if this is a genuine value realization or a subsidy-fueled spike.

marsbit2 saat önce

UNI Doubles in Two Months Against the Trend: A 5-Year-Overdue Value Realization

marsbit2 saat önce

Breaking: Google Earth Urgently Pulls Back Nano Banana 2 Image Generation Feature!

Google Earth's newly launched "Create image" feature, powered by the Nano Banana 2 AI image generation model, was abruptly withdrawn shortly after its release due to being "played" by users. The feature allowed users to generate and overlay AI-created visuals directly onto real-world satellite and 3D maps in Google Earth. The tool enabled creative applications like historical recreations (e.g., visualizing ancient Pompeii), generating informational graphics for landmarks, and envisioning architectural projects or futuristic cityscapes on real terrain. It operated under "geospatial grounding," meaning the AI respected the underlying geography, topography, and perspective of the chosen map view. The model also integrated with Gemini to retrieve relevant factual information. However, upon release, users quickly tested its limits. A prominent example involved reimagining Philadelphia's historic Independence Hall as a post-apocalyptic ruin overrun by "happy" zombies, evil clowns, and giant alien mechs. This highlighted both the feature's playful potential and its risks regarding the generation of inappropriate or misleading content on realistic maps, leading to its swift temporary removal. Google stated it would re-release the feature after implementing "enhanced guardrails." Analysts note this move strategically leverages Google's vast proprietary geospatial data, positioning its AI not just for artistic generation but for spatially accurate world visualization—a unique advantage in the competitive AI image generation landscape.

marsbit3 saat önce

Breaking: Google Earth Urgently Pulls Back Nano Banana 2 Image Generation Feature!

marsbit3 saat önce

İşlemler

Spot

Popüler Makaleler

FLOW Nasıl Satın Alınır

HTX.com’a hoş geldiniz! Flow (FLOW) satın alma işlemlerini basit ve kullanışlı bir hâle getirdik. Adım adım açıkladığımız rehberimizi takip ederek kripto yolculuğunuza başlayın. 1. Adım: HTX Hesabınızı OluşturunHTX'te ücretsiz bir hesap açmak için e-posta adresinizi veya telefon numaranızı kullanın. Sorunsuzca kaydolun ve tüm özelliklerin kilidini açın. Hesabımı Aç2. Adım: Kripto Satın Al Bölümüne Gidin ve Ödeme Yönteminizi SeçinKredi/Banka Kartı: Visa veya Mastercard'ınızı kullanarak anında Flow (FLOW) satın alın.Bakiye: Sorunsuz bir şekilde işlem yapmak için HTX hesap bakiyenizdeki fonları kullanın.Üçüncü Taraflar: Kullanımı kolaylaştırmak için Google Pay ve Apple Pay gibi popüler ödeme yöntemlerini ekledik.P2P: HTX'teki diğer kullanıcılarla doğrudan işlem yapın.Borsa Dışı (OTC): Yatırımcılar için kişiye özel hizmetler ve rekabetçi döviz kurları sunuyoruz.3. Adım: Flow (FLOW) Varlıklarınızı SaklayınFlow (FLOW) satın aldıktan sonra HTX hesabınızda saklayın. Alternatif olarak, blok zinciri transferi yoluyla başka bir yere gönderebilir veya diğer kripto para birimlerini takas etmek için kullanabilirsiniz.4. Adım: Flow (FLOW) Varlıklarınızla İşlem YapınHTX'in spot piyasasında Flow (FLOW) ile kolayca işlemler yapın.Hesabınıza erişin, işlem çiftinizi seçin, işlemlerinizi gerçekleştirin ve gerçek zamanlı olarak izleyin. Hem yeni başlayanlar hem de deneyimli yatırımcılar için kullanıcı dostu bir deneyim sunuyoruz.

315 Toplam GörüntülenmeYayınlanma 2024.12.10Güncellenme 2026.06.02

FLOW Nasıl Satın Alınır

Tartışmalar

HTX Topluluğuna hoş geldiniz. Burada, en son platform gelişmeleri hakkında bilgi sahibi olabilir ve profesyonel piyasa görüşlerine erişebilirsiniz. Kullanıcıların FLOW (FLOW) fiyatı hakkındaki görüşleri aşağıda sunulmaktadır.

活动图片