Introducing: Global Metrics Suite

insights.glassnode2026-05-28 tarihinde yayınlandı2026-05-28 tarihinde güncellendi

Özet

Glassnode introduces the Global Metrics Suite, a new framework for analyzing the fragmented cryptocurrency market through aggregated on-chain and market data. It solves the challenge of structural discontinuities in traditional aggregate series by using formally rebalanced baskets (e.g., by market cap) and provides two output types: Raw Aggregates (preserving original units) and Indices (scaled, continuous series for trend comparison). The article demonstrates the value of continuity-adjusted indices through three examples. First, they reveal a significant 2024 surge in small-cap market cap, a rally invisible in raw data where "winners" leave the basket upon crossing a threshold. Second, a global Spent Output Profit Ratio (SOPR) index shows that small-cap sentiment is more stable than raw data suggests, while larger caps exhibit a trend of decreasing profit realization per cycle. Third, an Open Interest index highlights the higher volatility and leverage spikes in mid- and small-cap derivatives, useful for monitoring cascade risks. Four metrics are currently available via API: Total Market Cap, Realized Cap, Median SOPR, and Total Open Interest, each for "All Coins," Large, Mid, and Small Cap baskets. The framework, using weekly rebalancing and equal weighting, brings the continuity discipline of traditional finance indices to multi-asset crypto analytics.

Aggregate market analysis has become a challenge since the digital asset space has fragmented into thousands of assets, sectors, and rapidly changing market-cap cohorts. As assets appreciate, decline, launch, or disappear, aggregate metric series develop structural discontinuities that make long-term analysis difficult.

Previously, we showcased the power of global views that aggregate metrics across the market using our Multi-Asset Explorer. We have now extended this framework with Glassnode Global Metrics — a suite of formally rebalanced aggregate metrics with continuous index normalization, available via API.

In this article, we introduce the framework, examine several examples across market capitalization, profitability, and derivatives positioning, and show what continuity-adjusted indices reveal relative to raw aggregates.

What are Glassnode Global Metrics?

Global Metrics are aggregated on-chain and market metrics computed across multiple cryptocurrencies, organized into configurable baskets. Baskets can be defined by market capitalization thresholds, top-N rankings (by any metric), or asset tags (sectors, categories). They solve a fundamental challenge in crypto analytics: how to track on-chain and market metrics across a highly dynamic group of assets over time without artificial discontinuities caused by basket composition changes, in contrast to indices that focus on price alone.

We provide two output types for each metric:

  • Raw Aggregates: True values in original units preserving economic meaning (e.g., USD for market cap, counts for active addresses)
  • Indices: Scaling-factor-adjusted, base-normalized time series for trend analysis and cross-basket comparison

What the indices reveal

Market structure: the 2024 small-cap surge

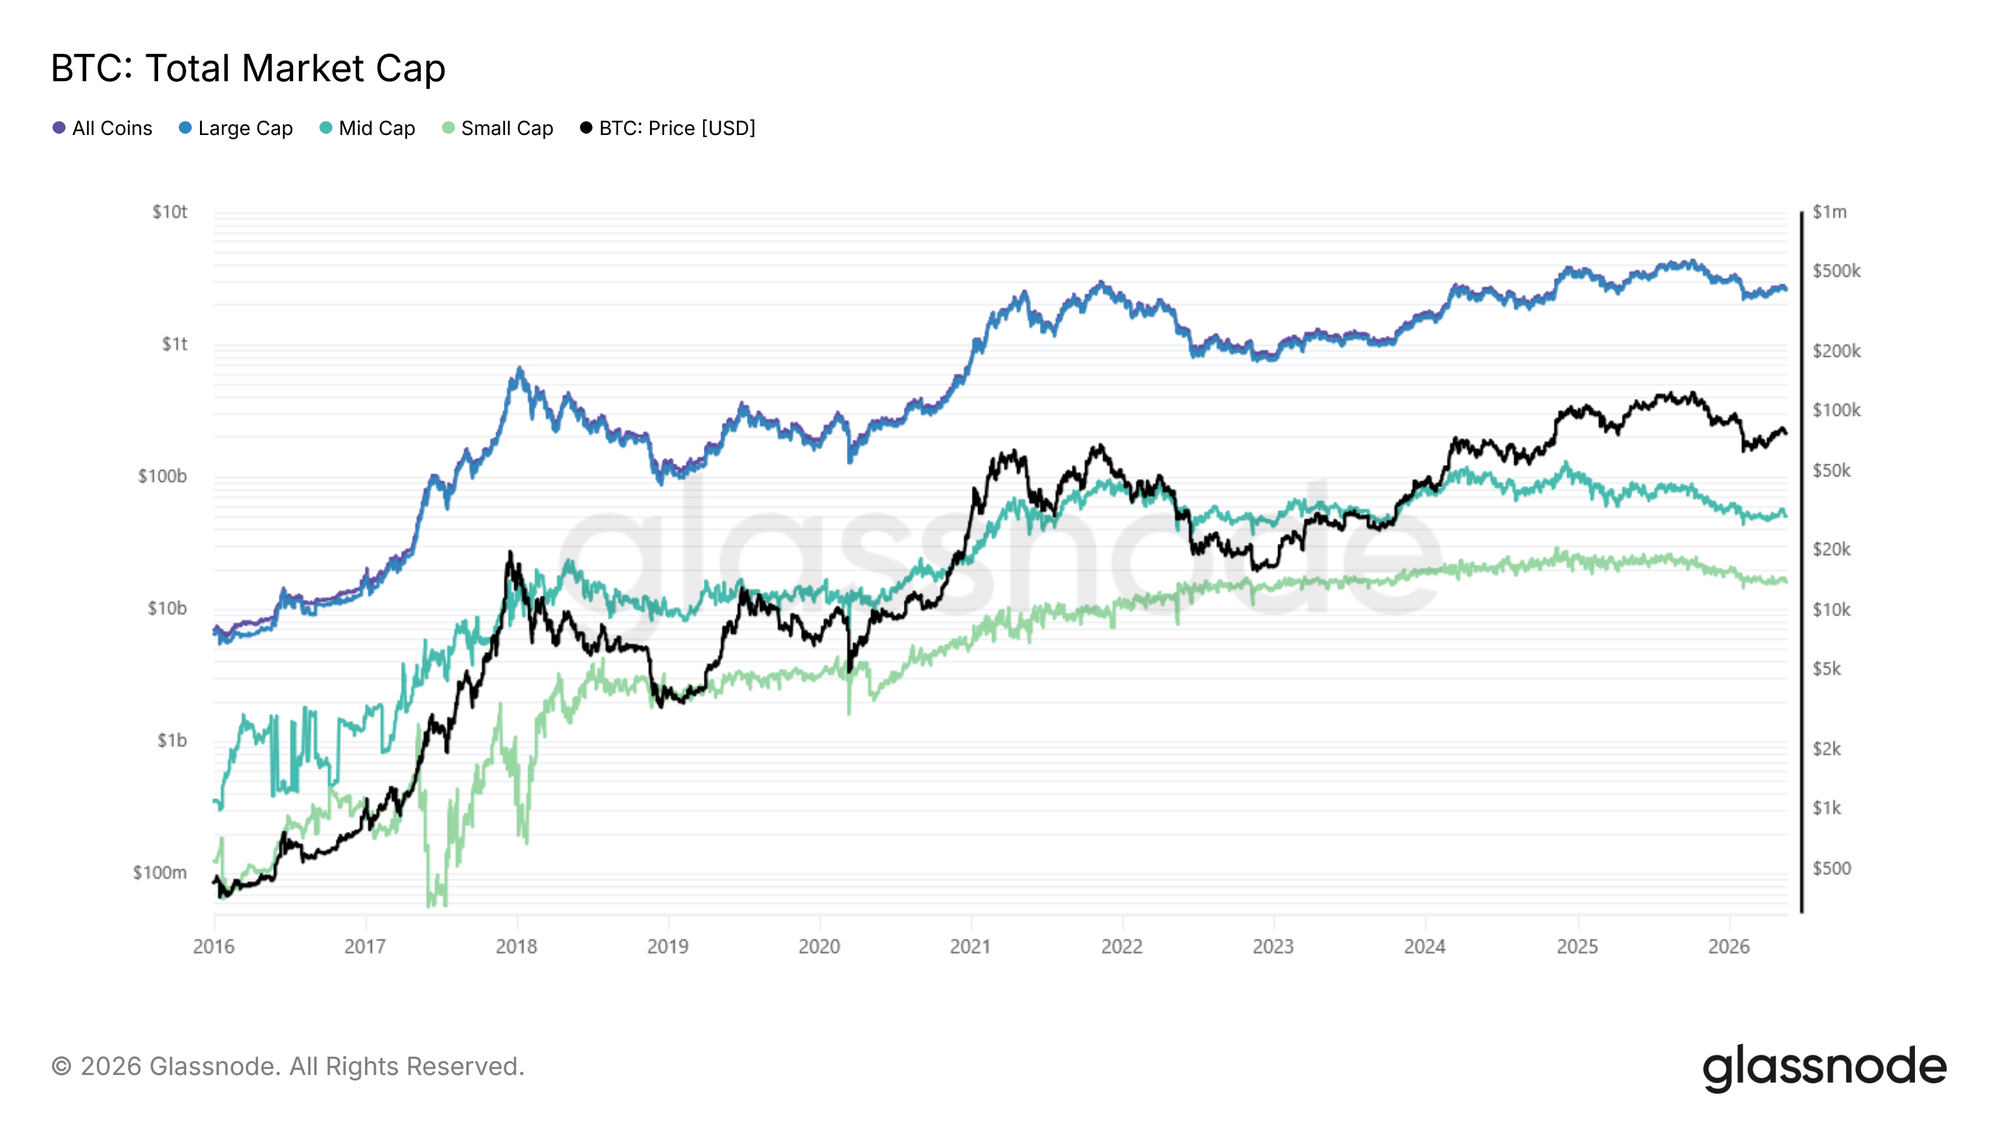
The clearest demonstration of why continuity-adjusted indices matter is the small-cap tier in 2024. The below figure presents Total market cap: Raw aggregate (USD, log scale) across all four baskets: All Coins, Large, Mid and Small Cap, with BTC price overlaid.
View Live Metric

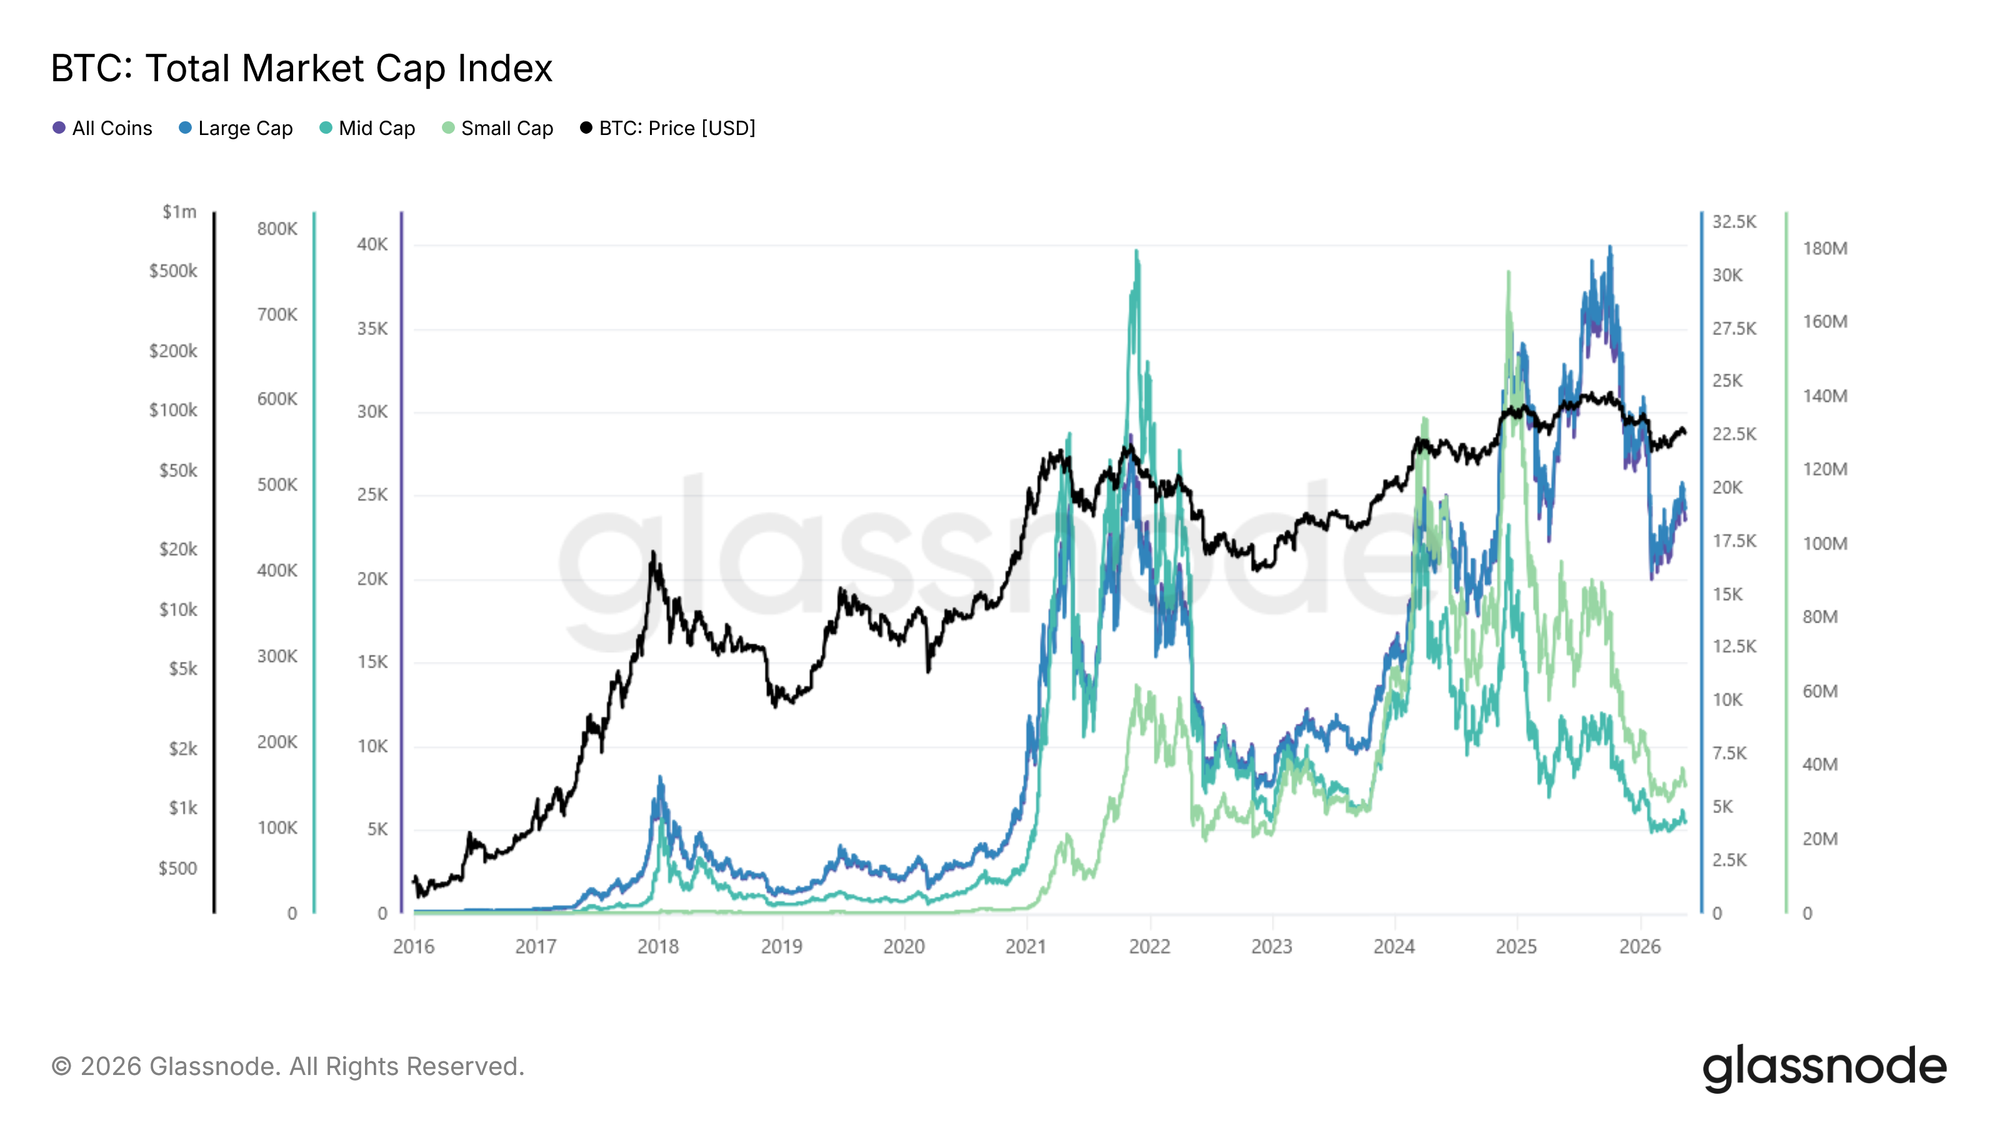
Compare to the Total market cap index across all four baskets: Scaled index (base 100), same baskets. Each tier starts at 100, hence the lines are directly comparable as growth multiples.
View Live Metric

The raw small-cap series contains a structural bias: whenever a small-cap asset performs well, it eventually crosses the $100M threshold and leaves the basket, taking its gains with it. In other words, "winners leave". The raw aggregate is, by design, incapable of capturing a small-cap rally.

The index neutralizes this effect. Small-cap shot up dramatically in 2024, a move largely invisible in the raw series, driven by near-instant token creation platforms and the memecoin mania that followed.

The same chart also highlights the divergence across tiers: while large caps held up relatively well, altcoin tiers entered a prolonged drawdown. Both halves only become legible in the index.

Profit-taking Sentiment: Altcoin SOPR vs BTC SOPR

Spent Output Profit Ratio (SOPR), which measures whether coins moving on-chain are being spent at a profit (above 1) or a loss (below 1), is one of the clearest cases where a global metric adds value beyond the single-asset version. BTC SOPR and the median SOPR across altcoin baskets frequently diverge, and the spread between them becomes a signal in itself.

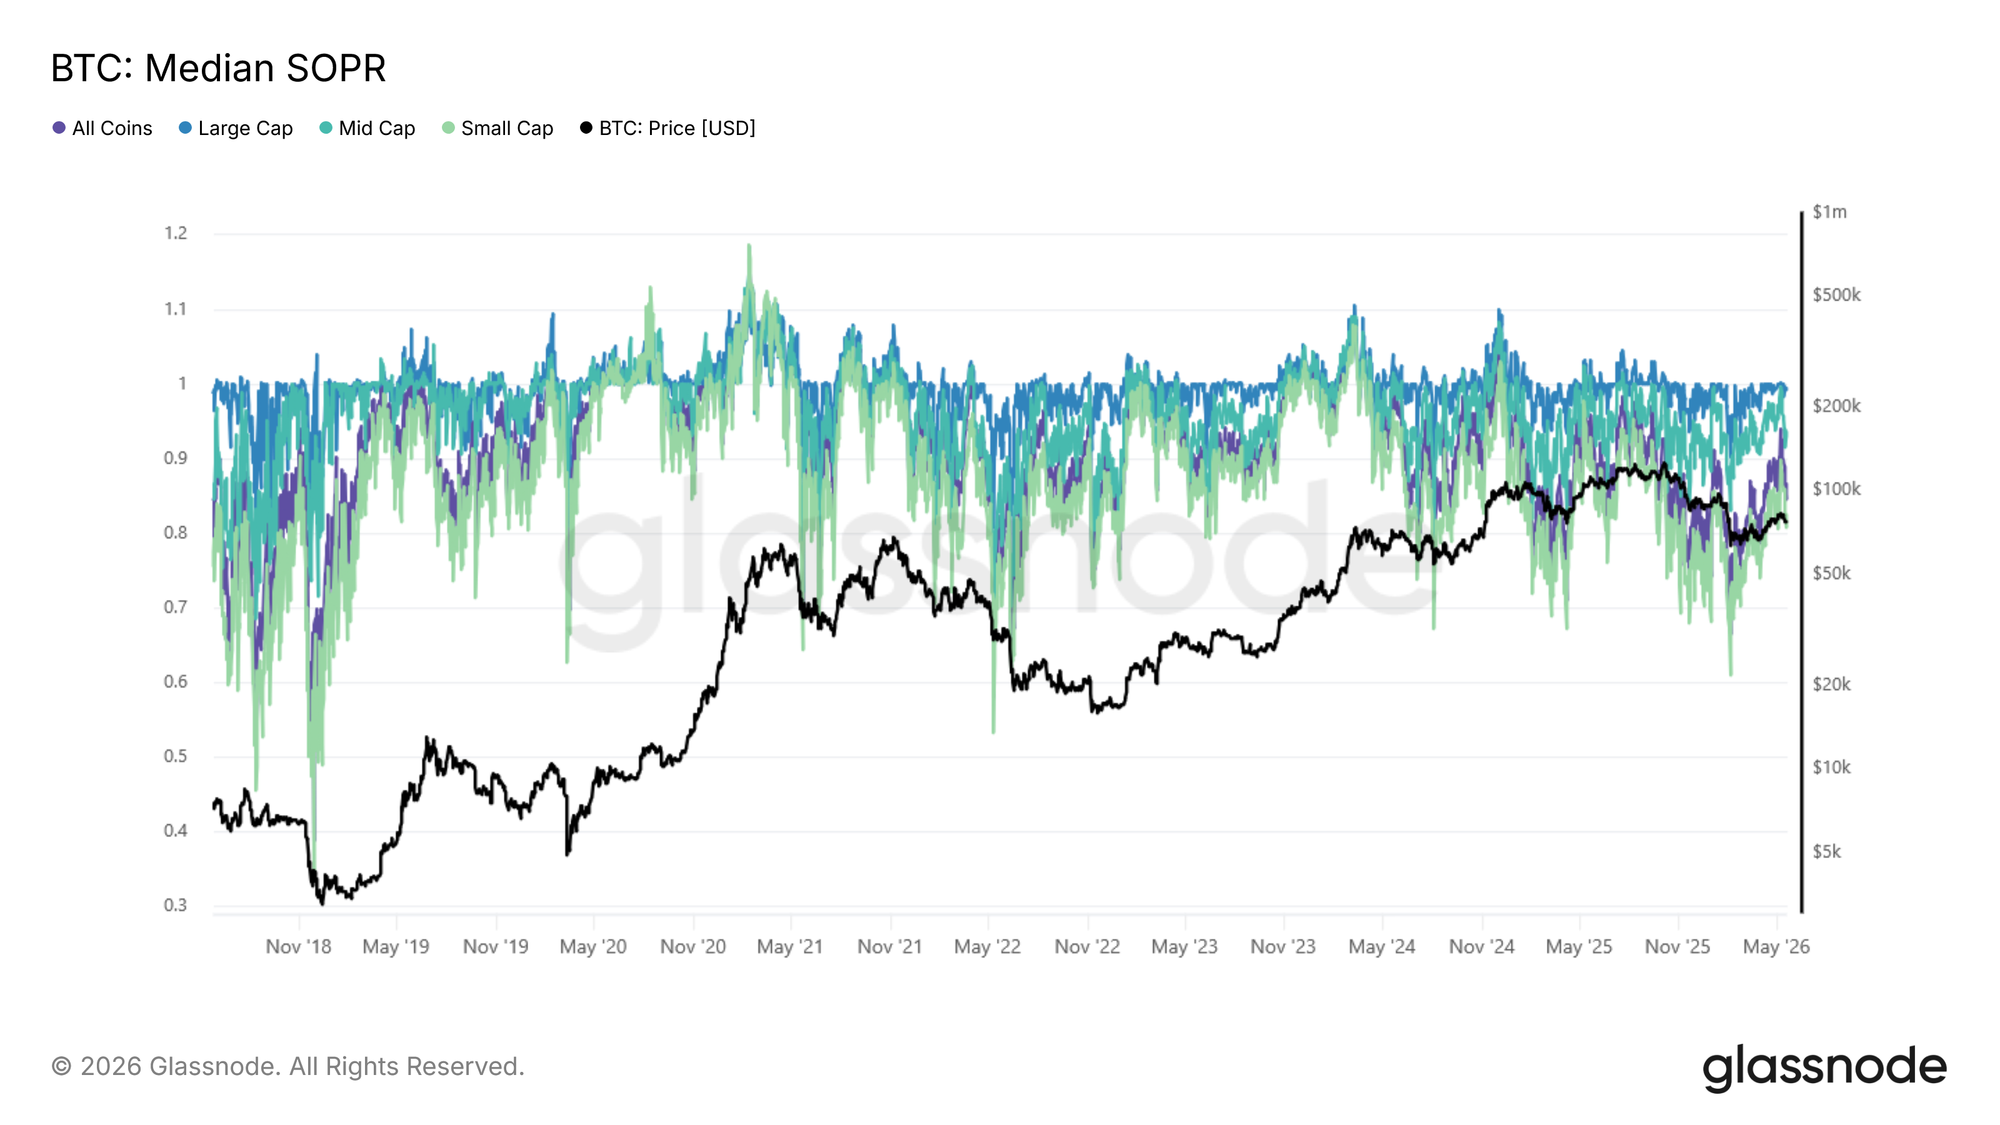
The following figure shows Median SOPR: Raw aggregate across all four baskets, BTC price overlaid. SOPR oscillates around 1.
View Live Metric

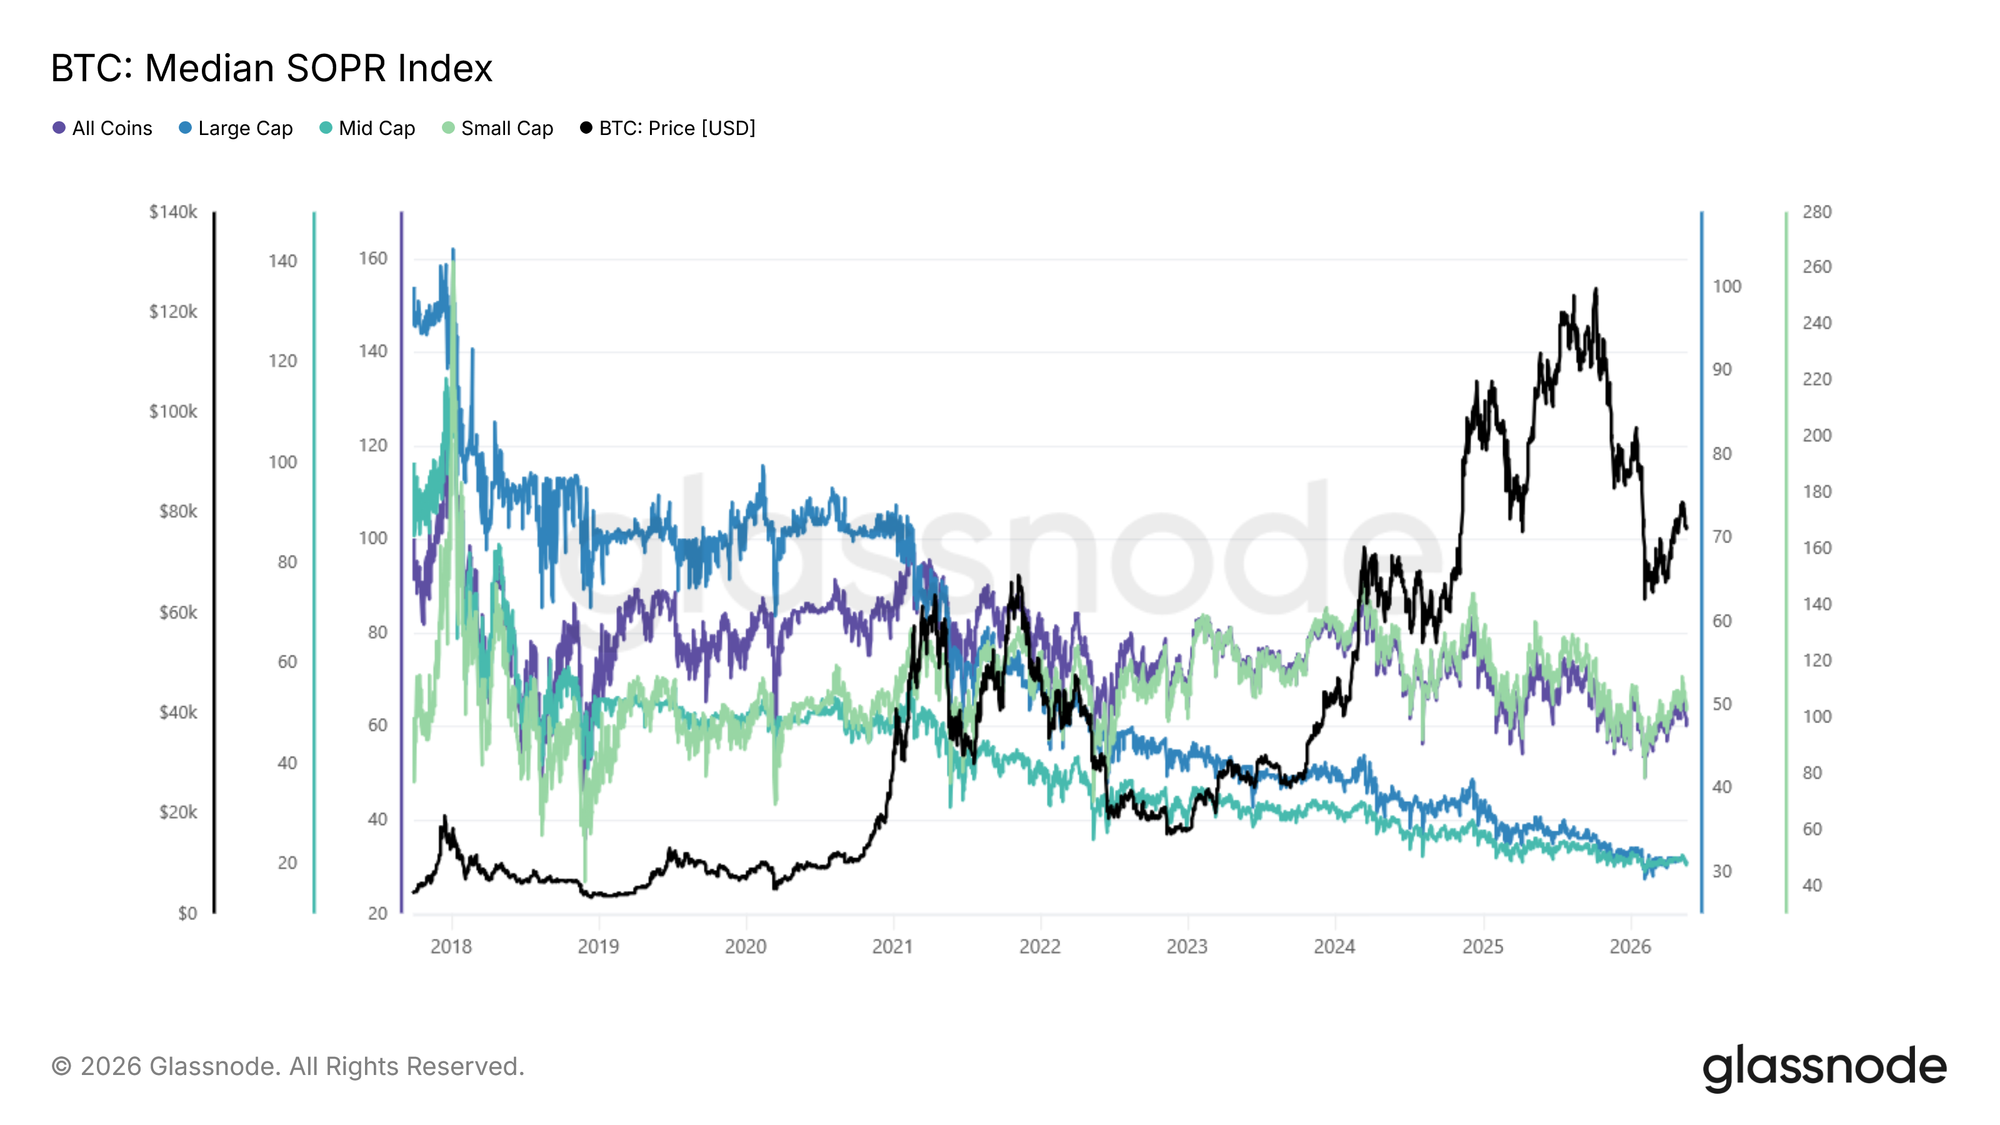
Compare to the Median SOPR: Scaled index (base 100), across the same four baskets.
View Live Metric

The raw series tells the following story: small-cap SOPR crashes to levels comparable to the 2018 and 2022 bear markets, while large and mid caps have held up better in recent cycles. The index adds an additional nuance: because appreciated small-cap coins keep leaving the basket as they grow into higher tiers, the raw series overstates how bad sentiment is for the assets that actually remain.

The raw series tells the following story: small-cap SOPR crashes to levels comparable to the 2018 and 2022 bear markets, while large and mid caps have held up better in recent cycles. The index adds an additional nuance: Because appreciated small-cap coins keep leaving the basket as they grow into higher tiers, the raw series overstates how bad sentiment is for the assets that actually remain.

Adjusted for this, small-cap sentiment is more stable than it appears. For large and mid caps no such correction applies, and what the index reveals is a genuine long-term trend: each cycle, the average holder in established assets extracts slightly less profit than the one before. As more supply locks into long-term holding, less of it cycles through at a profit.

Rather than relying on selected tokens as proxies for altcoin sentiment, the global SOPR index provides a cohort-level read directly. No need to cherry-pick individual tokens.

Derivatives Positioning: Open Interest

Open Interest (OI) measures the total value of outstanding perpetual futures contracts and provides a useful proxy for leverage concentration across the market.

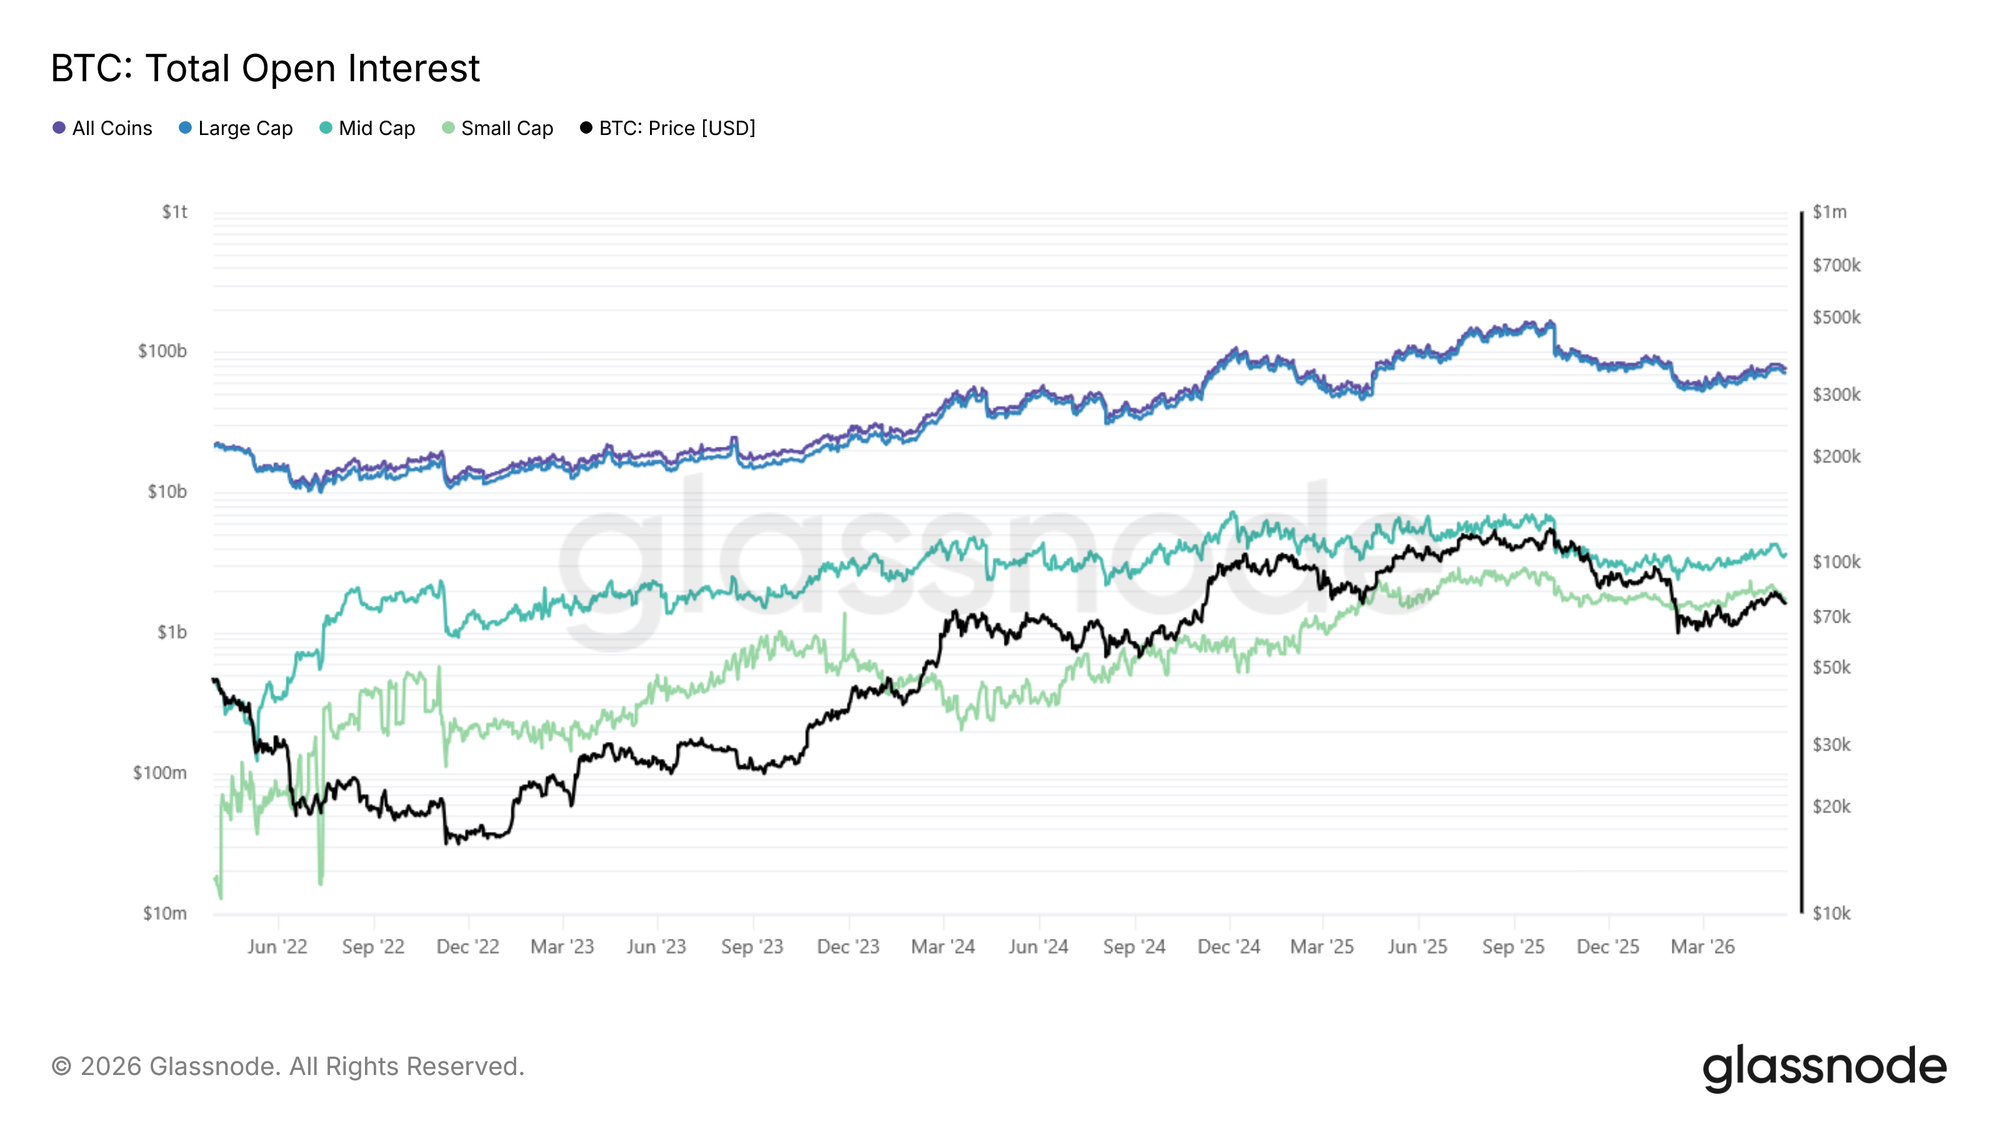
The below figure presents Total Open Interest: Raw aggregate (USD, log scale) across all four baskets, data from 2022.
View Live Metric

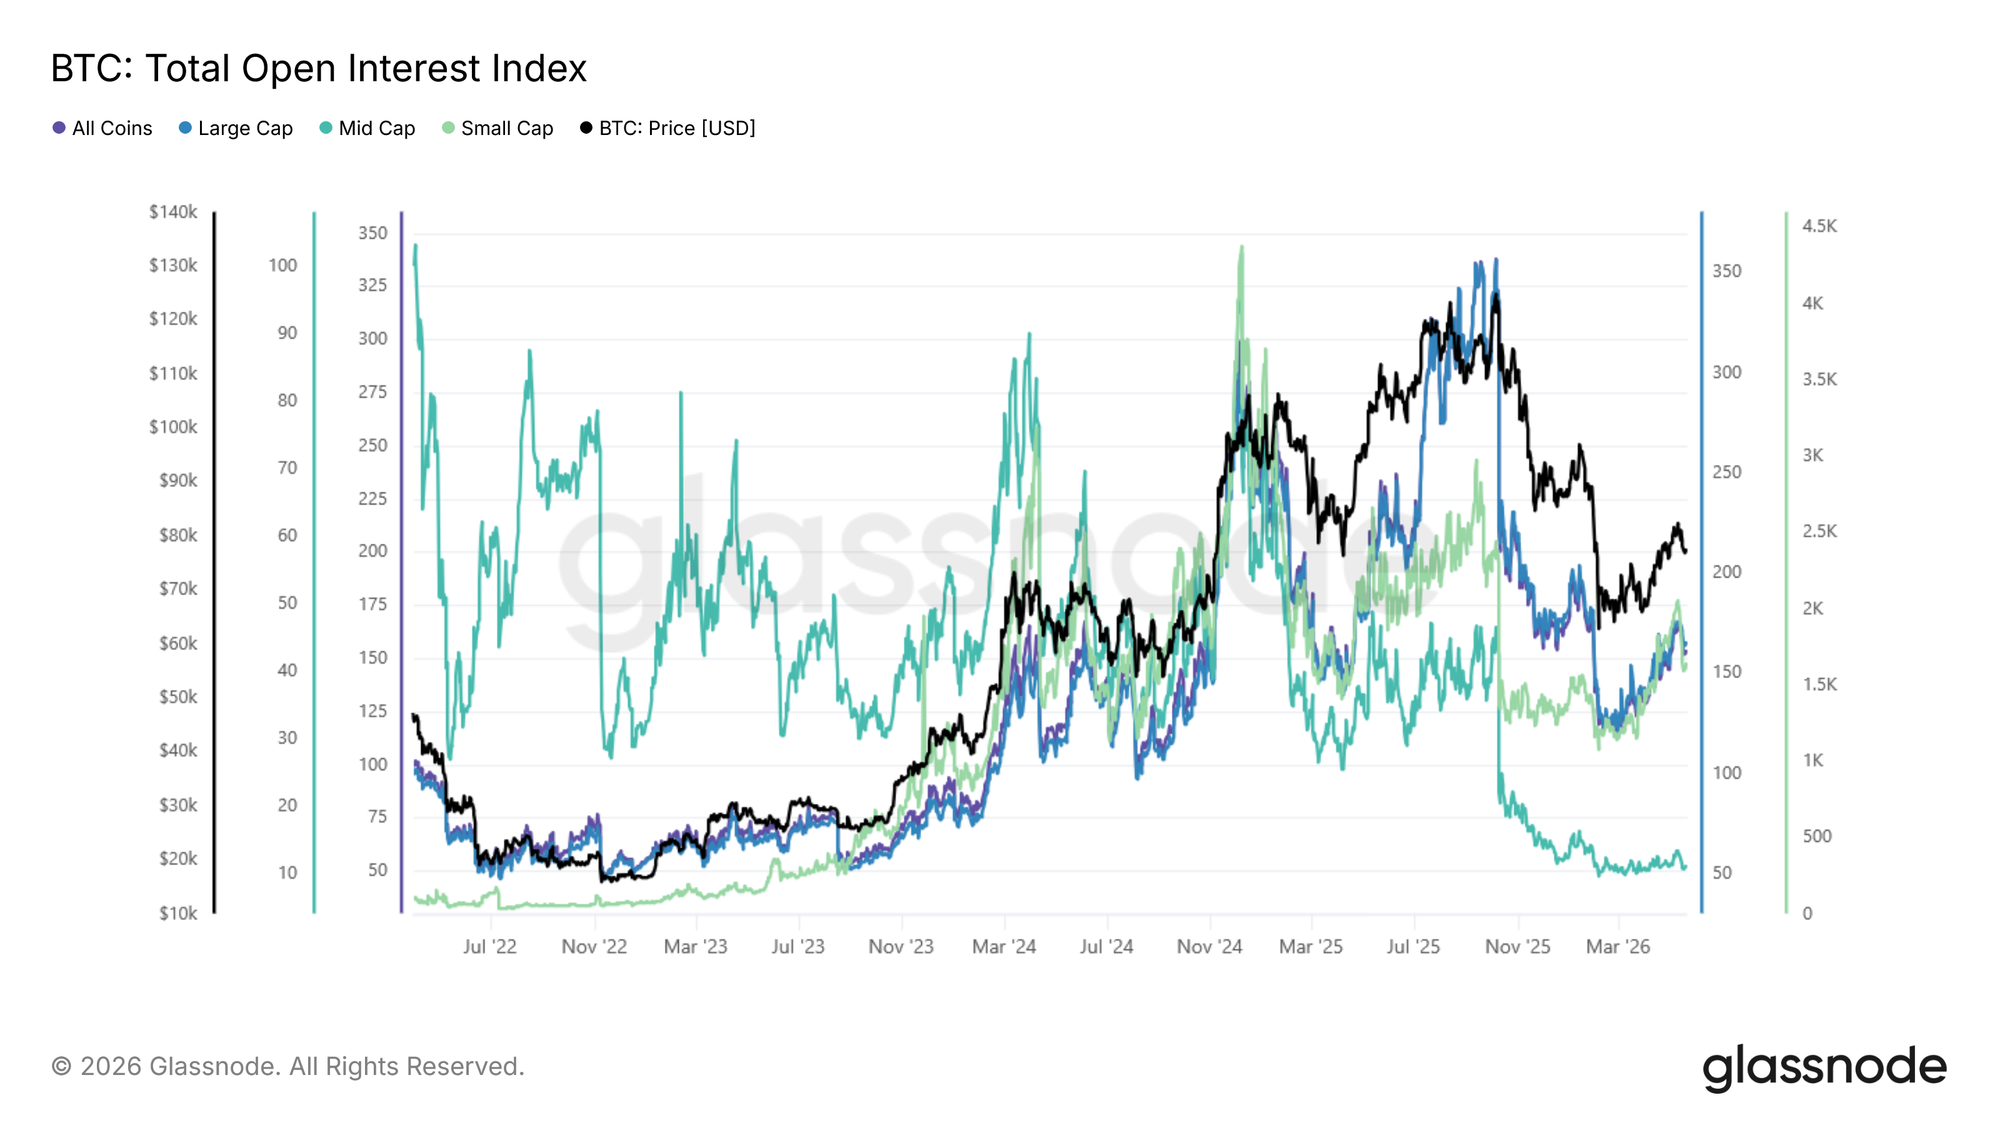
Compare that to the Total Open Interest Index: scaled (base 100) across the same four baskets.
View Live Metric

Large cap dominates open interest in absolute terms; most leverage sits on the biggest, most liquid assets. The index, however, makes the behavior of the smaller tiers comparable: mid- and small-cap open interest is far more volatile, spiking sharply during speculative episodes and unwinding just as fast. These spikes are a useful early-warning signal for cascade risk in the more fragile parts of the market.

The continuity-adjusted framework makes these shifts easier to isolate by separating changes in leverage behavior from changes in cohort composition.

The Glassnode Global Metric Suite

Four metrics are live with this release, each computed for all four baskets, sixteen time series in total. All use weekly rebalancing and equal weighting.
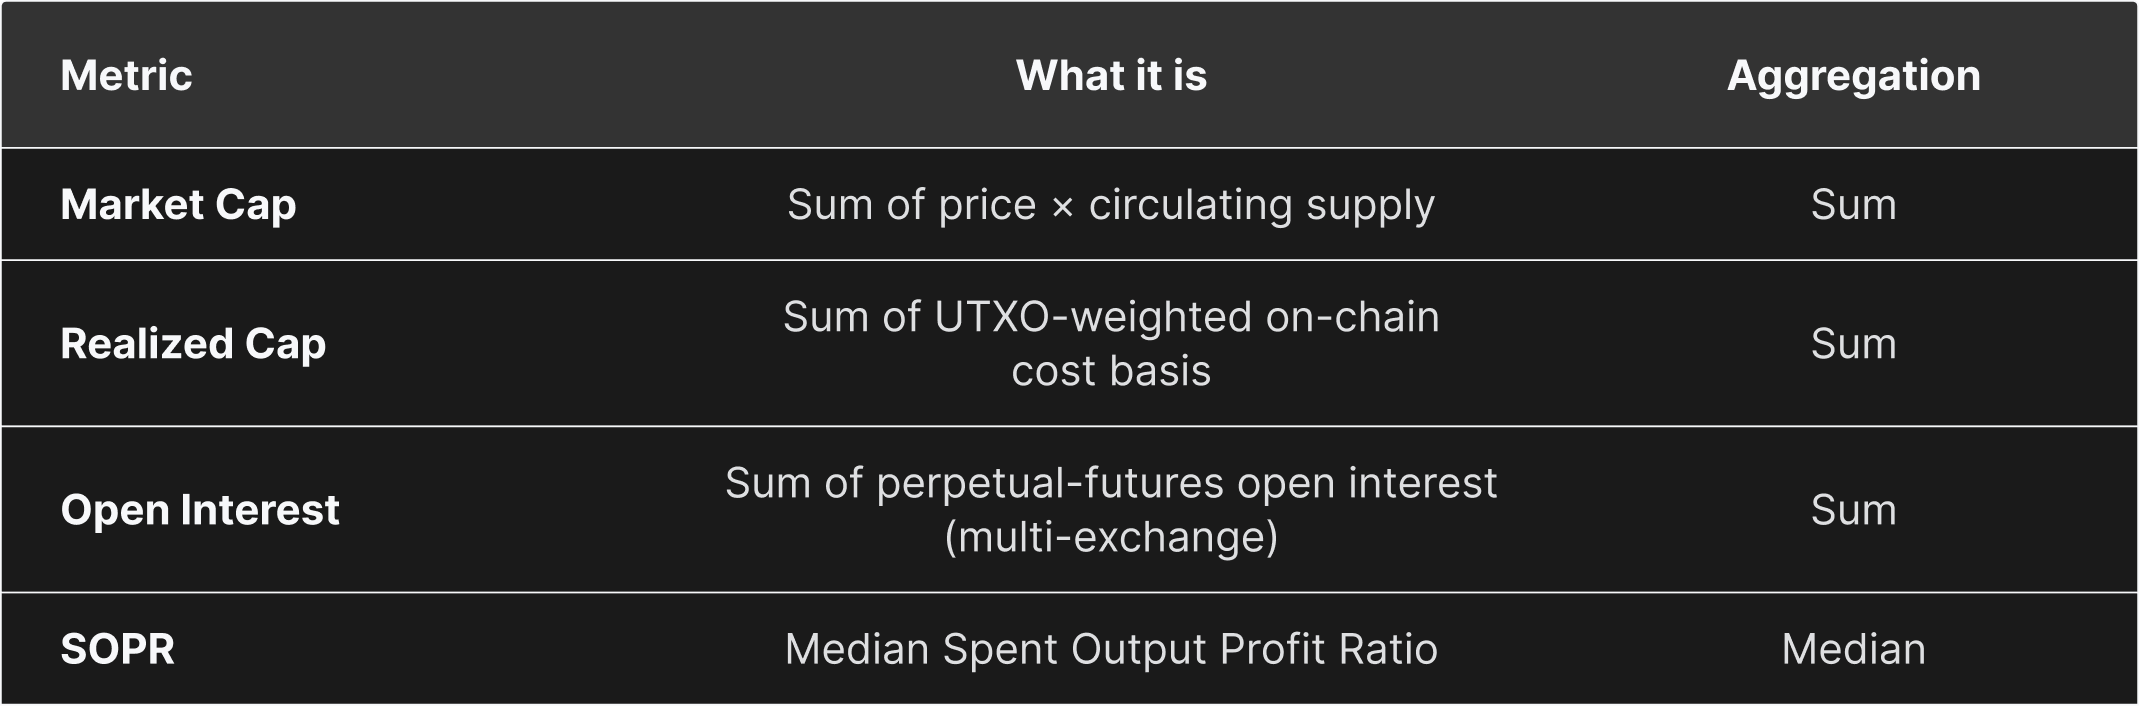
The baskets are the market-cap tiers used throughout this paper:

  • All Coins (no filter)
  • Large Cap (≥$1B)
  • Mid Cap ($100M–$1B)
  • Small Cap (<$100M).

Eligibility filtering, start dates, and the choice of sum versus median aggregation are covered in the appendix.

Accessing the Data via API

Each metric is published in two forms. 1) The raw aggregate preserves the original units (discontinuous at rebalances) and is intended to use for absolute sizing and point-in-time snapshots. 2) The index is scaled, base-100, and continuous, making it more suitable for trend analysis and cross-basket comparison.

Raw and index versions are served from separate endpoints, and each endpoint returns all baskets for that metric:

https://api.glassnode.com/v1/metrics/global/{metric}_{aggregation}_{rebalancing}_{weighting}_raw
https://api.glassnode.com/v1/metrics/global/{metric}_{aggregation}_{rebalancing}_{weighting}_index
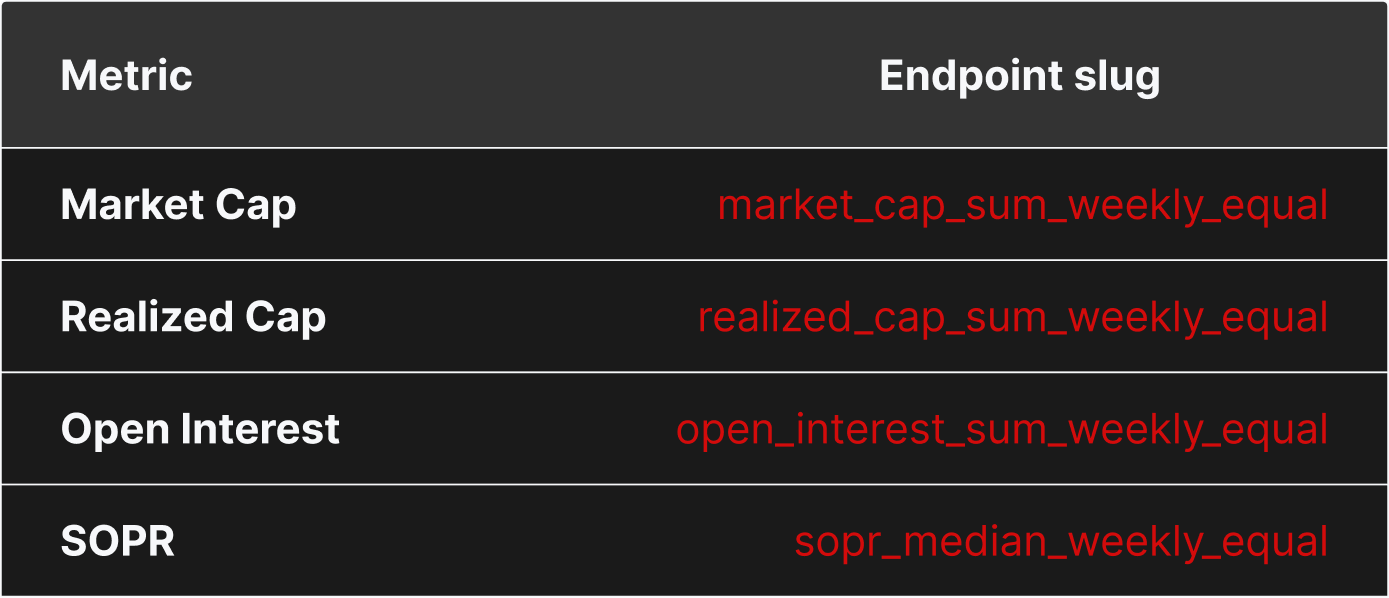
For full request details, please see the Glassnode API documentation. The framework is extensible (additional metrics, alternative weightings, and tag-based sector baskets are planned), but the four metrics above are live today, and they already bring the continuity discipline of traditional price indices to on-chain and market data for a market that is increasingly multi-asset.

Methodology

Full details on basket selection, eligibility filtering, scaling-factor formulas, and index normalization, please reach out to your account manager for access.


  • Follow us on X for timely market updates and analysis
  • Join our Telegram channel for regular market insights
  • For on-chain metrics, dashboards, and alerts, visit Glassnode Studio

Disclaimer: This report is for informational and educational purposes only. The analysis represents a limited case study with significant constraints and should not be interpreted as investment advice or definitive trading signals. Past performance patterns do not guarantee future results. Always conduct thorough due diligence and consider multiple factors before making investment decisions.


İlgili Sorular

QWhat is the core problem in aggregate market analysis of digital assets that the Glassnode Global Metrics Suite aims to solve?

AThe core problem is the structural discontinuities in aggregate metric series caused by the dynamic nature of the crypto market, where assets frequently appreciate, decline, launch, or disappear. This makes long-term trend analysis difficult when using simple raw aggregates.

QWhat are the two types of outputs provided for each Glassnode Global Metric?

AGlassnode provides two output types: 1) Raw Aggregates, which are true values in original units (e.g., USD, counts) that preserve economic meaning but can be discontinuous. 2) Indices, which are scaling-factor-adjusted, base-normalized time series designed for continuous trend analysis and cross-basket comparison.

QUsing the 2024 small-cap surge as an example, why does the 'raw aggregate' of total market cap fail to capture the rally, and how does the 'index' correct for this?

AThe raw aggregate fails because it has a 'winners leave' structural bias. When a small-cap asset performs well and crosses the $100M market cap threshold, it leaves the small-cap basket, taking its gains with it. The index neutralizes this effect by applying continuity adjustments, allowing it to reveal the dramatic 2024 small-cap surge driven by token creation platforms and memecoin mania, which was largely invisible in the raw series.

QHow does the Global SOPR (Spent Output Profit Ratio) index provide a more nuanced view of profit-taking sentiment, particularly for the small-cap cohort, compared to the raw series?

AThe raw SOPR series overstates negative sentiment for small-cap assets because appreciated coins leave the basket as they grow, making the remaining basket appear worse. The index corrects for this composition change, revealing that small-cap sentiment is more stable than it appears. For large/mid caps, the index shows a genuine long-term trend of decreasing average profit realization per cycle as more supply is held long-term.

QAccording to the article, what key insight does the Open Interest Index reveal about leverage behavior in different market-cap tiers that the raw aggregate obscures?

AWhile the raw aggregate shows large caps dominate Open Interest in absolute value, the index makes the behavior of smaller tiers comparable. It reveals that mid- and small-cap open interest is far more volatile, with sharp spikes during speculative episodes and rapid unwinds. These volatility spikes act as an early-warning signal for cascade risk in more fragile market segments, a insight obscured by composition changes in the raw data.

İlgili Okumalar

After Three Consecutive Quarters of Decline, Can the Crypto Market Find a Window for Stabilization in Q3?

The cryptocurrency market has just concluded its worst-performing quarter since 2022, with total capitalization dropping 12.6% to $2.1 trillion. All core metrics indicate capital is leaving the sector, not just rotating within it. Bitcoin fell 14.2% and Ethereum dropped 25.4% in Q2, breaking their previous correlation with US tech stocks. A key driver is the reversal in US spot Bitcoin ETF flows, which saw a net outflow of approximately $4.67 billion in Q2, including a record monthly outflow near $4.5 billion in June. While recent data suggests long-term holders are accumulating again, sustained ETF outflows mean continued selling pressure. Market focus is now singularly on the Federal Reserve. The upcoming July FOMC meeting is seen as the most critical event for Q3. A dovish signal could support Bitcoin reclaiming a $68,000-$84,000 range, while a hawkish stance might establish a new trading band around $50,000-$56,000. Additionally, regulatory uncertainty persists, with the progress of the crucial *CLARITY Act* stalling in the Senate, reducing its perceived 2026 passage probability to 40-45%. Despite the broad downturn, a few sectors showed growth. Prediction markets saw nominal volume surge 48.7% year-over-year to $113.8 billion, and tokenized collectibles transaction volume rose 143% quarterly to $1.4 billion. The Real-World Asset (RWA) tokenization sector also continued steady growth, now representing ~$28.1 billion in on-chain value. The market's foundation for an extreme crash appears limited, with Bitcoin price hovering near its 200-week moving average. However, the trading paradigm has shifted from narrative-driven speculation to decisions based on price action, policy developments, and interest rate expectations, making a broad sentiment-driven rally unlikely in the near term.

marsbit4 saat önce

After Three Consecutive Quarters of Decline, Can the Crypto Market Find a Window for Stabilization in Q3?

marsbit4 saat önce

BIT Trading Moment: BTC Still Suppressed by Weekly 200 EMA, Rejection May Restart Decline; Storage and Semiconductors that Surged Last Night Begin Falling in Evening Trading

**Crypto & Stock Market Wrap: Bitcoin Tests Resistance, Stocks Retreat After AI Surge** Bitcoin consolidates around $66,000, facing key resistance near $68,000—an area seen as a major psychological and technical hurdle where previous rallies have failed. Analysts note the cryptocurrency is caught between its 200-week moving average (~$63,333) and 200-week EMA (~$68,328). A clear break above $68k is needed to signal a stronger bullish trend, while a rejection could lead to a retest of $63k support. Market sentiment remains cautious, with low futures open interest pointing to a low-liquidity rebound rather than a full bull market. Bitcoin spot ETFs saw another $203 million inflow. US stock futures pointed lower after a strong Tuesday session led by a massive rebound in semiconductors and memory stocks. The rally was fueled by renewed optimism about AI-driven hardware demand, with Micron, SanDisk, and SK Hynix surging. However, those gains reversed in pre-market trading. Super Micro Computer (SMCI) soared over 20% after hours on strong guidance and a record backlog. Other standouts included Rocket Lab and nuclear energy plays Oklo and X-Energy. Rising oil prices (Brent above $91) and climbing Treasury yields (10-year near 4.64%), however, are reigniting inflation concerns and acting as a headwind for equities. In Asia, markets were mixed. South Korea's KOSPI pared early gains to close slightly higher as semiconductor stocks like SK Hynix gave back initial surges. Japan's Nikkei edged lower as the yen hit a fresh 38-year low against the dollar, raising fears of potential market intervention. Key events to watch include the Samsung Galaxy launch, AMD's AI event, and a slew of major tech earnings from Alphabet, Tesla, and IBM after the close on Wednesday, followed by the ECB meeting and Intel's earnings on Thursday.

marsbit4 saat önce

BIT Trading Moment: BTC Still Suppressed by Weekly 200 EMA, Rejection May Restart Decline; Storage and Semiconductors that Surged Last Night Begin Falling in Evening Trading

marsbit4 saat önce

Former CFTC Chairman, Circle President Tarbert: Preaching Long-Termism While Cashing Out $30 Million Himself

Former CFTC Chairman and Circle President Heath Tarbert has consistently advocated for a long-term vision in public, urging patience from investors as Circle’s stock price has fallen significantly from its peak. However, it has been revealed that since Circle’s IPO, Tarbert has continuously sold his CRCL shares through pre-arranged trading plans, cashing out approximately $30 million, without making any public market purchases. This contrast between his public messaging and personal actions has drawn criticism. Tarbert joined Circle in July 2023 as Chief Legal Officer, leveraging his regulatory experience to help guide the company through its IPO and expansion. Despite promoting stablecoins as long-term infrastructure, he established a 10b5-1 trading plan just before Circle went public, leading to substantial stock sales over the following year. In March 2026, he initiated another plan to sell more shares. His career trajectory highlights a pattern of moving between high-level regulatory roles and influential positions in the financial sector. After resigning as CFTC Chairman in early 2021, he joined Citadel Securities as Chief Legal Officer just 27 days later, during a period of intense regulatory scrutiny for the firm. He later joined Circle, aiding its efforts to navigate regulatory challenges for its public listing. While Tarbert's expertise in policy and compliance is valuable to companies like Circle, his actions—advocating long-term confidence while personally divesting—raise questions about the alignment between his public statements and his private financial decisions, leaving investors who followed his advice to bear the market risks.

marsbit4 saat önce

Former CFTC Chairman, Circle President Tarbert: Preaching Long-Termism While Cashing Out $30 Million Himself

marsbit4 saat önce

Gate Research Institute: The 'Wall Street-ization' Wave of Crypto Financial Products – Competition or Integration?

The article titled "Gate Research Institute: Are Crypto Financial Products Sparking a 'Wall Street' Wave—Competition or Convergence?" explores the evolving relationship between the crypto ecosystem and traditional finance (TradFi). The piece begins by reflecting on Bitcoin's original 2009 vision of decentralization, disintermediation, and moving away from banks. It then contrasts this with the 2024 landscape, where key crypto assets like Bitcoin are increasingly held through Wall Street products like ETFs issued by giants like BlackRock. The article questions whether this signifies that TradFi is systematically taking over the rights to issue, price, custody, and distribute crypto financial assets. The core argument is that this is not a zero-sum takeover but rather a bidirectional convergence where each side addresses the other's weaknesses. Crypto offers 24/7 global markets, programmable settlement, and open access but lacks compliant channels, institutional-grade custody, deep fiat liquidity, and mainstream distribution. TradFi possesses these but is constrained by legacy systems, limited operating hours, and slow settlement. Two primary convergence paths are highlighted: * **Path A (CEX to TradFi):** Exemplified by Gate, which has progressed from offering tokenized stocks and CFDs to providing direct, real stock trading (US, Hong Kong, South Korea) within its platform, using USDT. * **Path B (TradFi to Crypto):** Exemplified by Robinhood, which has integrated crypto trading, acquired exchanges like Bitstamp, and is moving traditional assets like stocks onto the blockchain via tokenization and its own Layer 2. Both paths are ultimately competing to become the next-generation, unified financial account—a "super account" where users can seamlessly trade cryptocurrencies, stocks, ETFs, RWA (Real World Assets), and tokenized treasury products in one interface. The growth of RWA and tokenized treasuries (e.g., BlackRock's BUIDL) is presented as the asset-layer fusion, providing stable, yield-bearing assets on-chain and acting as a bridge between the two worlds. In conclusion, the "Wall Street-ization" of crypto is framed as a mutual transformation. Decentralized ideals persist in the protocol layer, while at the application layer, a more efficient, global, and accessible unified capital market is emerging from this convergence. The future competition lies not between crypto exchanges and stockbrokers, but between platforms vying to offer the most comprehensive asset coverage, liquidity, and user experience within a single account.

marsbit4 saat önce

Gate Research Institute: The 'Wall Street-ization' Wave of Crypto Financial Products – Competition or Integration?

marsbit4 saat önce

İşlemler

Spot
活动图片




