Original Title:How To Find 100X Insider Polymarket Wallets To Cop,Author: Aleiah(@AleiahLock)
Compiled | Odaily Planet Daily (@OdailyChina); Translator | Asher (@Asher_ 0210)

An address on Polymarket turned $35,000 into $442,000, achieving a 12.6x return. Notably, the position was established hours before a major market movement, with the trade largely completed and cashed out before the news spread to mainstream channels. This is not an isolated incident; before the news of the "Venezuela raid" political event became public, three addresses had already positioned themselves and collectively profited $630,000 from the same event.
If such trading occurred in traditional financial markets, one might easily think of information asymmetry. But in prediction markets, all fund flows and position changes are recorded on the public blockchain; there are no hidden accounts or private transactions.
Public does not mean without gaps. The key is not whether the trades can be seen, but whether one can discern truly informative signals from the vast amount of data.
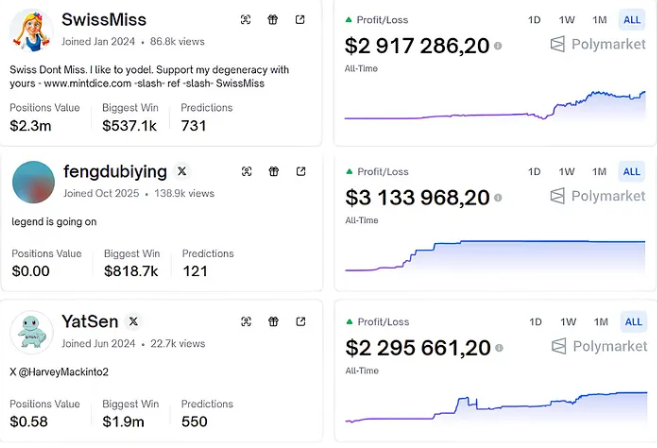
Every Trade on Polymarket is Public Data
Many prediction market participants still view Polymarket as a traditional betting platform: watch the odds, choose a direction, and bet on the outcome. But Polymarket's underlying structure is completely different from DraftKings or ordinary sports betting. All trades occur on-chain; fund flows, position sizes, and entry/exit times are all publicly visible. The operational paths of those with the most accurate judgments and sharpest timing are not post-hoc speculations but real-time on-chain records.
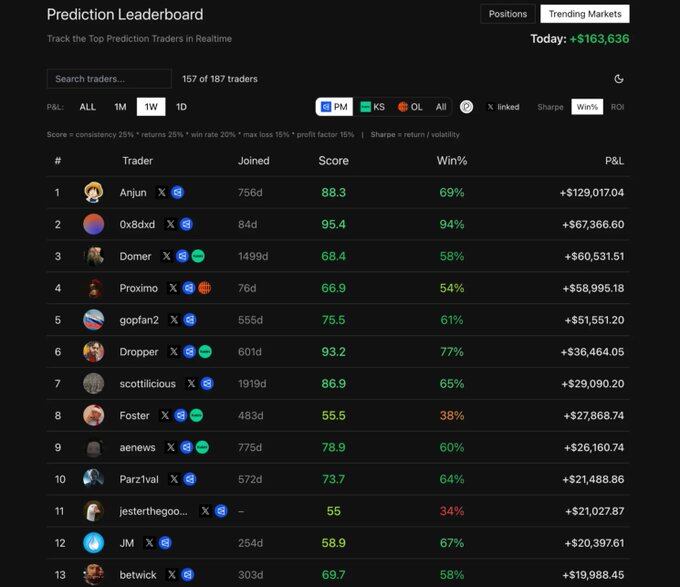
Polymarket's API is also open. Trading records, market data, historical transactions—anyone can directly call it; there is no permission barrier.
Therefore, the gap is not about who can see the data, but who can extract meaning from it. On-chain information is public, but what is valuable are the wallets worth tracking continuously and the ability to recognize behavioral changes before prices fully reflect them.
What Characteristics Do True "Insider Addresses" Typically Have?
It's important to emphasize that not all profitable wallets imply insider information. Some traders have solid research capabilities, while others rely on quantitative models and algorithmic advantages. But when profitability is repeatedly combined with specific behavioral patterns, one can observe structural features that distinguish them from "luck."
First Type: Combination of New Addresses and Unusually Large Bets
A wallet created just days ago, with very few transactions, suddenly invests a large amount of capital in a low-liquidity niche market—this behavior is not common. Especially in the absence of public catalysts, large, concentrated positions often carry stronger informational significance.
Second Type: Highly Vertical Trading Focus
Some addresses do not operate across markets but focus long-term on a specific niche, maintaining a stable and significant win rate in that area. They do not diversify across crypto prices, elections, sports, etc., but concentrate firepower on a single theme, with more decisive position decisions.
Third Type: Abnormal Changes in Position Size
When an address that has been betting with medium-sized positions suddenly significantly increases its stake in a particular market, this behavior often indicates a change in the strength of conviction. Position size itself is an attitude; a sudden change in scale usually reflects an upgrade in information or belief.
Fourth Type: Overly Precise Timing
Occasional early positioning can be attributed to coincidence, but if an address repeatedly completes its position establishment hours before major news is announced, with highly consistent direction, this temporal lead is difficult to explain simply as luck. Once is random; repeated occurrences are more likely to indicate an information advantage.
How to Systematically Screen for Potential "Information-Advantaged Addresses"
Step 1: Analyze Performance on Polymarket Leaderboards
Start with the leaderboards on Polymarket Analytics (link: https://polymarketanalytics.com/traders), sorted by 30-day P&L, using recent stable profitability as the first filter. Focus on wallet addresses with an overall positive return over 30 consecutive days, a win rate above 55%, and total profits significantly higher than total losses. Also, confirm that their trading is concentrated in markets with real liquidity, not low-volume prediction events with little participation.
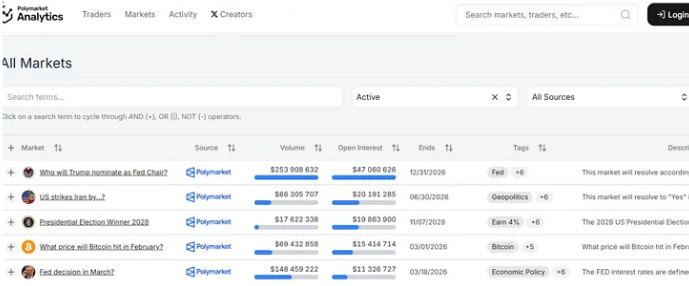
The goal at this stage is not to directly judge whether they have an information advantage, but to establish a watchlist of consistently profitable entities. A stable profit record is the foundation for subsequent behavioral analysis.
Step 2: Analyze Position Structure in Specific Events
After the initial screening, drill down into specific trading events. Enter active prediction markets and check the Top Holders list for that event. Polymarket publicly displays the addresses with the largest current positions; these large positions often represent stronger conviction.
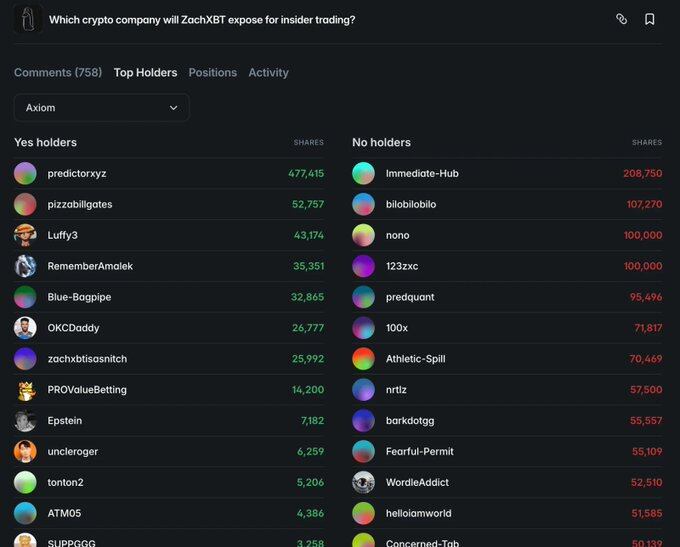
The key is not whether an address hits a single large bet, but whether its behavior is consistent. If a wallet repeatedly appears in the top holder lists for multiple significant events, and these positions are established before the market has fully priced them in, this repetition itself constitutes a signal.
A single successful bet might be chance, but repeatedly establishing large positions early, with consistent direction and verified outcomes, often indicates a judgment system with a stable advantage.
Step 3: Analyze Trading Behavior and Position Timing
After identifying candidate addresses, further analyze their on-chain transaction history, focusing on entry timing, position structure, and holding rhythm.
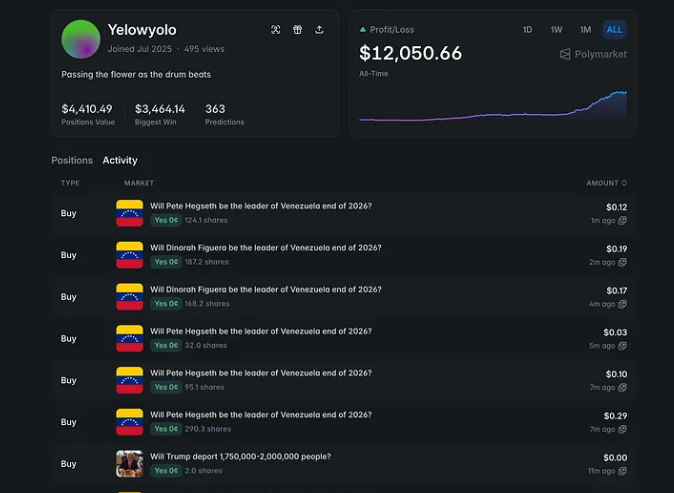
First, observe the entry time. If the purchase occurs hours before official news announcement and repeats multiple times, the timing advantage itself becomes an important variable; entering after media reports is more likely just information following.
Second, analyze the method of position building. Mature traders typically build positions in batches and add gradually, while wallets with strong informational judgment often complete concentrated positioning quickly within a short time window because their opportunity is limited.
Third, pay attention to the holding period. Some high-quality addresses choose to exit during the mid-stage of a trend's development, rather than waiting for the tail end of extreme volatility, indicating their goal is to capture the main trend rather than marginal profits.
Finally, observe their trading scope. Addresses that are highly vertical and long-term focused on a single niche are more likely to develop stable information advantages; addresses that frequently operate across sectors are more likely to rely on market sentiment rather than specific domain judgment.
Advanced Address Tracking Strategies
After mastering the basic screening methods, what truly makes a difference is the further dissection of the details of fund behavior.
First, focus on exit behavior, not just entry timing. Addresses with information advantages often not only position early but also actively reduce positions before potential negative news emerges. When a large address with a long-term stable holding suddenly significantly reduces its position without obvious catalysts, the informational content of this action is often higher than the initial buying behavior. Especially when the reduction reaches a significant proportion, this change is itself a signal.
Second, perform wallet clustering analysis using on-chain data. The relationships between addresses are not completely untraceable. Identical funding sources, similar Gas usage patterns, and transactions occurring consecutively within a very short time may reveal relationships between addresses. Many seemingly "new" accounts can often be traced back to a long-term active old address through 2 or 3 fund transfers. Tracking along the fund flow path helps identify new potential high-quality accounts before the market notices.
Additionally, pay attention to abnormal volume changes in niche markets. If a market with usually small daily trading volume suddenly experiences significant capital inflow without public news, this structural increase in volume often means some participants have acted early. Analyzing the specific addresses driving the volume change can help build a new watchlist.
Finally, cross-verify on-chain behavior with external public information. The so-called "Pizza Index" once inferred potential military action from abnormal order volumes at pizzerias near the Pentagon. Similarly, flight tracking data, social media activity of key figures, adjustments to public schedules, and other information can provide corroboration or counter-evidence for on-chain position behavior. The联动 (linkage) between on-chain fund flows and real-world signals can often strengthen the reliability of judgment.