How is the 'Bottom Structure' of a Bear Market Formed, and Where Are We Now?

marsbit2026-04-16 tarihinde yayınlandı2026-04-16 tarihinde güncellendi

Özet

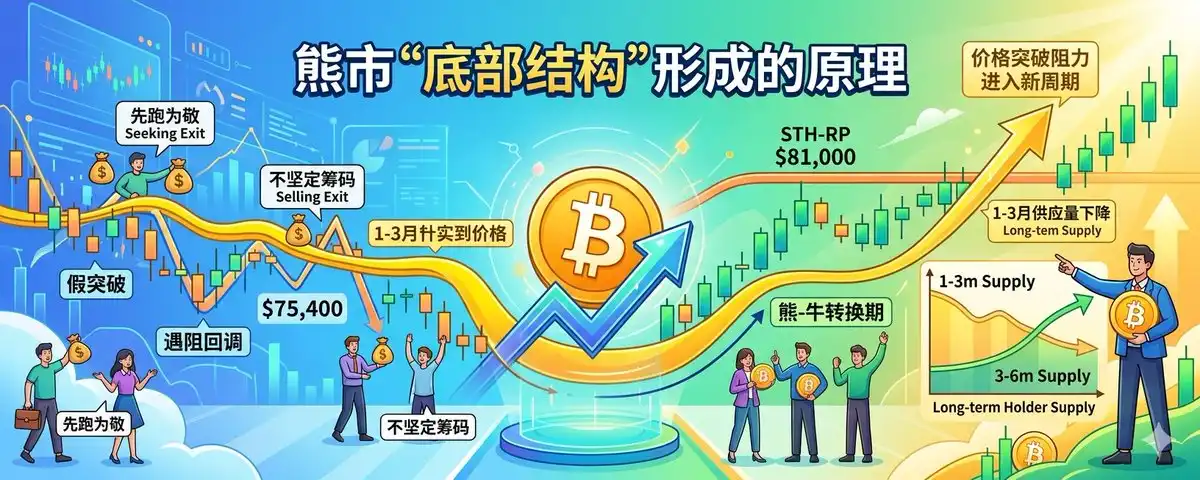
This article analyzes the formation of Bitcoin's bear market "bottom structure" by examining the relationship between cost basis and price action, particularly the behavior of short-term holders (STH). Historically, the cost basis of coins held for 1-3 months (1-3m_RP) has acted as a key resistance level during bear market rallies. This group's supply is often less committed; many entered the market expecting quick gains but were trapped. When the price rebounds to their break-even point, they tend to sell, creating resistance. Data shows that as of mid-April, the 1-3m_RP is approximately $75,400, a level Bitcoin is currently testing for the second time this cycle. The first test in mid-January failed, leading to a pullback. The author suggests a high probability of a similar outcome this time, as historical cycles show the second test rarely results in an immediate reversal. An alternative, less likely scenario is a break above this level, only to face stronger resistance at the broader STH-RP (average cost basis for all short-term holders) near $81,000, where a much larger supply of 2.31 million BTC resides. This could lead to price consolidation around the 1-3m_RP. A definitive bottom structure is confirmed only when the 1-3m_RP trend reverses from down to up, signaling a transition from a bear to a bull market. This process takes time, requiring patience to observe whether breakouts are genuine.

Author: Murphy

In past cycles, observing the relationship between cost basis and price action has been one of the best perspectives for identifying BTC's emergence from a bottom structure.

The logic is that when the price enters the cost range of a certain group of BTC holders, the price movement reflects the behavior of that group. Is it "sell first to avoid losses" or "continue to hold"?

If it's the former, the price will encounter resistance near the cost line; if it's the latter, the price can break through the cost resistance smoothly. If the price fluctuates above and below the cost line, it means the market is in a repeated state of entanglement and博弈 (game theory/contention).
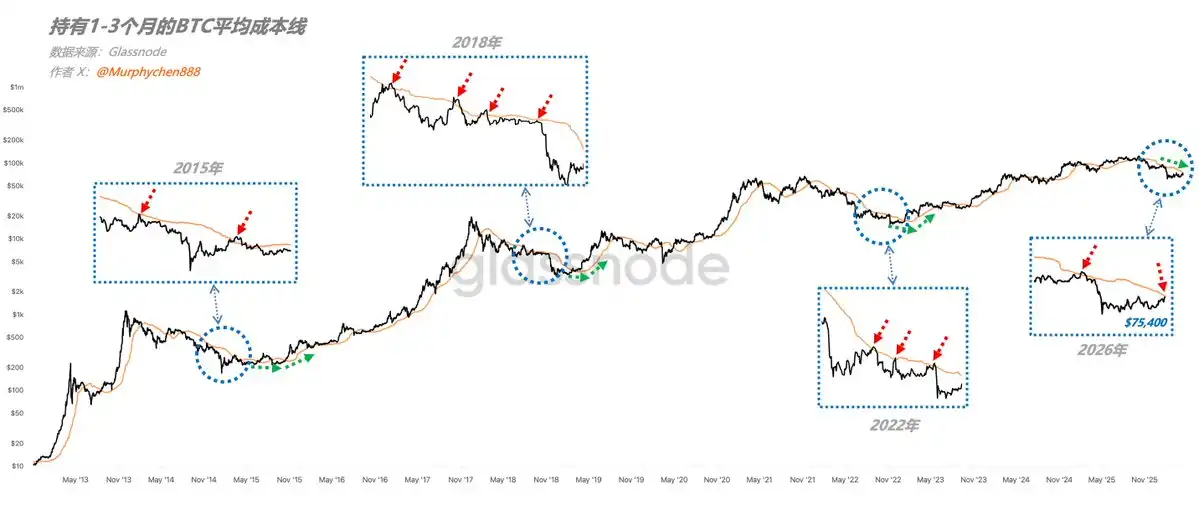
Figure 1: Average cost line for BTC held for 1-3 months

Based on long-term data research experience, I believe that among the many groups, the cost basis of short-term holders who have held for 1-3 months (1-3m_RP) is one of the most effective references (as shown by the yellow line in Figure 1).

From the chart, it can be seen that in all past bear market cycles, the 1-3m_RP has been a key resistance level for rebounds during downtrends. This is because holders of 1-3 month筹码 (chips, a term for crypto holdings) are not very firm. A large portion of them did not intend to hold long when they entered the market.

They might have originally just wanted to "get a quick profit," but ended up getting trapped and were forced to hold for 1-3 months. When the price rebounds and gives them a chance to break even, they will sell and exit without hesitation.

Therefore, we saw in 2015, 2018, and 2022, every time BTC rebounded to the yellow line and encountered resistance, it would pull back again; rebound again, encounter resistance again, pull back again......

Of course, there were also many false breakouts during this process, indicating that after some holdings started to show a profit, they "sold first to avoid losses," which then led more holdings to "follow suit," resulting in a false breakout.

Ultimately, this is a manifestation of investors' lack of confidence in the market trend.
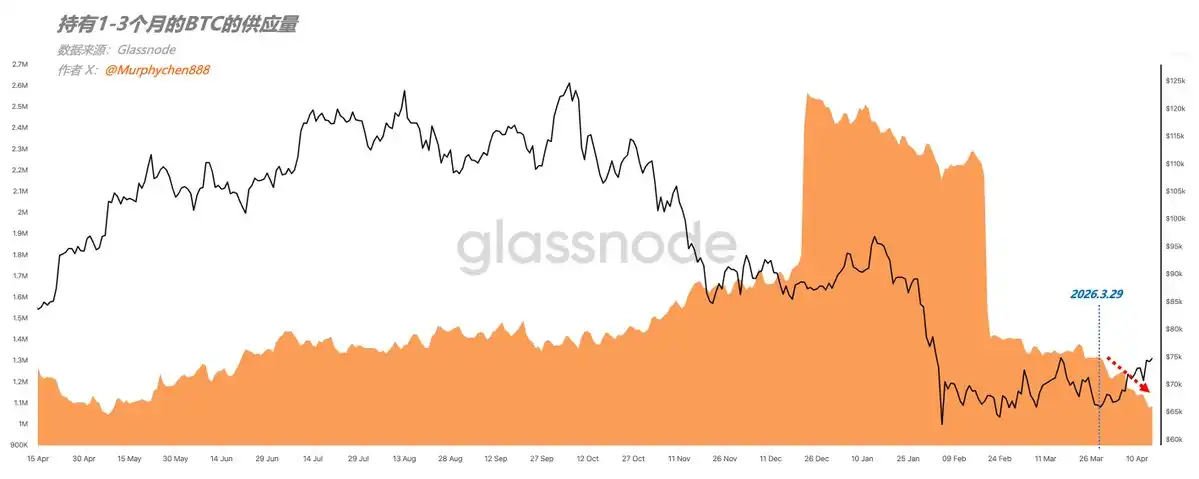
Figure 2: Supply of BTC held for 1-3 months

For example, looking at the change in the supply of BTC held for 1-3 months in Figure 2, there has been a clear downward trend after March 29th. This indicates that these holdings have decreased.

There are 2 possibilities for the decrease:

  • 1. Because they continued to be held, they were reclassified into a longer-term holding group.
  • 2. Because they were sold, they were reclassified into a shorter-term holding group.
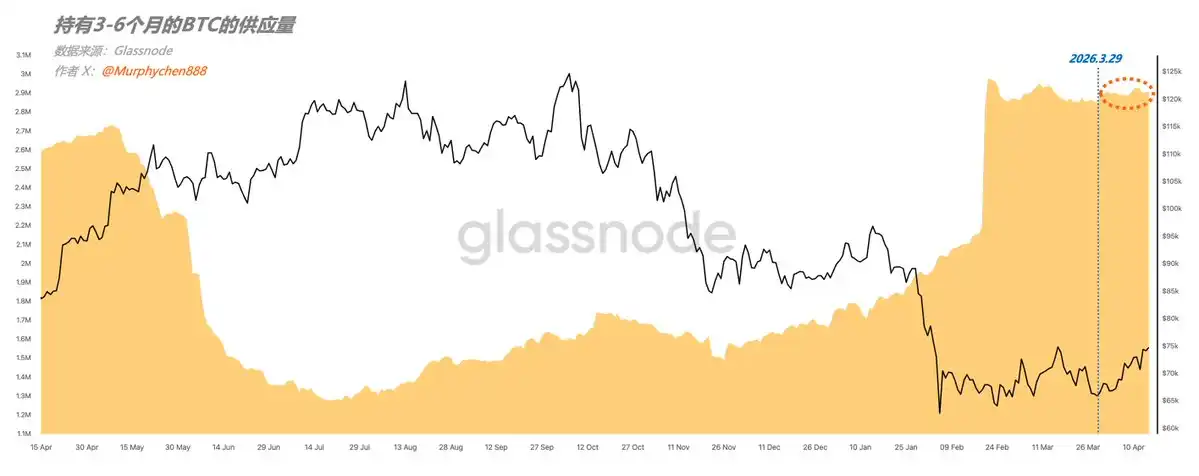
Figure 3: Supply of BTC held for 3-6 months

Looking again at Figure 3, the supply of BTC held for 3-6 months did not increase significantly after March 29th. This proves it is case 2, meaning the 1-3 month BTC was sold during the rebound, and currently there are 1.09 million left.

🚩 Now that the logic is explained, let's return to the present:

As of April 15th, the 1-3m_RP is approximately at $75,400, and the price of BTC is also right around this level. This is the second time in this downtrend that BTC has rebounded close to this resistance level.

The previous time was during January 13th - January 19th; a slight breakout triggered selling pressure and led to a continued pullback. Will it be the same this time?

Judging from past data, I believe the possibility is high; after all, in the past 3 cycles, there has never been a case where the trend successfully reversed on the second challenge.

Of course, from a rational perspective, we cannot do "path presetting." Objectively speaking, another scenario is also possible:

BTC could break through the yellow line, but thereafter encounter a larger resistance level above, namely the STH-RP (Short-Term Holder Realized Price), currently around $81,000, with 2.31 million BTC (far greater than the 1-3m holdings).

If it encounters resistance here, then BTC might experience fluctuations around the yellow line, meaning the market needs time to digest the selling pressure and begin cautiously choosing a direction.

As time passes, the yellow line will slowly start to turn, similar to the position marked by the green dashed line in Figure 1. That would mean the market has moved out of the bottom structure and entered the "bear-bull transition period."

Probability-wise, scenario 1 (second encounter with yellow line resistance) is more likely, but scenario 2 (fluctuating around the yellow line) is not entirely impossible. So we need to observe patiently, and even if there is a temporary breakout, we must judge whether it is true or false.

In any case, the direction of the yellow line is still downward and cannot suddenly turn upward. This requires a relatively long transition process, and this process is the best time for us to make decisions.


İlgili Sorular

QWhat is the significance of the 1-3 month Realized Price (1-3m_RP) in identifying a bear market bottom structure for BTC?

AThe 1-3 month Realized Price (1-3m_RP) is a key resistance level during bear market rallies. It represents the average cost basis of short-term holders who are often not firmly committed. When the price approaches this level, these holders, many of whom bought intending a short-term gain and were instead trapped, are likely to sell to break even, causing the price to face resistance and potentially reverse.

QAccording to the data, what happened to the supply of BTC held for 1-3 months after March 29th, and what does this indicate?

AAfter March 29th, the supply of BTC held for 1-3 months showed a clear declining trend. Since the supply of coins held for 3-6 months did not increase significantly, this indicates that the 1-3 month supply was sold during the price rebound rather than being held longer.

QAs of April 15th, where was the 1-3m_RP level, and what is the current price action relative to it?

AAs of April 15th, the 1-3m_RP was approximately $75,400. The price of BTC was also near this level, marking the second time in the current downtrend that the price has rebounded to approach this key resistance.

QWhat is the STH-RP, and how could it act as a larger resistance level than the 1-3m_RP?

AThe STH-RP (Short-Term Holder Realized Price) is the average cost basis for all short-term holders, currently around $81,000. With 2.31 million BTC held at this cost basis—a much larger supply than the 1-3 month cohort—it represents a more significant potential resistance level where selling pressure could cause the price to stall or reverse.

QWhat does the author suggest is the most probable outcome for BTC's price at the 1-3m_RP resistance, based on historical data?

ABased on historical data from the past three cycles, the most probable outcome is that the price will face resistance and be rejected at the 1-3m_RP level for a second time, leading to a continuation of the correction. A successful breakout on the second attempt has never occurred historically, making a rejection more likely than an immediate reversal.

İlgili Okumalar

The Verdict in Choi Tae-won's Divorce Case: Revealing the Inheritance Undercurrent Behind SK Hynix's Trillion-Won Empire

SK Group Chairman Chey Tae-won's high-profile divorce case, involving a record 1.38 trillion won settlement, has drawn attention to the succession plans for Korea's second-largest conglomerate, especially its crown jewel, SK hynix. Unlike traditional chaebol scripts centered on the eldest son, Chey's three children from his marriage to former President Roh Tae-woo's daughter, Roh Soh-yeong, are carving distinct, non-traditional paths. Eldest daughter Chey Yun-jung (b. 1989) is seen as the most evident successor. With a scientific and consulting background, she holds executive roles at SK bioscience and SK Inc.'s growth support department, focusing on future strategy and biopharma. Her marriage is to an AI infrastructure entrepreneur, not a traditional business alliance. Second daughter Chey Min-jung (b. 1991) took a unique route, voluntarily serving as a South Korean naval officer, including an anti-piracy deployment. She later worked on policy and strategy for SK hynix in Washington D.C. before co-founding an AI-driven healthcare startup. She married a former U.S. Marine Corps officer, connecting her to U.S. defense and policy circles—networks crucial for a global semiconductor giant. The only son, Chey In-geun (b. 1995), who studied physics like his father, worked briefly at SK E&S before joining McKinsey. Despite fitting the traditional "heir" profile as the eldest son, he remains silent and holds no public position or shares in SK, suggesting the old succession playbook is obsolete. As SK hynix's valuation soars, becoming a geopolitical asset in the AI era, the heirs' legitimacy is no longer automatic. They must prove themselves in fields like AI biotech, global policy, and strategic consulting. Their marriages also reflect new elite networks in tech and defense, not old political alliances. Their inheritance is the complex challenge of navigating a globalized, tech-driven world, not just a corporate throne.

marsbit11 saat önce

The Verdict in Choi Tae-won's Divorce Case: Revealing the Inheritance Undercurrent Behind SK Hynix's Trillion-Won Empire

marsbit11 saat önce

From OpenSea to OpenRouter: Is Alex Atallah Repeating His 'Exit at the Peak' Playbook?

From OpenSea to OpenRouter: Is Alex Atallah Repeating His "Exit at the Peak" Playbook? According to the Wall Street Journal, payments giant Stripe is in talks to acquire the AI model aggregation platform OpenRouter in a potential deal valuing the company near $100 billion. This would mark founder Alex Atallah's second creation of a company reaching a $100 billion valuation, following his co-founding of NFT marketplace OpenSea. OpenRouter, founded just over three years ago, has grown rapidly by acting as a unified gateway for developers to access over 400 AI models. It currently has about 10 million users and processes over 200 trillion tokens monthly. While the platform's annualized revenue is around $50 million, its valuation has skyrocketed from $1.3 billion in March 2026. The potential acquisition by Stripe, a company OpenRouter's founder once likened it to, represents a major expansion into AI infrastructure for the payments leader. This move echoes Atallah's previous timing with OpenSea, where he departed before the NFT market's significant downturn. For OpenRouter, selling now may be strategic. Despite its scale, its business model—charging a 5-5.5% fee on AI inference calls—faces pressure from competition, open-source models, and potential price wars among model providers, limiting its profitability narrative for an IPO. A key asset for potential acquirers like Stripe is OpenRouter's vast repository of real-world AI usage data, which offers unique insights into model performance and developer preferences that are difficult to replicate. Whether this potential deal signifies a new valuation benchmark for AI infrastructure or another market peak signal remains to be seen.

链捕手11 saat önce

From OpenSea to OpenRouter: Is Alex Atallah Repeating His 'Exit at the Peak' Playbook?

链捕手11 saat önce

İşlemler

Spot
活动图片