Hello everyone, I am Cody, a guest analyst for Odaily Planet Daily. Wishing all our friends an early Happy Lantern Festival!
Looking back at Bitcoin's performance last week, the overall trend largely followed the established trading framework and rhythm. In terms of short-term strategies, the market movements closely aligned with our short-term judgments, completing one short position trade (1x leverage) based on the short-term trading strategy, achieving a single trade profit of approximately 2.12% (see Table 2). For mid-term strategies, Bitcoin continued with the previously established mid-term approach, maintaining a held short position opened at $89,000 (1x leverage). As of last week's close, the price fell to around $65,770, resulting in a paper profit of about 26.10% for this mid-term trade, with a maximum floating profit of around 32.58% during the period.
From a market analysis perspective, Bitcoin overall still traded within a weak range-bound consolidation structure last week, with the pace of movement consistent with the previous judgment of the C-2 wave rebound phase; the nature of the short-term rebound remains unchanged.
Furthermore, I remain optimistic about HYPE's trend, so this weekly report continues with a weekly tracking and breakdown of HYPE's multi-cycle price structure. Last week, based on my own short-term structure assessment, a short-term long position trade (1x leverage) was executed, achieving a single trade profit of approximately 11.14%, with the trading logic and execution results forming a good correlation (see Table 1).
The following will provide a more detailed explanation surrounding market prediction, strategy logic, trade execution, and result review of the above content.
I. HYPE Trend — Prelude to the Start of Wave III?
In the weekly review on February 22nd, I first highlighted the investment opportunity in HYPE, clearly stating: its previous downtrend might be reversing, the current market is in the Wave II correction phase following the Wave I rally, and there is potential for an upcoming main upward (Wave III) movement. The core basis is: (See Figure 2)
• During the Wave I rally, the price effectively broke through the long-term descending trendline (blue line in the chart) connecting the September 2025 high (approx. $59.48) and the October 2025 high (approx. $50.17);
• At the starting point of Wave I, our self-constructed Momentum Quant Model issued a daily level momentum divergence signal;
• At the starting point of Wave I, our self-constructed Spread Quant Model triggered a strong bottom warning signal (white bars in the chart).
It is particularly noted that the effectiveness of the signals from these two models has been confirmed by the market through the strong, forceful upward movement in the Wave I rally.
1. HYPE Short-Term Operation Review (1x Leverage):(02.22~03.01)
Last week, strictly following the trading signals issued by our self-constructed Spread Trading Model and Momentum Quant Model, and combined with the prediction of the Wave III main upward movement, we executed one short-term (long) trade, successfully profiting 11.14%.
(See Table 1)
• HYPE Short-Term Trade Details Summary:(Leverage*1x)

Table 1
• Opening Decision(See Figure 3): Based on the prediction of the main upward movement; simultaneously, the Spread Quant Model issued multiple bottom warning signals (red dots in the chart), which then formed a bottom resonance signal with the Momentum Quant Model; furthermore, the price broke through and held above a previous key area. Thus, a position was opened (long) at $27.28.
• Closing Decision: The Spread Quant Model and Momentum Quant Model issued top resonance signals, so the position was closed around $30.32.
• Trade Summary: This operation successfully captured the upward opportunity in the initial phase of Wave III, achieving a profit of approximately 11.14%.
HYPE 30-minute K-line Chart
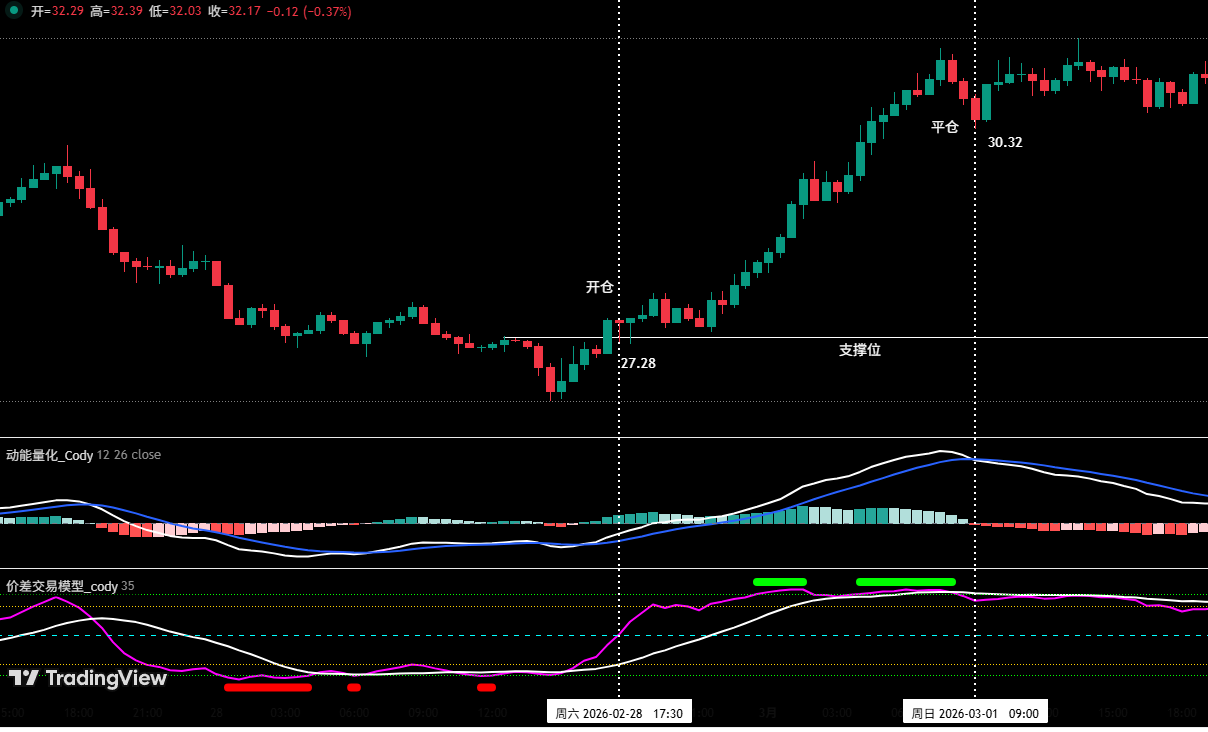
Figure 1 (Short-Term Trade Illustration)
2. Preliminary Division of Daily Level Price Structure:(Based on price action since January 21st)
HYPE Daily K-line Chart
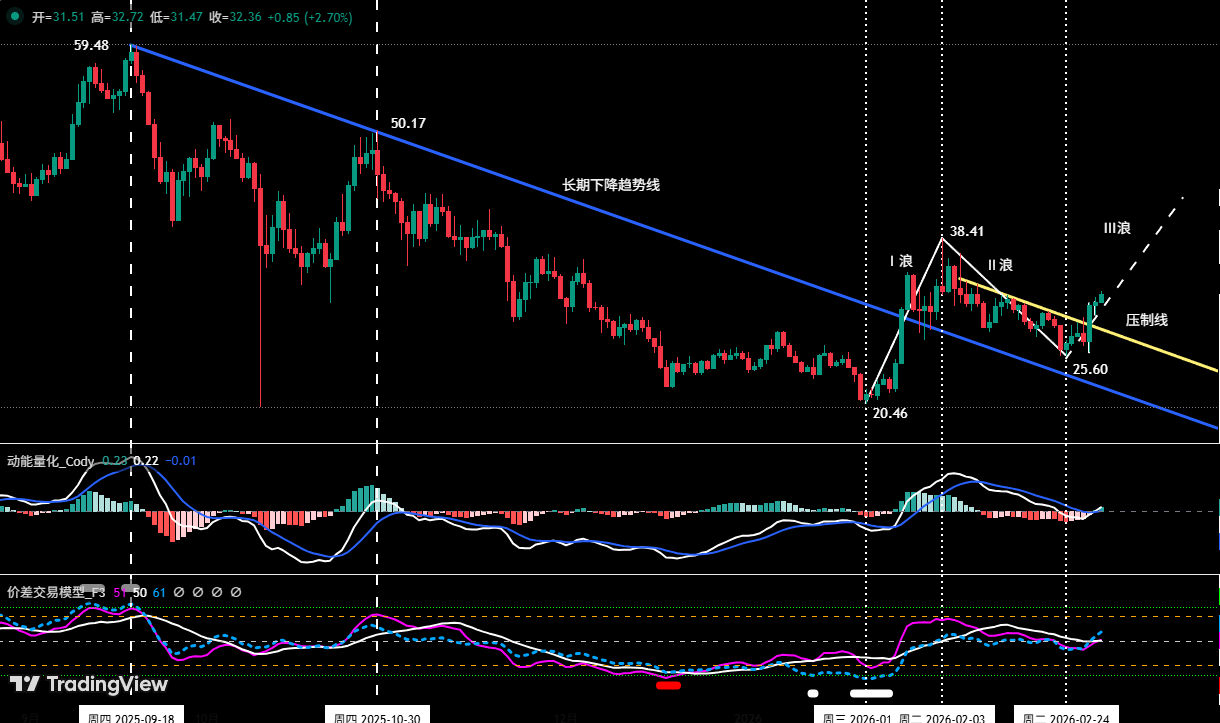
Figure 2
• Wave I (Impulse Wave): Started from the January 21st low of $20.46, ended at the February 3rd high of $38.41. Lasted 14 days, with a maximum gain of 87.73%, constituting the first main impulse wave of this upward cycle.
• Wave II (Corrective Wave): Started from the February 3rd high of $38.41, ended at the February 24th low of $25.60. Lasted 20 days, correcting the Wave I move, with a maximum drawdown of 33.35%.
• Wave III (Potential Impulse Wave): Initiated from the February 24th low of $25.60, currently in progress. The third impulse wave is often the most explosive.
• Confirmation of Wave III Starting Point Validity: The current price action has shown multiple technical characteristics符合 (conforming to) the initial phase of a strong impulse wave:
a、Breakthrough of Key Resistance Line: The price successfully broke through an important resistance line (yellow line in the chart) that had been in place since the Wave II correction, after failing to break it three times previously. This indicates a shift in the balance of power between bulls and bears.
b、Strong Momentum Validation: The rebound from the February 24th low completely covered the losses of the previous 10 days in just 6 days of gains. Particularly, the large bullish candle on February 28th, with a gain of 14.25%, showed significant strength, fitting the characteristic of strong initial momentum in Wave III.
c、Structural Trend Reversal: The current high price has surpassed two important structural points adjacent to the February 24th low during the Wave II adjustment, namely the February 21st high of $30.59 and the February 19th low of $27.73. This初步构成 (preliminarily constitutes) a "higher high" pattern, meaning the previous downward structure has been基本扭转 (largely reversed).
• Wave III Endpoint Confirmation: The high of the Wave III movement must exceed the Wave I peak of $38.41. Otherwise, this price action might still be part of a wide range consolidation or a rebound within a downtrend.
3. HYPE 4-Hour Level Detailed Structure
HYPE 4-hour K-line Chart
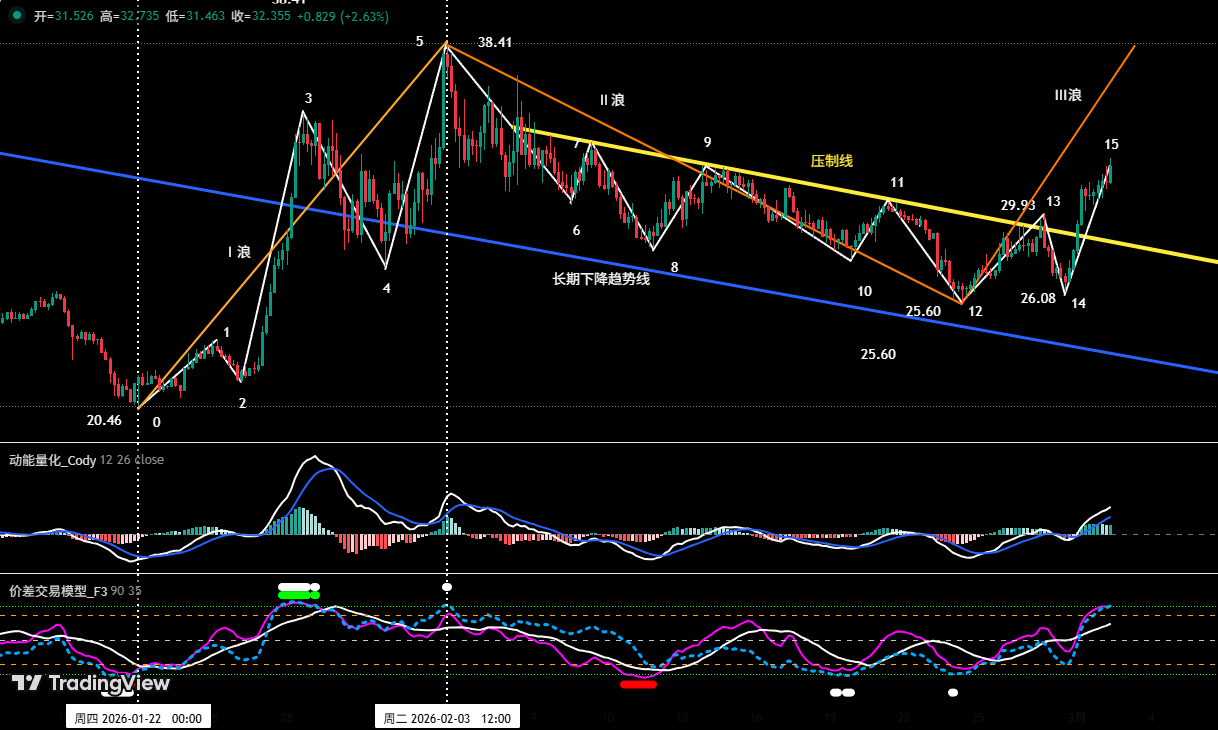
Figure 3
In Figure 3, we further细分 (detail) the wave count from the daily level mentioned above.
• Wave I Internal Structure: Can be subdivided into 5 upward moves: 0-1, 1-2, 2-3, 3-4, 4-5, forming a complete upward trend.
• Wave II Internal Structure: Can be subdivided into 7 corrective moves: 5-6, 6-7, 7-8, 8-9, 9-10, 10-11, 11-12, forming an orderly downward correction.
• Wave III Internal Structure: Currently in progress. Temporarily can be subdivided into 3 segments: 12-13, 13-14, 14-15, where the 14-15 upward segment is not yet finished.
II. Back to Bitcoin — Range-Bound Consolidation is Mainly Expected:(02.22~03.01)
1、Short-Term Operation Strategy Review:(See Table 2)
Strictly following the trading signals issued by our self-constructed Spread Trading Model and Momentum Quant Model, and combined with market trend predictions, we executed one short-term (short) trade last week, profiting 2.12%.
1、Bitcoin Short-Term Trade Details Summary:(Leverage*1x)

Table 2
2、Short-Term Trade Review:(See Figure 4)
• Opening: Price encountered resistance upon retesting the descending trendline, simultaneously the Spread Trading Model triggered a top warning signal (green dot in the chart),再加上 (coupled with) two model short resonance signals, a 15% short position was established at $68,876.
• Risk Control: Initial stop-loss for the short position set at $72,000.
• Closing: Upon approaching the support level, combined with (叠加) the model bottom resonance signal and candlestick pattern bottoming signals, the entire position was liquidated at $67,415.
• Summary: This trade profited 2.12%.
Bitcoin 30-minute K-line Chart:(Momentum Quant Model + Spread Trading Model)

Figure 4 (Short-Term Trade Illustration)
III. Bitcoin Indicator Analysis: Weekly and Daily Comprehensive Judgment
Weekly Level: Mid-Term Bearish Structure Persists
From the weekly structure, the momentum line in the Momentum Quant Model continues to decline. Although the negative momentum bars have阶段性缩短 (shortened阶段性), no effective divergence signal has formed yet, and the bearish trend has not fundamentally changed. The Sentiment Quant Model shows the market has not entered a明显的超卖恐慌区间 (clear oversold panic zone), and conditions for bottom sentiment repair remain insufficient; simultaneously, the Digital Monitoring Model has also not given a bottom confirmation signal.
In terms of chart structure, last week's weekly candle closed as a阴线 (bearish candle) with a loss of about 2.76%. The price broke below the previous triangle convergence structure, with the center of gravity明显下移 (clearly moving lower). The overall pattern aligns more with the characteristics of a下跌中继 (downtrend continuation/pause), indicating the mid-term trend remains weak.
Daily Level: Oversold Rebound Continues, But Momentum is Limited
Observing the daily level, the market maintained a horizontal consolidation pattern within the short cycle. The momentum line formed a "golden cross" below the zero axis and rose slightly, indicating short-term rebound momentum is being released. However, the排列无序 (disordered arrangement) and lack of persistence in the positive momentum bars suggest the rebound节奏偏弱 (pace is relatively weak).
Regarding the Sentiment Quant Model, although sentiment indicators are slowly moving out of the oversold zone, capital participation remains limited. Both bulls and bears are mainly观望 (watching), making it difficult to push the market into a trend upward attack.
Multi-Cycle Comprehensive Judgment
Combining weekly and daily analysis, Bitcoin is currently still trading within a bearish-dominated downward structure. The daily level rebound is more inclined to be a technical correction within the下跌过程 (downtrend process). Until the weekly trend is effectively reversed, the height and sustainability of the rebound仍需保持谨慎对待 (still need to be treated with caution).
The above data suggests: The daily bearish trend has not changed; the oversold rebound is continuing.
IV. Market Prediction:(03.02~03.08)
1、Bitcoin Upward Center Construction (Based on price action since the February 6th low)
Bitcoin 4-hour K-line Chart

Figure 5
Using Bitcoin's 4-hour chart as the operation cycle:
• Center Construction: From the 4-hour chart, it is known that the probability is still high that an "upward center" structure is being built. Its highest resistance is around $72,300, and the lowest support has moved down to around $62,500.
• Core Operation Plan:
• Upward Rebound: If the price effectively breaks through the resistance near $72,300, escaping the current "center gravity", it may continue the C-2 segment oversold rebound trend, but the rebound space is expected to be limited.
• Downward Adjustment: The current center's lowest support has moved down to around $62,500, close to the February 6th low of $60,000. If the price breaks below this support, the C-2 segment oversold rebound might end, potentially initiating the C-3 segment adjustment行情 (price movement).
• Regardless of which of the above trends the price follows, it is recommended that investors adhere to the strategy of primarily "selling high (shorting)" in short-term operations.
2、Core View for This Week: Maintain the expectation of range-bound consolidation, paying attention to the struggle between bulls and bears near the edges of the range. Strategically, firmly implement the operating principle of "reduce positions (longs) on rallies, control risk".
3、Core Resistance Levels:
• First Resistance Zone: $68,500-$70,000 area (previous筹码密集成交区 - dense transaction area)
• Second Resistance Zone: $72,300-$74,500 area (near last April's low)
4、Core Support Levels:
• First Support: Around $65,000 (previous important support area)
• Second Support: $60,000~$62,500 area (near the February 6th low)
• Third Support: Around $57,400 (near the 210-week moving average)
V. Plan A & B Strategies (Excluding Impact of Sudden News):(03.02~03.08)
1、 Mid-Term Strategy: Maintain 60% short positions. If the rebound effectively breaks through $74,500, reduce the position to 40%.
2、 Short-Term Strategy: Utilize 30% of capital, set stop-loss points, and look for "spread" opportunities based on support and resistance levels. (Use 30-minute/60-minute as operation cycles).
3、As the market's mid-term direction is bearish, Bitcoin short-term operations should follow the principle of "go with the trend, sell high (short)". To dynamically respond to the market's complex evolution and combine with signals from our self-built trading models, we have formulated Plan A/B for short-term operations:
• Plan A: If the price rebounds to the resistance area $70,000~$72,300:
• Open Position: When the rebound encounters resistance signals in this area combined with model top signals, a 15% short position can be established.
• Risk Control: Initial stop-loss for shorts set above $75,500.
• Close Position: When falling near important support levels combined with model signals, gradually liquidate to close the position and take profits.
• Plan B: If the price rebounds to around $74,500:
• Add Position: When the price continues to rebound and encounters resistance in this area combined with model top signals, add a 15% short position.
• Risk Control: Initial stop-loss for shorts set above $75,500.
• Close Position: When falling to support levels combined with model signals, gradually liquidate to close the position and take profits.
VI. Special Notes:
1. When Opening a Position: Immediately set the initial stop-loss level.
2. When Profit Reaches 1%: Move the stop-loss to the entry price (breakeven point), ensuring capital safety.
3. When Profit Reaches 2%: Move the stop-loss to the 1% profit level.
4. Continuous Tracking: Thereafter, for every additional 1% profit, move the stop-loss up同步 (synchronously) by 1%, dynamically protecting and locking in profits.
Financial markets change rapidly; all market analysis and trading strategies require dynamic adjustment. All views, analytical models, and operational strategies involved in this article are derived from personal technical analysis, intended solely for personal trading log purposes, and do not constitute any investment advice or operational basis. The market involves risks, investment requires caution, please do not make decisions based on this.