GPUs Have No 'Price': Four Indices Clash, the Compute Market Is More Chaotic Than You Think

marsbit2026-04-08 tarihinde yayınlandı2026-04-08 tarihinde güncellendi

Özet

The GPU compute market lacks a clear price benchmark, with four major indices on Bloomberg Terminal showing significant divergence—differing by over $2 and moving inconsistently. This reveals a fragmented and inefficient market for AI compute power, particularly for H100 and B200 GPUs. While demand surges and supply constraints are real, pricing is highly opaque and varies by contract type, provider, and location. The absence of standardized contracts, reliable benchmarks, and liquid secondary markets leads to hoarding and informal subleasing. Key issues include inconsistent pricing methodologies, unstandardized agreements, quality assurance gaps, and no forward pricing mechanism. Without coordinated improvements in infrastructure and market design, establishing a true price for GPU compute remains impossible.

Author: David Lopez Mateos

Compiled by: Deep Tide TechFlow

Deep Tide Guide: The media likes to summarize the rise and fall of GPU compute prices with a single number, but the reality is: the quotes from four index providers on the Bloomberg terminal diverge by more than $2, with inconsistent directions and rhythms. The author of this article is David Lopez Mateos, founder of the GPU compute trading platform Compute Desk. Using first-hand transaction data, he breaks down the real pricing structure of H100 and B200, revealing a primitive market with no consensus benchmark, no standard contracts, and no forward curve—compute power is being hoarded and sublet like short-term rental apartments.

Media headlines would make you think GPU compute prices are soaring. This narrative is comfortable, perfectly fitting into the macro framework of "supply crunch + bottomless AI demand," and it implies something reassuring: we have a well-functioning market with clear and readable price signals.

But we don't. This narrative is almost entirely built on a single index, and it implies something that shouldn't be implied: the GPU rental market has become efficient enough to be represented by a single number.

The supply crunch is real, but the crunch felt by different people is completely different—depending on who you are, where you are, what contract you're trading, and what compute asset. Faced with this opacity, the market's natural reaction is not orderly price discovery but hoarding: locking in GPU time you might not even need yet, because you're not sure if you can get it at any price next month. Where there is hoarding and no transparent benchmark, fragmented secondary markets emerge. At Compute Desk, we have already facilitated tenants subletting their clusters like apartments during major events. This is not a hypothesis; it is happening.

Indices Do Not Converge

In mature commodity markets, indices built on different methodologies tend to converge. Brent crude and WTI have a few dollars of spread due to geographic location and crude quality, but they move in sync directionally (Figure 1). This convergence is a hallmark of an efficient market.

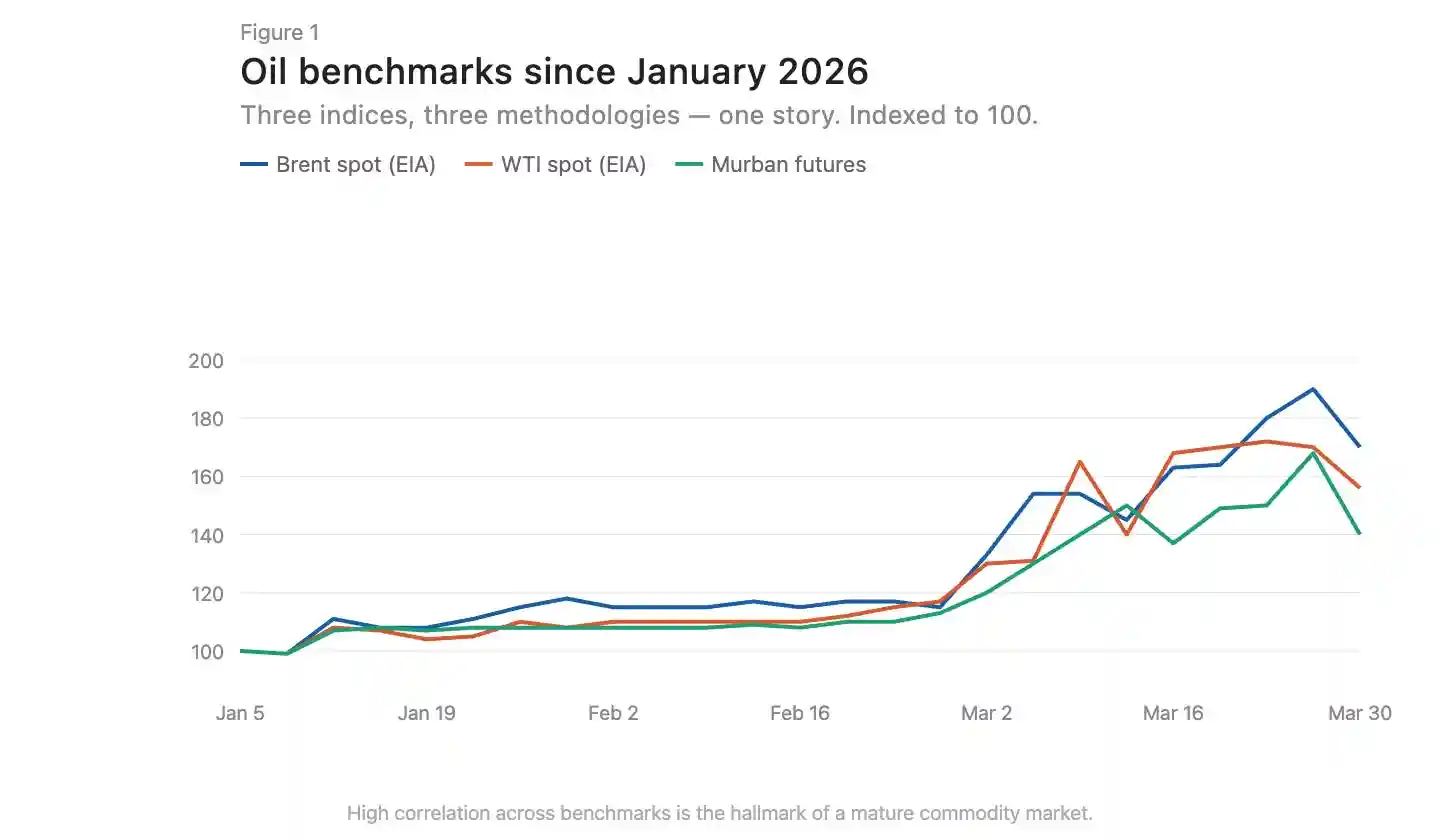
Caption: Comparison of Brent and WTI crude oil price trends, showing high directional alignment

There are now three GPU pricing index providers on the Bloomberg terminal: Silicon Data, Ornn AI, and Compute Desk. SemiAnalysis just released a fourth—a monthly H100 one-year contract price index based on survey data from over 100 market participants. Silicon Data and Ornn publish daily H100 rental indices, Compute Desk aggregates data at the Hopper architecture level, and SemiAnalysis captures negotiated contract prices rather than listed or crawled prices. Different methodologies, different frequencies, different angles of insight into the same market. Overlaying them reveals clear divergence (Figure 2).

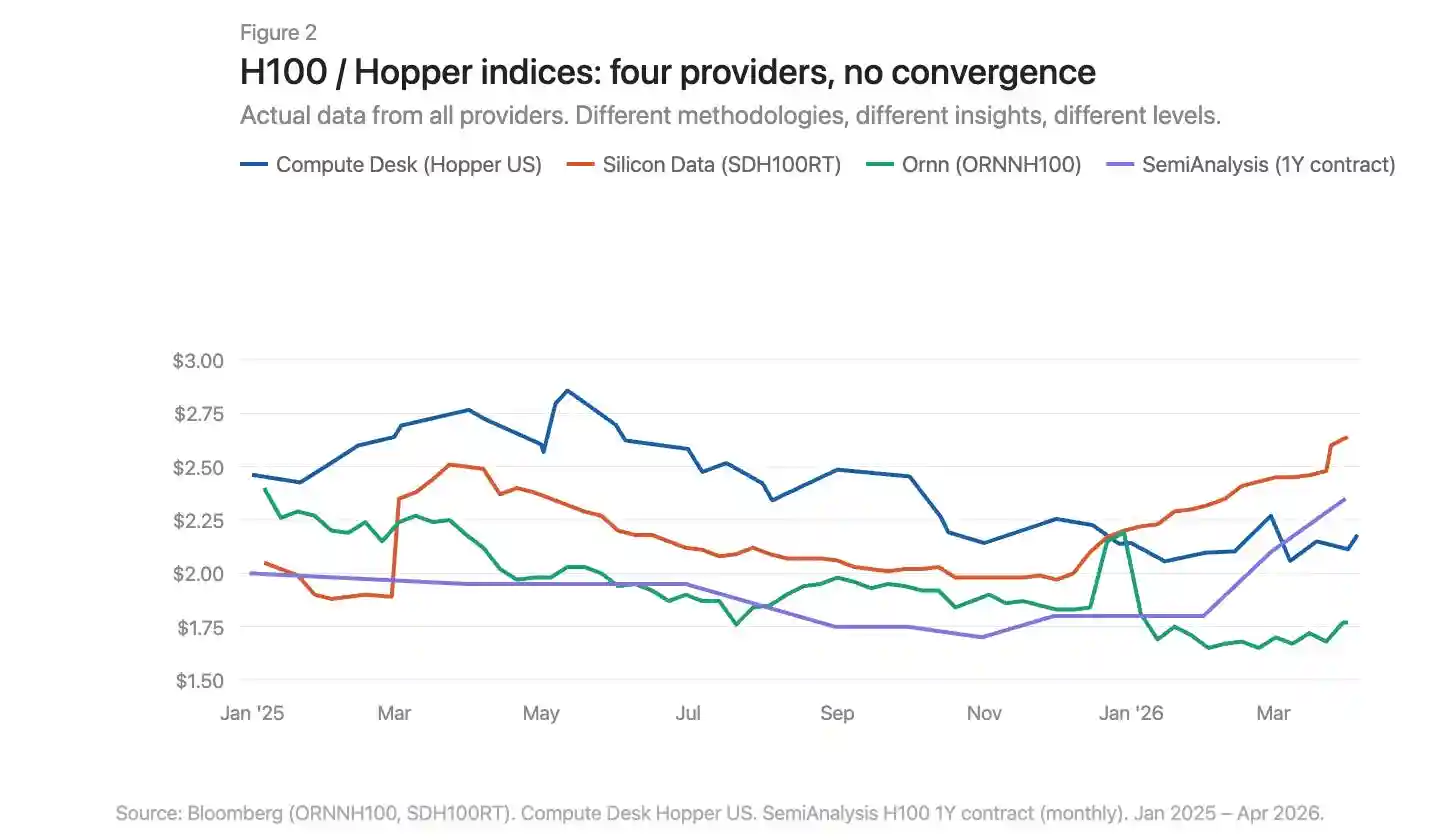
Caption: Overlay comparison of four GPU indices, showing significant divergence in price levels and trends

Where Exactly Is the Price Increase Happening

Using Compute Desk data, we can break down H100 price changes by supplier type and contract structure, and overlay Silicon Data's SDH100RT index (Figure 3). All indicators show prices rising, but the starting points and magnitudes vary greatly depending on the index and contract type.

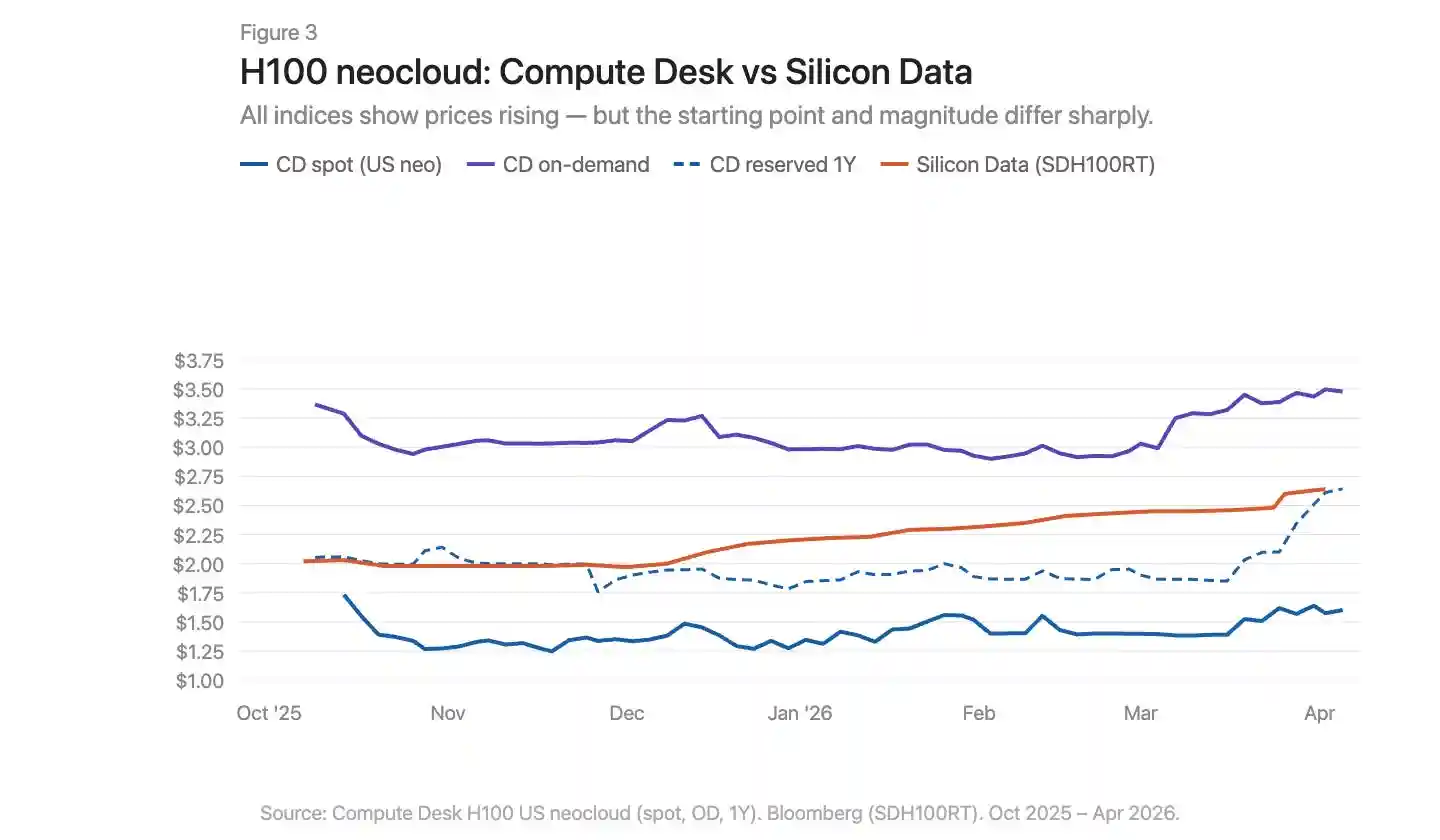
Caption: H100 price trends by contract type overlaid with the SDH100RT index

Compute Desk's H100 neocloud data tells a more specific story than the aggregate index. On-demand pricing was relatively stable throughout the winter, around $3.00/hour, then surged sharply to $3.50 in March. Spot pricing was noisier and lower, with only a slight upward trend until March. Silicon Data's SDH100RT shows a smoother, steady rise, increasing from $2.00 to $2.64 over the same period. The two indices remain at different price levels and describe different time rhythms: Compute Desk shows a March spike, Silicon Data shows a slow climb.

One-year reserved pricing was largely flat until February, then jumped sharply from $1.90 to $2.64 at the end of March—not a gradual catch-up, but a sudden repricing. This looks more like suppliers collectively adjusting contract rates after the on-demand market tightened, rather than a continuous structural demand driver.

The March story for B200 is even more dramatic (Figure 4). Compute Desk's on-demand index exploded from $5.70 to over $8.00 within weeks. Silicon Data's SDB200RT surged from $4.40 to $6.11 before falling back to $5.47. Both indices recorded this move, but the starting points differed by over $2, and the shapes of the rise and fall were different. B200 has less than five months of data, fewer suppliers, and larger spreads; the two indices are viewing the same event through very different lenses.

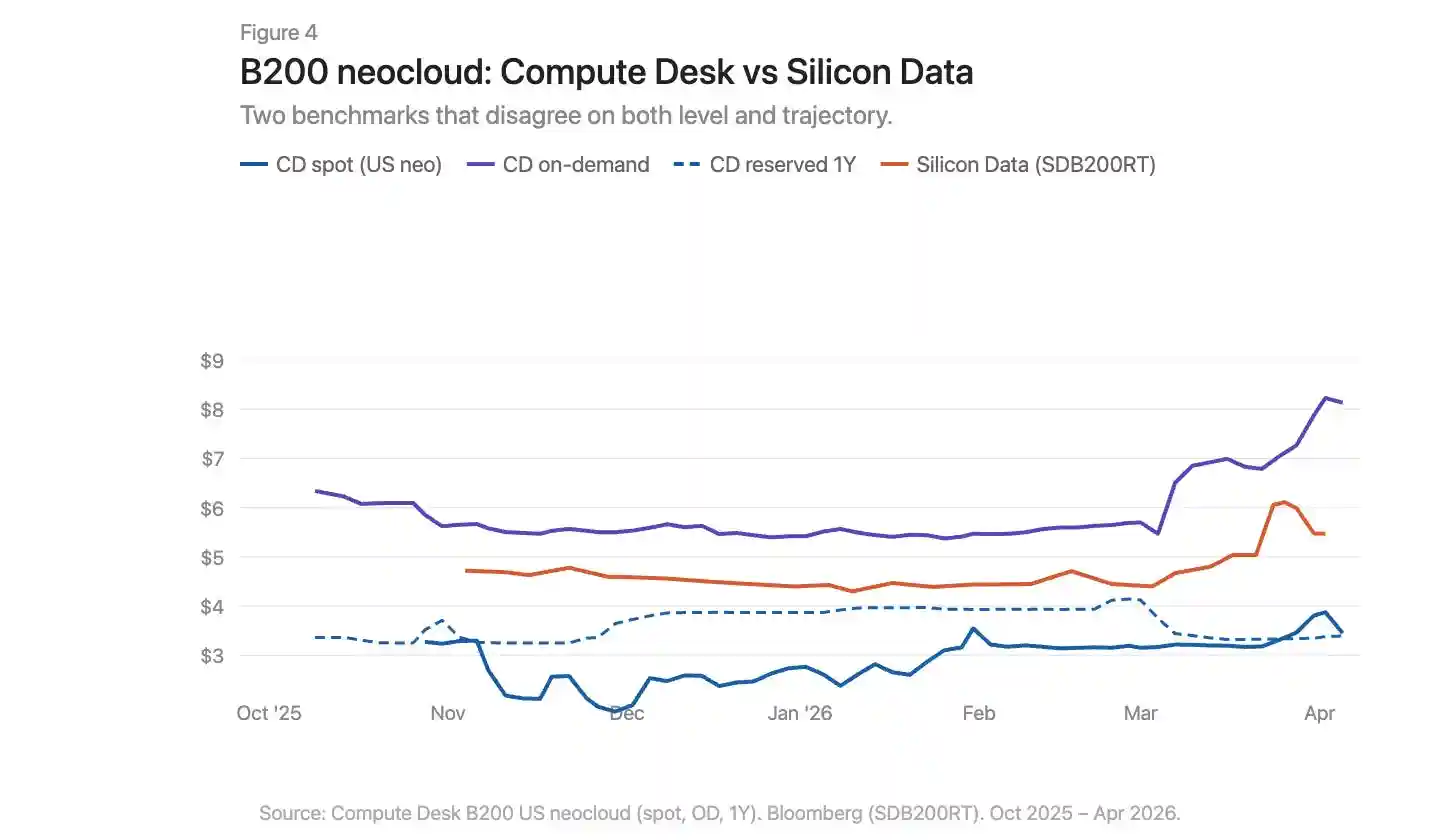
Caption: B200 on-demand and reserved price trends, overlaid with Compute Desk and Silicon Data data

Infrastructure Issues, Not Just Geographic Differences

Commodity markets have basis differentials. Appalachian natural gas is a textbook case: massive reserves sit atop structurally constrained pipeline capacity, with utilization rates in the Pennsylvania-Ohio corridor often exceeding 100%, and new projects like the Borealis Pipeline not coming online until the late 2020s.

The GPU market has a similar situation: an H100 in Virginia and an H100 in Frankfurt are not the same economic good. But geographic differences alone cannot explain why indices measuring the same market diverge so much. The dislocation in the GPU market is deeper than in Appalachian natural gas. The problem with natural gas is a single missing link: pipeline capacity connecting supply and demand. The infrastructure gap in the compute market exists on both the supply and demand sides. Physical infrastructure—the consistent networks, predictable configurations, and predictable availability needed for reliable compute distribution—is not yet mature and sometimes simply doesn't work. Financial infrastructure—standardized contracts that compress spreads despite physical differences, transparent benchmarks, arbitrage mechanisms—also doesn't exist yet.

The data tells one story. The real, painful experience of trying to procure compute in early 2026 tells another. On-demand capacity for all GPU types is virtually sold out. Finding 64 H100s is difficult: Compute Desk shows 90% of suppliers have zero on-demand cluster availability, and the reserved market isn't much better. In a well-functioning market, this level of scarcity would have pushed prices to a new equilibrium. But it hasn't. This suggests suppliers themselves lack real-time pricing intelligence to adjust. Prices are rising, but too slowly to clear the market. The gap between listed prices and true willingness to pay is being filled by hoarding, subletting, and informal secondary market transactions.

What Needs to Change

The current GPU compute market has seven core problems:

No consensus benchmark. Multiple indices coexist with different methodologies and contradictory conclusions.

Aggregate narratives mask structure. A single "H100 price" number masks huge differences between supplier types and contract terms.

Lack of transaction-level data. In bilateral markets, the deviation between listed prices and actual transaction prices is very large.

No contract standardization. Most GPU rentals are bilaterally negotiated with varying terms. Shorter, more standardized contract terms would improve liquidity and price discovery.

No delivery quality guarantee. Interconnect topology, CPU pairing, network stack, and uptime vary enormously. Buyers need to know the quality of the compute they are purchasing before committing.

Contracts lack liquidity. If demand changes during a reservation, options are limited: either eat the cost or sublet informally. The market needs infrastructure to transfer or resell committed compute, allowing capacity to flow to those who need it most.

No forward curve. Without the ability to price forwards, there is no hedging. This is why lenders discount GPU collateral by 40%-50%, keeping financing costs high.

Building a properly functioning market for the most important commodity of the century cannot advance on just one front. Measurement, standardization, contract structure, delivery quality, liquidity—these must advance in sync. Until then, no one can truly say what a GPU hour is worth.

İlgili Sorular

QWhy do the four GPU pricing indices on the Bloomberg terminal show significant discrepancies?

AThe indices differ because they use different methodologies, frequencies, and data sources. Some track daily H100 rental rates, others aggregate data at the Hopper architecture level, and one uses survey-based monthly contract prices. This lack of standardization leads to inconsistent price levels and trends.

QWhat does the divergence between GPU indices indicate about the current state of the compute market?

AThe divergence indicates an inefficient and immature market. Unlike mature commodity markets where indices converge, the GPU market lacks a consensus benchmark, standardized contracts, and transparent pricing, leading to fragmented and unreliable price signals.

QHow did H100 pricing behave across different contract types according to Compute Desk data?

AOn-demand pricing was stable at around $3.00/hour until March, then spiked to $3.50. Spot pricing was lower and noisier, with a slight uptrend in March. One-year reserved pricing was flat until late March, then jumped sharply from $1.90 to $2.64, indicating a sudden repricing rather than gradual demand growth.

QWhat infrastructure gaps are exacerbating the fragmentation in the GPU compute market?

ABoth physical and financial infrastructure are underdeveloped. Physically, inconsistent network reliability, configuration, and availability hinder uniform delivery. Financially, there are no standardized contracts, transparent benchmarks, or arbitrage mechanisms to compress price differences across regions and providers.

QWhat are the core problems preventing the GPU compute market from functioning efficiently?

AKey issues include: no consensus benchmark, aggregated narratives masking structural differences, lack of transaction-level data, absence of contract standardization, unguaranteed delivery quality, illiquid contracts with no resale mechanisms, and no forward curve for hedging or financing.

İlgili Okumalar

Beyond the Stadium: The Profitable Games Surrounding the World Cup

"Beyond the Pitch: The Profit Game Around the World Cup" The FIFA World Cup transcends being a sporting spectacle, evolving into a massive global arena for speculation and profit-seeking. The 2026 tournament has amplified this dynamic, creating a multi-layered ecosystem of financial opportunism alongside the football. **Prediction markets** have surged into the mainstream. Platforms like Polymarket and Kalshi saw trading volumes for World Cup contracts soar, attracting new users with their financial trading model and high-profile, chain-based wealth stories that overshadow traditional sports betting in terms of growth and narrative. However, **traditional sportsbooks** remain the dominant force, leveraging established user habits, legal markets, and comprehensive product offerings to handle the vast majority of speculative wagers, with projections suggesting record-breaking betting volumes. Capital markets also react. **"Concept stocks"** in countries like South Korea and Japan experience volatile price swings based on team performance and anticipated fan spending on items like chicken, beer, and viewing parties, effectively becoming a stock market reflecting fan sentiment. The **ticket resale market** has become a sophisticated arena for arbitrage. Prices fluctuate wildly based on team draws and star power, with sellers sometimes listing tickets they don't yet own in a practice akin to short-selling, while FIFA's own "Right to Buy" tokens add another layer of speculative trading. **Collectibles and merchandise** offer another avenue. Panini sticker albums, with their inherent scarcity and nostalgic value, can become high-value collectibles. Limited-edition or locally themed jerseys command significant premiums on secondary markets, and even counterfeit vendors profit from fans' desire for affordable match-day identity. The **cryptocurrency** space has seen a frenzy of speculative, unauthorized World Cup-themed meme coins on chains like Solana. These tokens, often exploiting team names and player imagery, experience extreme pump-and-dump cycles, creating stories of massive gains for a few early entrants and steep losses for many others. Finally, an entire industry thrives on **providing information and tools** to other speculators. Developers create platforms like SeatSidekick to track ticket inventory and prices, while paid Telegram groups and subscriptions sell betting tips and predictions, monetizing the widespread desire for an informational edge. In essence, the World Cup has become a compressed, global laboratory for speculation. While the games determine champions on the field, a parallel, complex network of financial transactions—spanning prediction contracts, bets, stocks, tickets, collectibles, crypto, and information services—settles its own scores in the global market.

marsbit21 dk önce

Beyond the Stadium: The Profitable Games Surrounding the World Cup

marsbit21 dk önce

How Does Codex Use a Computer? Three Entry Points and Permission Boundaries

This article explains the three primary methods for Codex to interact with a computer, each with distinct use cases, permission boundaries, and trust levels. **1. Computer Use:** This offers the broadest access, allowing Codex to visually control and interact with the graphical user interface of authorized macOS/Windows apps, system settings, and even iOS simulators. It's ideal for tasks lacking APIs or structured tools, such as operating legacy software or multi-app workflows. However, it's the slowest method and has the widest permission scope, requiring careful supervision for sensitive actions. **2. Chrome Extension:** This grants Codex access to the user's logged-in Chrome browser state, including cookies, profiles, and open tabs. It's best for tasks requiring user identity across websites like Gmail, LinkedIn, Salesforce, or internal dashboards. Its key advantage is multi-tab control for complex workflows. While more powerful for browser-based tasks than Computer Use, it carries higher sensitivity as actions are performed under the user's identity. **3. In-App Browser:** This is a browser isolated within the Codex thread, separate from the user's personal browsing data. It excels in web development and debugging scenarios—previewing local servers, testing responsive layouts, or annotating designs directly on the page. Its isolation is a strength for development but a limitation for tasks requiring login sessions. The core principle is to choose the narrowest, safest, and most structured interface for the task. Use plugins or MCPs first, resort to visual control (Computer Use) only for GUI-dependent tasks, employ the Chrome extension for identity-reliant browser work, and prefer the In-App Browser for isolated development. **Appshots** are clarified as a fourth, complementary tool for *inputting* context—capturing a screenshot of a window to point Codex to something—rather than a method for Codex to *act*. Together, this layered approach highlights a key to AI agent productization: not granting unlimited permissions, but constraining them within clear boundaries for specific tasks while preserving user oversight.

marsbit1 saat önce

How Does Codex Use a Computer? Three Entry Points and Permission Boundaries

marsbit1 saat önce

The "Iron Rule" of Chip Equipment Is Being Broken

For years, the semiconductor equipment industry followed an unwritten "iron rule": suppliers offered steep discounts for new tool introductions (Design-in) and faced consistent price pressure during repeat orders, especially during market downturns. This long-standing buyer's market dynamic is now being upended. Recently, SK Hynix's primary equipment suppliers have reportedly requested a 3-4% price *increase*, a nearly unprecedented move. This shift is driven by a severe supply-demand imbalance fueled by the AI compute boom. Securing equipment has become an urgent arms race as chipmakers' expansion speed dictates their ability to fulfill massive AI chip orders. Key areas feeling the strain include: **TCB (Thermal Compression Bonding) Equipment:** Demand is exploding, driven by the simultaneous needs of HBM4 memory stacking, AI chip Chip-on-Substrate (C2S), and logic Chiplet Chip-on-Wafer (C2W) packaging. Players like Hanmi Semiconductor, Hanwha Semitech, and ASMPT are receiving major orders. While hybrid bonding is seen as the future, TCB remains the pragmatic choice for HBM4 mass production, with its lifecycle extended by relaxed specifications and ongoing technological upgrades. **Test Equipment Bottlenecks:** Ironically, AI-driven shortages are now crippling test equipment manufacturing. Critical components like FPGAs, Driver ICs, and CPUs face severe shortages and extended lead times (up to 52 weeks for FPGAs), as AI data center and server vendors prioritize supply. This creates a paradoxical cycle: AI chip shortages drive fab expansion, which requires more test equipment, whose production is delayed because its key parts are diverted to make AI chips. The industry is entering a broad, AI-powered upcycle. SEMI forecasts global semiconductor equipment sales to hit a record $156 billion by 2027, fueled by investment in advanced logic/foundry, HBM-driven DRAM, and advanced packaging (like CoWoS). Major players like TSMC, SK Hynix, and Micron are aggressively ramping capital expenditure. In conclusion, leading equipment vendors are no longer just selling tools; they are selling the critical capability to deliver AI-era capacity. Pricing power is shifting decisively to those with indispensable technology in key process nodes like advanced logic, HBM, and advanced packaging, rewriting the industry's traditional power structure.

marsbit2 saat önce

The "Iron Rule" of Chip Equipment Is Being Broken

marsbit2 saat önce

İşlemler

Spot
Futures
活动图片