Gold Plunges 26%, No Queues for Gold Bars, Yet Central Banks Quietly Return to Buying

marsbit2026-08-13 tarihinde yayınlandı2026-08-13 tarihinde güncellendi

Özet

Gold Surges After 26% Drop as Central Banks Stealthily Return to Buying Following a significant 26% correction from its February 2026 peak of $5,300, gold has recently staged a sharp breakout. This rally is attributed to a key shift: major central banks, having paused purchases in Q1, have quietly resumed buying, providing fundamental support. The market backdrop is favorable. Retail speculative frenzy, evident in early-year queues at gold shops, has dissipated as attention turned to equities like semiconductor stocks. This has left sentiment cool and positioning light. Technically, the breakout is robust, with gold reclaiming its crucial 50-day and 200-day moving averages and breaking a clear downtrend line. The weekly RSI also exited near-oversold territory, a historically reliable bullish signal. Key macro drivers reinforcing the long-term bullish case include global de-dollarization trends post-Russia sanctions and concerns over U.S. debt sustainability. While a short-term pullback is possible (noted by a Bollinger Band sell signal), the article views the current setup as an asymmetric opportunity. The suggested strategy is to accumulate on dips toward the $4,341-$4,191 support zone, with a failure level below $4,170.

Author: 0xKyle

Compiled by: Deep Tide TechFlow

Deep Tide Introduction: After months of correction, gold has suddenly broken out, driven by central banks returning as buyers and speculative sentiment being cleared out. This article outlines asymmetric opportunities from both a macro-logic and technical perspective, offering valuable reference for investors focused on safe-haven assets and macro trading.

Note: This article was published to my subscribers on August 9th. Price information and other details may be outdated. Thanks to Cptlightyear and Riff for bringing it to attention—they're awesome. Also, thanks to basedpotato for the charts and some of the viewpoints below.

I spent the weekend doing some due diligence on the gold thesis. Gold bottomed out months ago and then broke out upwards. This article is simply a collection of what I've discovered about gold.

Qualitative Arguments
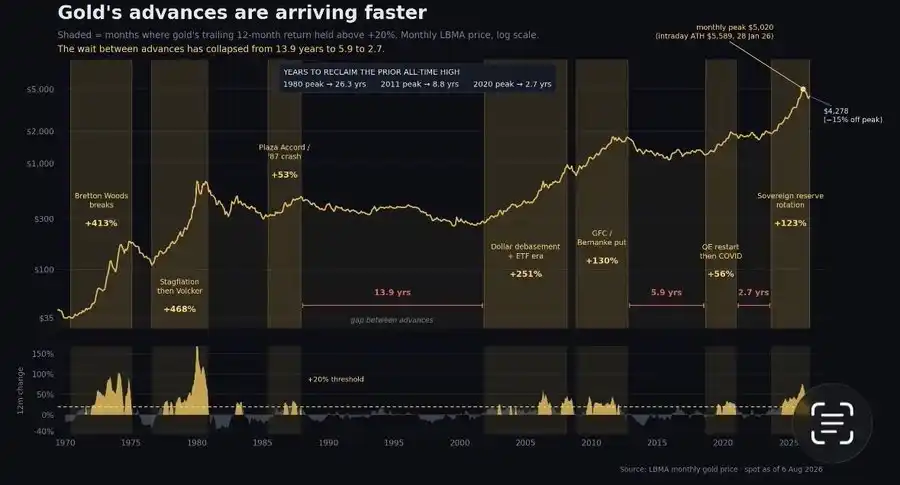
Cycles are increasingly compressed: 2000-2011: 10 years; 2011-2020: 9 years; 2020-2022: 2 years.

The initial bullish logic has only strengthened over time—after the West froze Russian reserves, countries had to diversify away from developed-market fixed-income securities (especially China). Combined with the US debt issue, no one wants to be a buyer for the country with the world's largest debt—everyone is looking for alternatives. This is a very long-term, broad macro bullish logic.

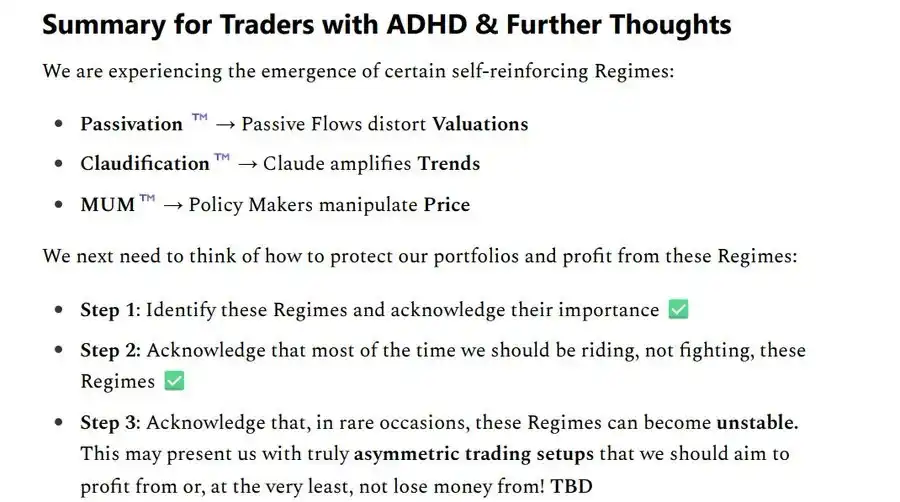
Add in the Trump corruption era—the Fed is slowly being eroded. Volatility is currently suppressed—Shrub's article aptly notes: Passive money flows plus Claude "Hey, what should I invest in?" plus policymakers manipulating prices (Bessent suppressing paper oil prices) -> Gold is the long-term safe haven.
But why now? Gold peaked in February 2026 at $5300; it has since corrected by 26%, with traders looking for a bottom. Reasons for the correction are varied, but Chinese liquidity, the Iran war, and central banks halting purchases seemed to be the main culprits.

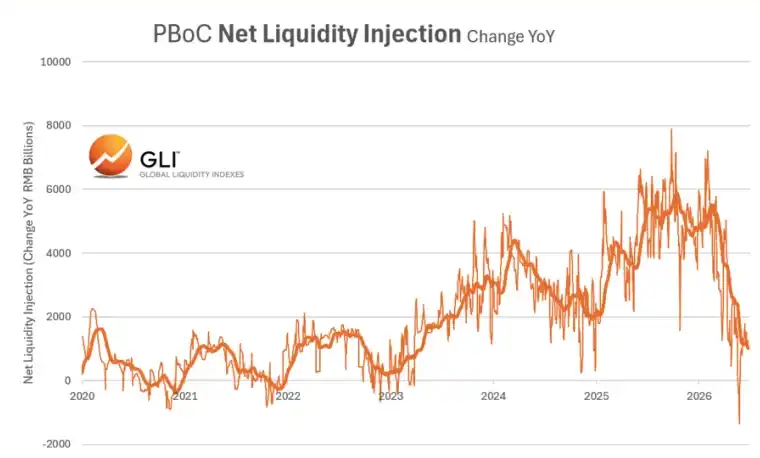
The chart below shows the year-over-year change in the Chinese central bank's net liquidity injections into the Chinese money market, measured daily and smoothed with a 50-day moving average. The key feature is a clear spike on March 2nd. Since then, liquidity acceleration stopped and then contracted.
Daily reverse repos have picked up recently, but it's not clear yet. What is clear is that central banks have started buying again after a Q1 quiet period! (This drop coincided exactly with that.)
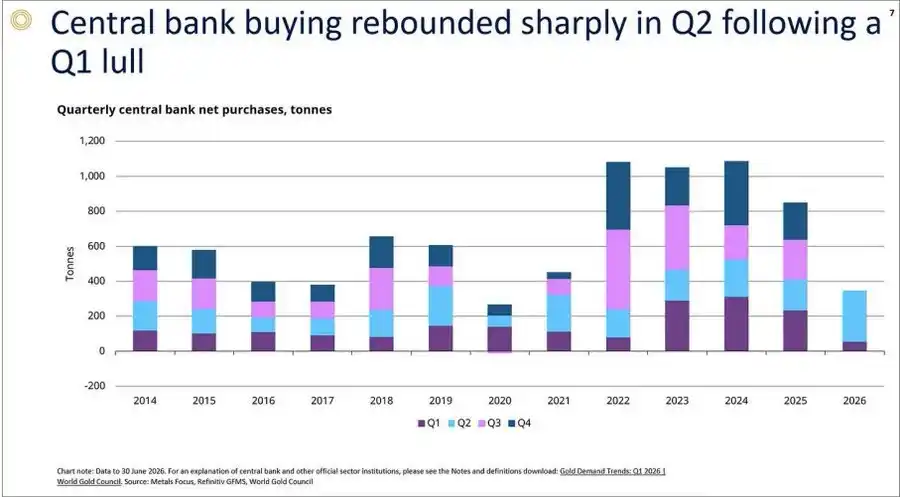
Beyond that, these countries (especially China, the big buyer) don't want speculative frenzy in the market. They want to accumulate as much as possible, at as low a price as possible. If the bull-market mania gets out of control, they step back—so that's what they did when sentiment turned extremely bullish. But over the past few months, that speculative sentiment has been crushed—which aligns with RSI readings (detailed in the technical section below).

Now, these guys are under-positioned. Everyone and their mom is buying semiconductor stocks. Remember all those photos in January of people queuing outside gold shops? As Citrini says—"When people worry about the future, they buy gold. When they worry about the present, they sell gold." People sold gold because of the war—they were worried about the present. Now, I don't know if people are worried about the future, but they certainly aren't worried about the present! The queues outside gold shops in my country are gone.

Now, gold sentiment has cooled. Today, few people care—again, everyone is buying semiconductor stocks and momentum plays. I think this is a great mix—asymmetry, timing, plus people aren't positioned yet. This is the kind of fat trade I love. Today, few people care.

On the macro front—theoretically, higher real rates and a stronger dollar should make gold fall. I'm no macro expert, but the logic is: higher real rates → gold pays no interest → investors prefer bonds; simultaneously, a stronger dollar → gold becomes more expensive for buyers in other currencies.

Despite this, gold hasn't broken below $4000. I've traded gold myself, going long multiple times—all unsuccessful. It did churn around in the $4000 price range—initially bearish. But over time, that price range became support—clearly, this was accumulation.

Seasonally: Early August is when the summer doldrums end and seasonal strength returns—hence the current breakout.

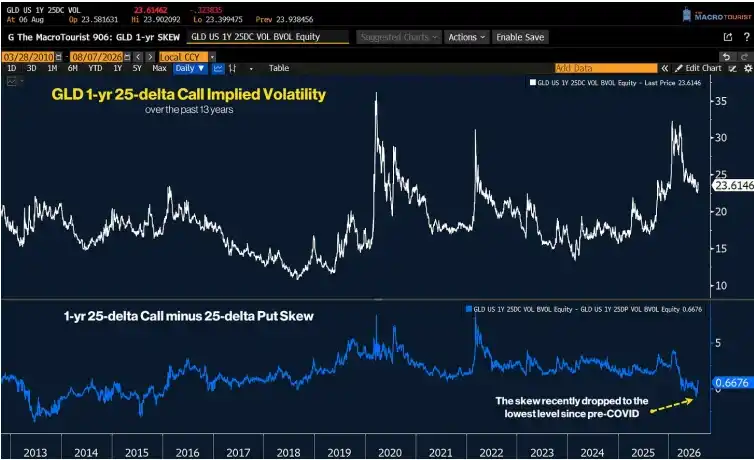
Finally, thanks to Macro Tourist: Gold's 1-year 25-delta call option skew is at its lowest level since pre-pandemic—no one is paying for right-tail risk.
Technical Arguments

Gold has triggered numerous technical signals:

In the bull market of the past few years, the 50-day moving average has been a key level that gold often stayed above. It would always test that level and then resume the uptrend.

January 26th—sharp pullback from $5500 to $4400; gold bounced off the 50-day MA. Bull market resumed. Iran war began—closed below the 50-day MA. It remained below since, with the 50-day MA acting as resistance.

Now, the price has reclaimed that line (blue line).
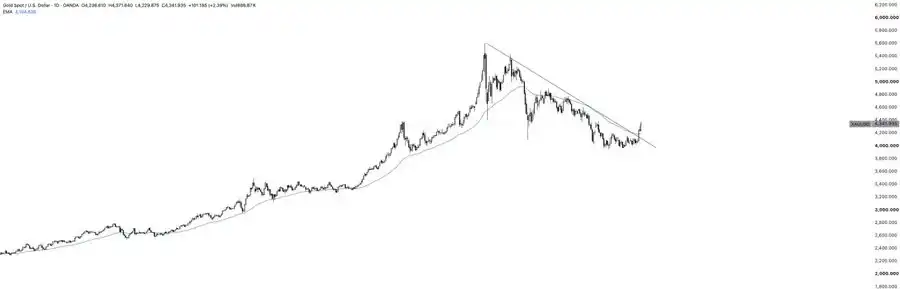
Furthermore, a simple downtrend line (black line in the chart) has been broken.
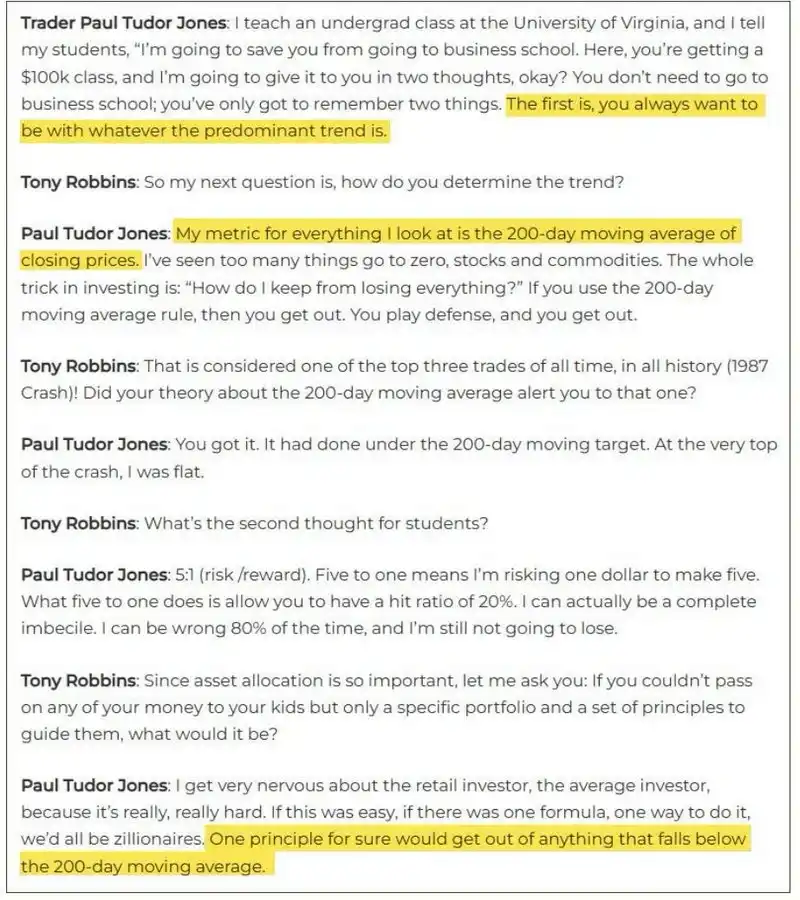
You might think technical analysis is male astrology. But PTJ said: "One sure rule is to get out of anything that breaks below the 200-day moving average." Guess what gold just did?
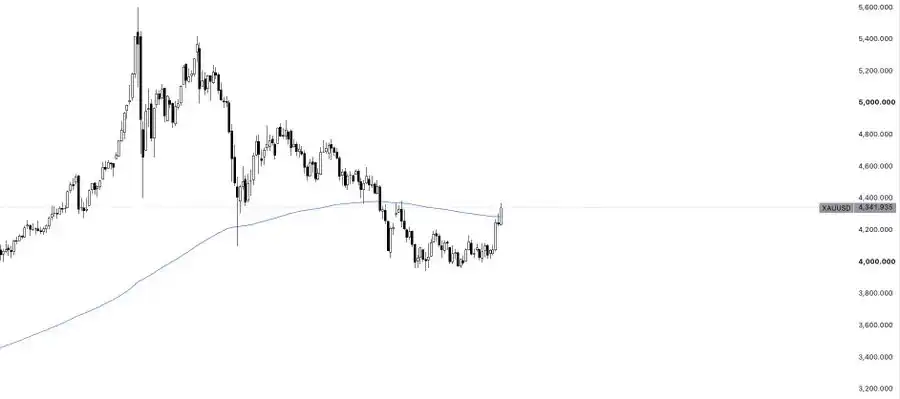
That's right, it has reclaimed the 200-day EMA. One last point is the RSI. I find RSI on higher timeframes like weekly, monthly, etc., to be strong signals. Gold's weekly RSI was near oversold for several weeks. Every time it touched that zone, it seemed to kick off a new uptrend.

Now, the price has rallied. The structure is very clean. It has broken through pretty much all the EMAs. Short-term EMAs are also crossing, which is a bullish indicator. EMA 10 crossing above EMA 21.
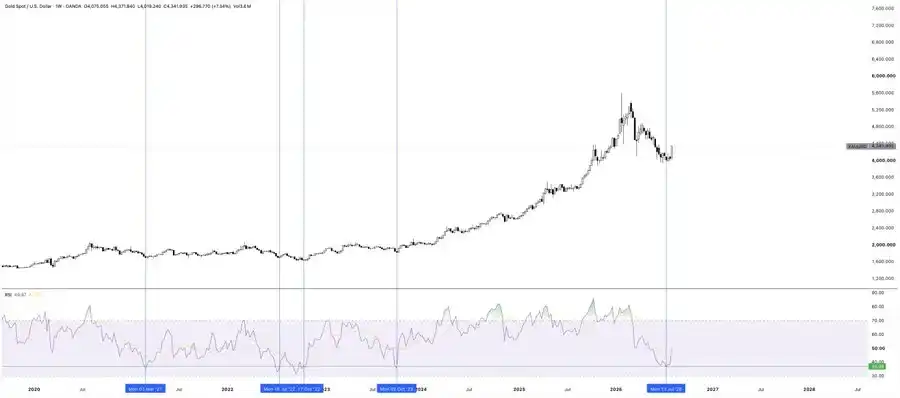
A note of caution. Gold triggered a sell signal on my (20/3) Bollinger Bands (20-day EMA, 3 standard deviations). This signal is almost always a sell. So, I expect a short-term pullback. I will aggressively build a position on that pullback. As I've said, gold can be traded with size because intraday volatility isn't huge (not like stocks moving 10% in a day).
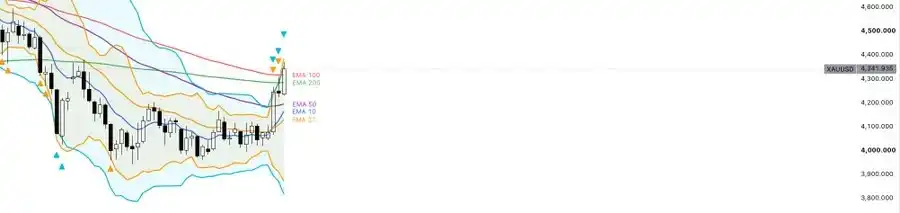
The range between $4341 and $4191 (daily EMA 50) could be a good area to set limit buy orders.

The invalidation level for the whole trade is around $4170. A close below that would essentially be the top of the range. A close below means it's back to range-bound.


İlgili Sorular

QWhat are the main qualitative arguments presented in the article for a bullish outlook on gold?

AThe article presents several qualitative arguments: 1) Central banks, particularly China's, have returned to buying gold after a quiet period in Q1, providing sustained demand. 2) A long-term macro logic where nations are diversifying away from Western debt securities (especially U.S. debt) post-Russia sanctions. 3) The speculative frenzy from retail investors has dissipated (e.g., no more lines at gold shops), clearing out 'weak hands'. 4) Seasonal patterns suggest strength beginning in August. 5) Market sentiment is indifferent, with attention focused on assets like semiconductor stocks, creating an asymmetric opportunity.

QWhat technical indicators does the article cite to support the view that gold has bottomed and is breaking out?

AThe article cites multiple technical indicators: 1) The price has reclaimed the 50-day and 200-day Exponential Moving Averages (EMAs), turning them from resistance back to support. 2) A simple downtrend line has been broken. 3) The 10-day EMA has crossed above the 21-day EMA, a bullish signal. 4) Weekly RSI had approached oversold levels and has now rebounded, a pattern that previously preceded new uptrends. 5) However, a short-term Bollinger Band (20/3) sell signal suggests a potential pullback for a better entry point.

QAccording to the article, why did gold experience a 26% correction from its peak in February 2026?

AThe article attributes the 26% correction from the February 2026 peak of $5300 to several factors: 1) A contraction in Chinese liquidity starting from a peak on March 2nd. 2) The Iran war, which caused investors to sell gold due to immediate concerns ('fear of the present'). 3) Central banks, major buyers, paused their purchases during Q1, coinciding with the price decline. The article suggests these buyers step back when speculative sentiment becomes too hot to accumulate at lower prices.

QWhat is the suggested trade setup and risk management level for buying gold based on the technical analysis?

AThe suggested trade setup is to build a large position on a pullback. The ideal buy zone is identified between $4341 and $4191, which aligns with the 50-day EMA. The key risk management level, or trade invalidation point, is set at $4170. A daily close below this level would indicate a failure of the breakout and a return to range-bound trading, suggesting one should exit the long position.

QHow does the article contrast the current market sentiment towards gold with the sentiment earlier in the year (e.g., January)?

AThe article contrasts the sentiment sharply. In January, there was public speculative frenzy with photos of people lining up at gold shops, indicating widespread 'fear of the future' and bullish excitement. Currently, that sentiment has completely reversed. The lines are gone, and few people care about gold as attention has shifted to assets like semiconductor and momentum stocks. This shift from extreme concern to indifference, while underlying fundamentals like central bank buying improve, is presented as a key component of the asymmetric opportunity.

İlgili Okumalar

Stripe’s 16-Year Chronicle: From 7 Lines of Code to a $100 Billion Valuation

Stripe's 16-year journey began with a simple promise: "7 lines of code to accept payments." Founded by Patrick and John Collison, the company started by hiding the complexity of bank integrations and merchant accounts behind a clean API, initially targeting developers at startups. This early focus on user experience and technical simplicity fueled rapid adoption. A key early milestone was establishing vital bank partnerships, a challenge overcome by hiring Billy Alvarado, who brought crucial institutional relationship skills. From this foundation, Stripe systematically expanded its product boundaries. It launched Connect for platform payments, Atlas for company formation, Radar for fraud prevention, and Billing for subscriptions. This transformed Stripe from a payment processor into a broader financial infrastructure suite for internet businesses. The COVID-19 pandemic accelerated growth but also led to over-hiring. A 14% layoff in 2022 marked a period of organizational correction. Subsequently, Stripe shifted its growth strategy towards strategic acquisitions to enter new domains quickly. It acquired Bridge (stablecoin infrastructure), Privy (wallet infrastructure), Metronome (usage-based billing), and agreed to buy OpenRouter (AI model routing). These moves signal Stripe's ambition to build a "programmable money system" for the emerging AI and agent-based economy, managing not just currency flows but also the measurement and pricing of computational resources like AI tokens. Internally, Stripe leverages AI agents (like "Minions") to boost engineering productivity. Despite scaling to nearly 8,000 employees and processing $1.9 trillion in payment volume annually, the company remains private. A recent employee tender offer valued it at $159 billion. The core question for Stripe's future is whether it can successfully integrate its expanding product matrix—spanning payments, crypto, and AI infrastructure—into a cohesive platform, positioning itself as the foundational economic layer for autonomous software agents.

marsbit26 dk önce

Stripe’s 16-Year Chronicle: From 7 Lines of Code to a $100 Billion Valuation

marsbit26 dk önce

Treasury Secretary's Move to Suppress Treasury Yields Ignites 'Currency Debasement Trade'! Gold Hits Three-Month High, Bitcoin Surges Over 25% in a Single Week

US Treasury Secretary Besant's efforts to lower long-term Treasury yields by announcing expanded buybacks had only a brief market impact. However, this move fueled a "currency devaluation trade," weakening the US dollar while boosting both gold (to a three-month high) and Bitcoin (up over 25% for the week). Analysts attribute this reaction to deepening market concerns over the massive US fiscal deficit and structural pressures keeping long-term rates elevated, including fierce competition for capital from global government borrowing and massive AI sector financing. Despite the Treasury's actions, fundamental forces like growth, inflation, and capital demand are seen as limiting its ability to sustainably suppress yields. Bitcoin's strong positive correlation with gold has reinforced its narrative as a hedge against devaluation. While equity markets have shown resilience, some strategists warn that Treasury yields nearing 5% increase pressure on the dollar and high-leverage assets. Figures like Ray Dalio have advised reducing bond exposure in favor of gold and some Bitcoin, citing US debt risks. Market opinions are divided on the sustainability of the devaluation trade, with some noting the lack of a near-term catalyst for its next leg higher. The underlying tension between the Treasury's desire for lower borrowing costs and the Federal Reserve's focus on inflation and reducing market intervention remains a key theme. Upcoming events like Nvidia's earnings and the Jackson Hole symposium will test whether AI profits can continue supporting stocks and if the Fed aligns more with Washington's preference for easier financial conditions.

华尔街日报2 saat önce

Treasury Secretary's Move to Suppress Treasury Yields Ignites 'Currency Debasement Trade'! Gold Hits Three-Month High, Bitcoin Surges Over 25% in a Single Week

华尔街日报2 saat önce

Alexander Shokhin: Business Needs an Interest Rate Below 10% and the Dollar at 90-95 Rubles

Alexander Shokhin, head of the Russian Union of Industrialists and Entrepreneurs (RSPP), has advocated for potentially using "non-market" tools to keep the ruble within a target exchange rate corridor. This, he argues on August 21, would help avoid excessive volatility, though he called the topic a separate discussion. Shokhin had previously raised the idea of a currency corridor in late May, noting the ruble's current exchange rate is not fully market-driven due to a limited currency segment and reduced foreign currency demand. He stated that many business community colleagues propose fixing a corridor, even through non-market methods, to ensure predictability. The business community's key targets, as outlined by Shokhin in late December 2025, are a Central Bank key rate of 12%, inflation of 4–5%, and a US dollar exchange rate of 90–95 rubles by the end of 2026. A turning point for investment, he said, would be lowering the rate to 12% with 6% inflation, though truly comfortable business conditions would require a rate below 10%. He stressed the critical importance of currency predictability for corporate investment decisions. From a data analysis perspective, the idea of a ruble corridor is not new. A similar mechanism was used in Russia from 1995 to 1998, where the central bank held the dollar within fixed boundaries through regular interventions. This regime lasted three years before ending abruptly during the 1998 default, illustrating the fragility of rigid targets under external shocks. The macro-economic link is clear: stricter corridors require more reserves to defend against currency pressure. The key unresolved technical aspect is the specific sources and volume of such interventions given the current market's limited liquidity. Whether this discussion remains theoretical or leads to concrete corridor parameters will be seen in the coming months.

cryptonews.ru4 saat önce

Alexander Shokhin: Business Needs an Interest Rate Below 10% and the Dollar at 90-95 Rubles

cryptonews.ru4 saat önce

İşlemler

Spot
活动图片