Gold beats Bitcoin in the ‘safe-asset’ debate once again: ‘Get out while you still can!’

ambcrypto2026-03-30 tarihinde yayınlandı2026-03-30 tarihinde güncellendi

Özet

The ongoing debate between Gold and Bitcoin as safe-haven assets continues, with recent developments favoring gold. While Bitcoin initially outperformed gold during U.S.-Iran geopolitical tensions in early March 2026—even nearing $74,000—it has since lost momentum, struggling to maintain levels above $67,000. The XAU/BTC chart shows green candles on the 4-hour timeframe, indicating gold's current outperformance, though the bounce remains minimal and lacks clear trend reversal signals, with RSI in overbought territory. The correlation between Bitcoin and Gold stands at -0.47, reflecting opposing price movements. On-chain analysis reinforces Bitcoin's perception as a riskier asset compared to gold, a view echoed by critic Peter Schiff. Market cap rankings further highlight gold’s dominance, placing first while Bitcoin ranks 12th. At press time, Bitcoin traded around $67,258 and gold at $4,536. Despite Bitcoin briefly acting as a safe haven during gold’s worst five-day drop since 1983, the market remains divided heading into Q2 2026. The key takeaway is that both assets exhibit strength under different conditions, with no consensus yet on the true safe-haven asset.

The good old debate between Gold [XAU] and Bitcoin [BTC] never seems to conclude. Earlier in March, after the U.S.-Iran escalations, Bitcoin started outperforming gold. It even climbed back to around $74,000, acting as a hedge during geopolitical tensions.

But as we move towards the end of the month and the end of the first quarter of 2026, Bitcoin is losing its charm.

Gold vs. Bitcoin: An analysis

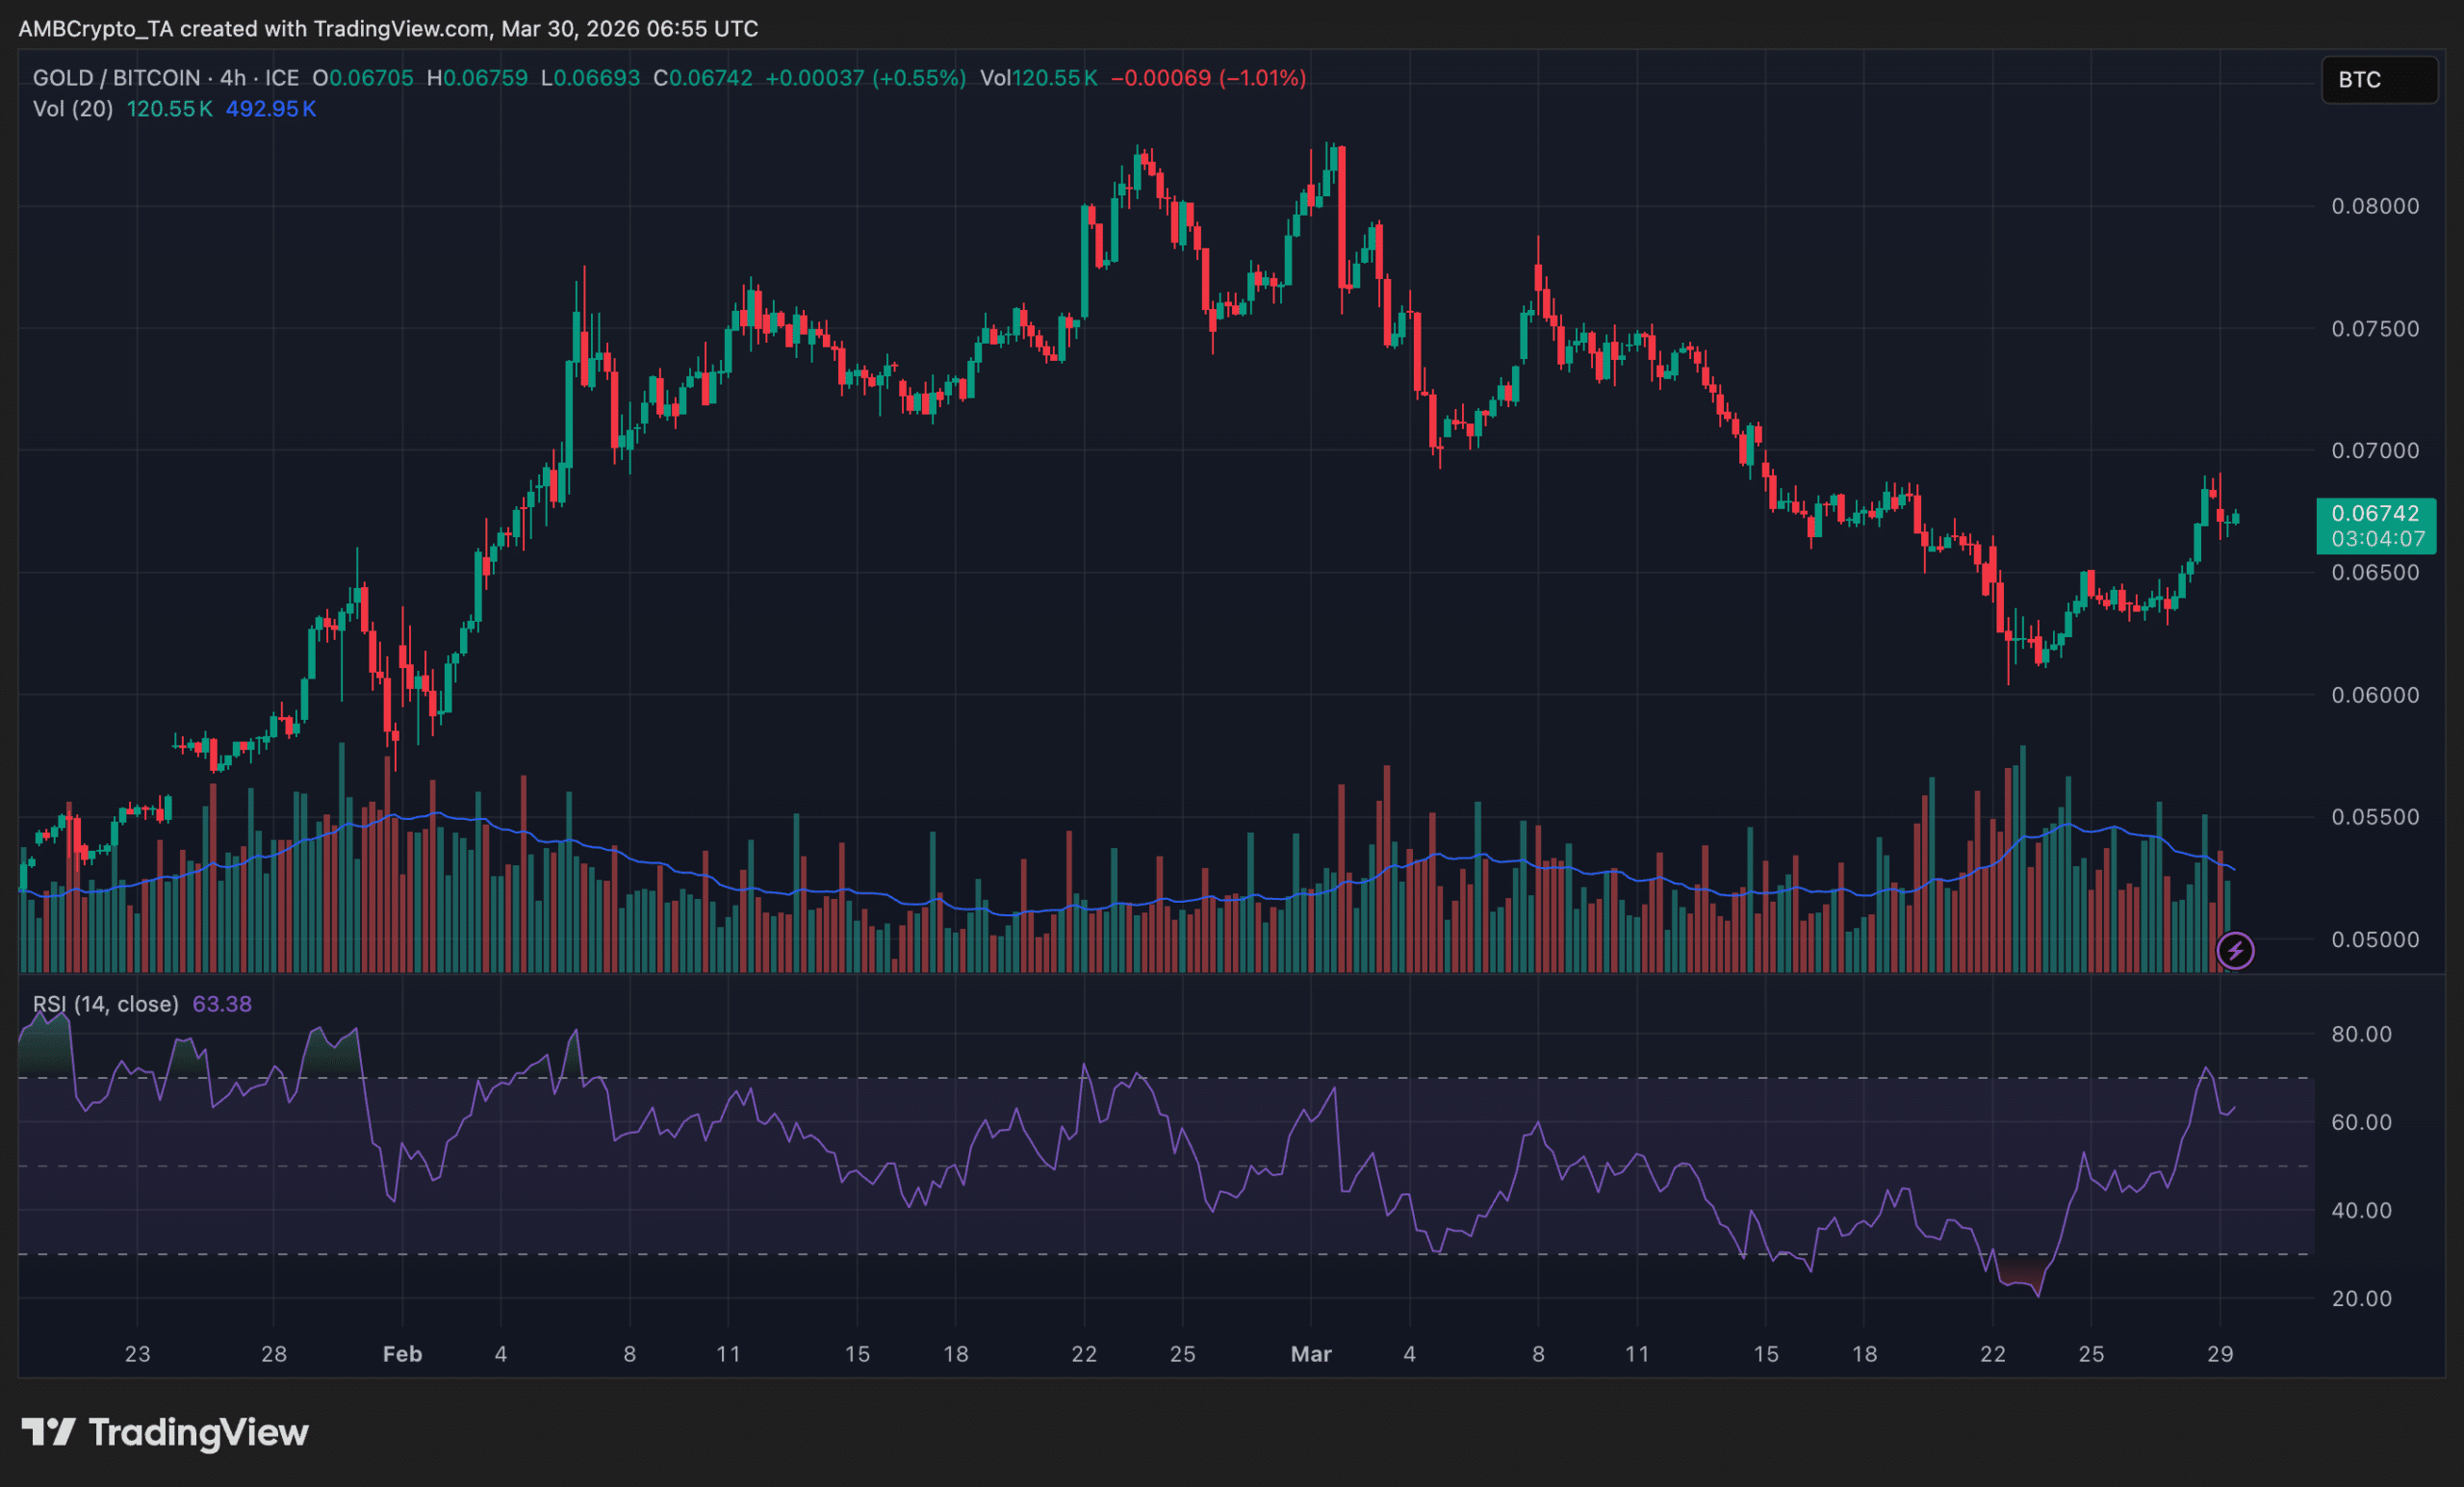
At the time of reporting, the XAU/BTC chart was showing green candles on the 4-hour time frame, indicating that gold was performing better than Bitcoin again. At the same time, Bitcoin was struggling to stay above the important $67,000 level.
Source: TradingView

Looking back, one can see that earlier this month, the chart dropped sharply. That meant Bitcoin was doing much better than Gold. Thereafter, both assets moved sideways for a while, showing a balance between them, but now things have shifted.

However, it’s also important to note that this bounce is currently minimal and does not hint at a real trend change. That said, the RSI was also around 72, in the overbought zone, which further confirmed the sentiment.

Bitcoin-Gold correlation hits rock bottom

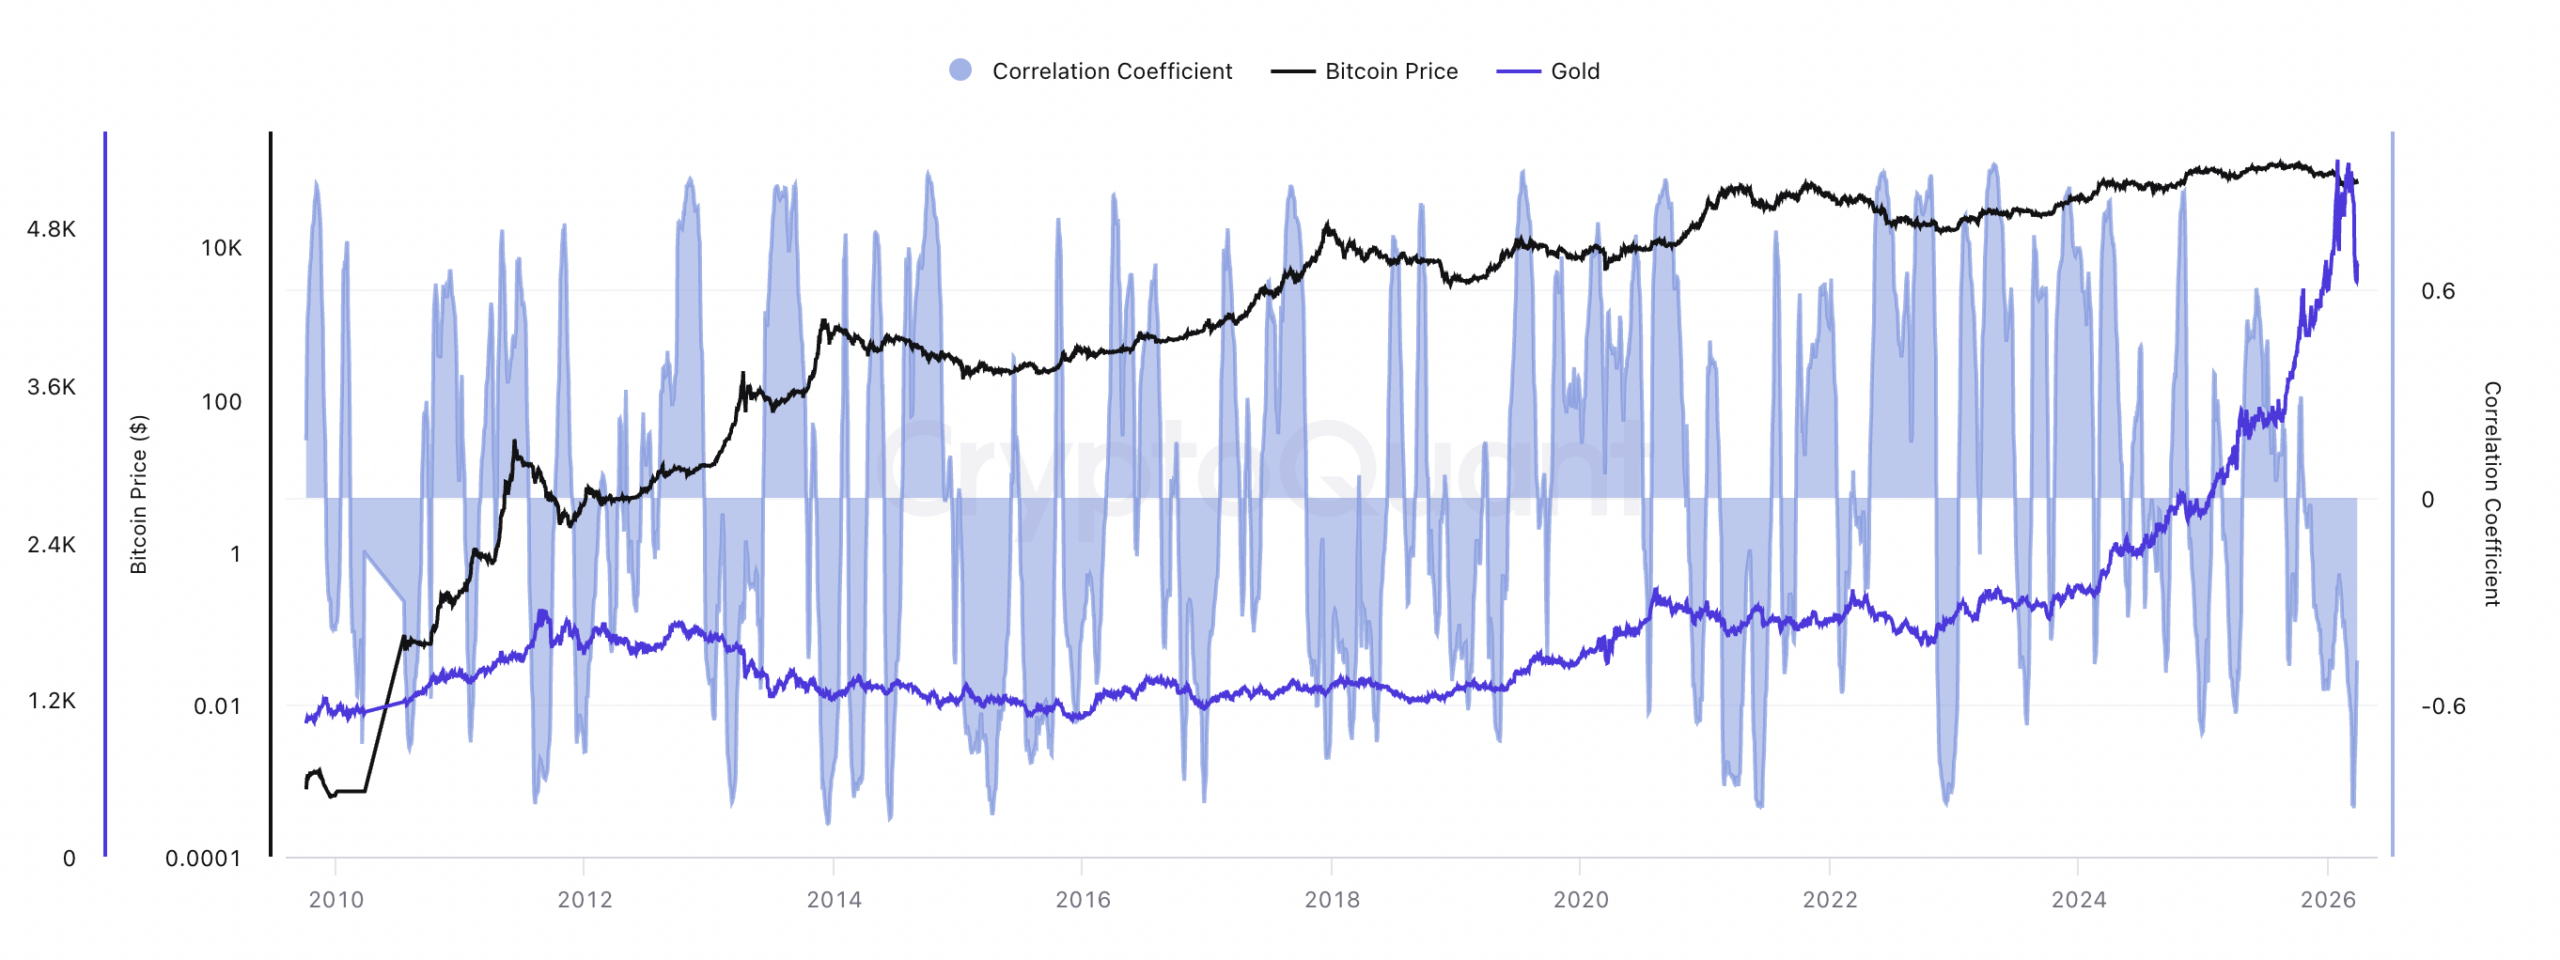
At press time, Bitcoin and Gold’s price correlation stood at -0.47, meaning that both assets were moving in opposite directions.
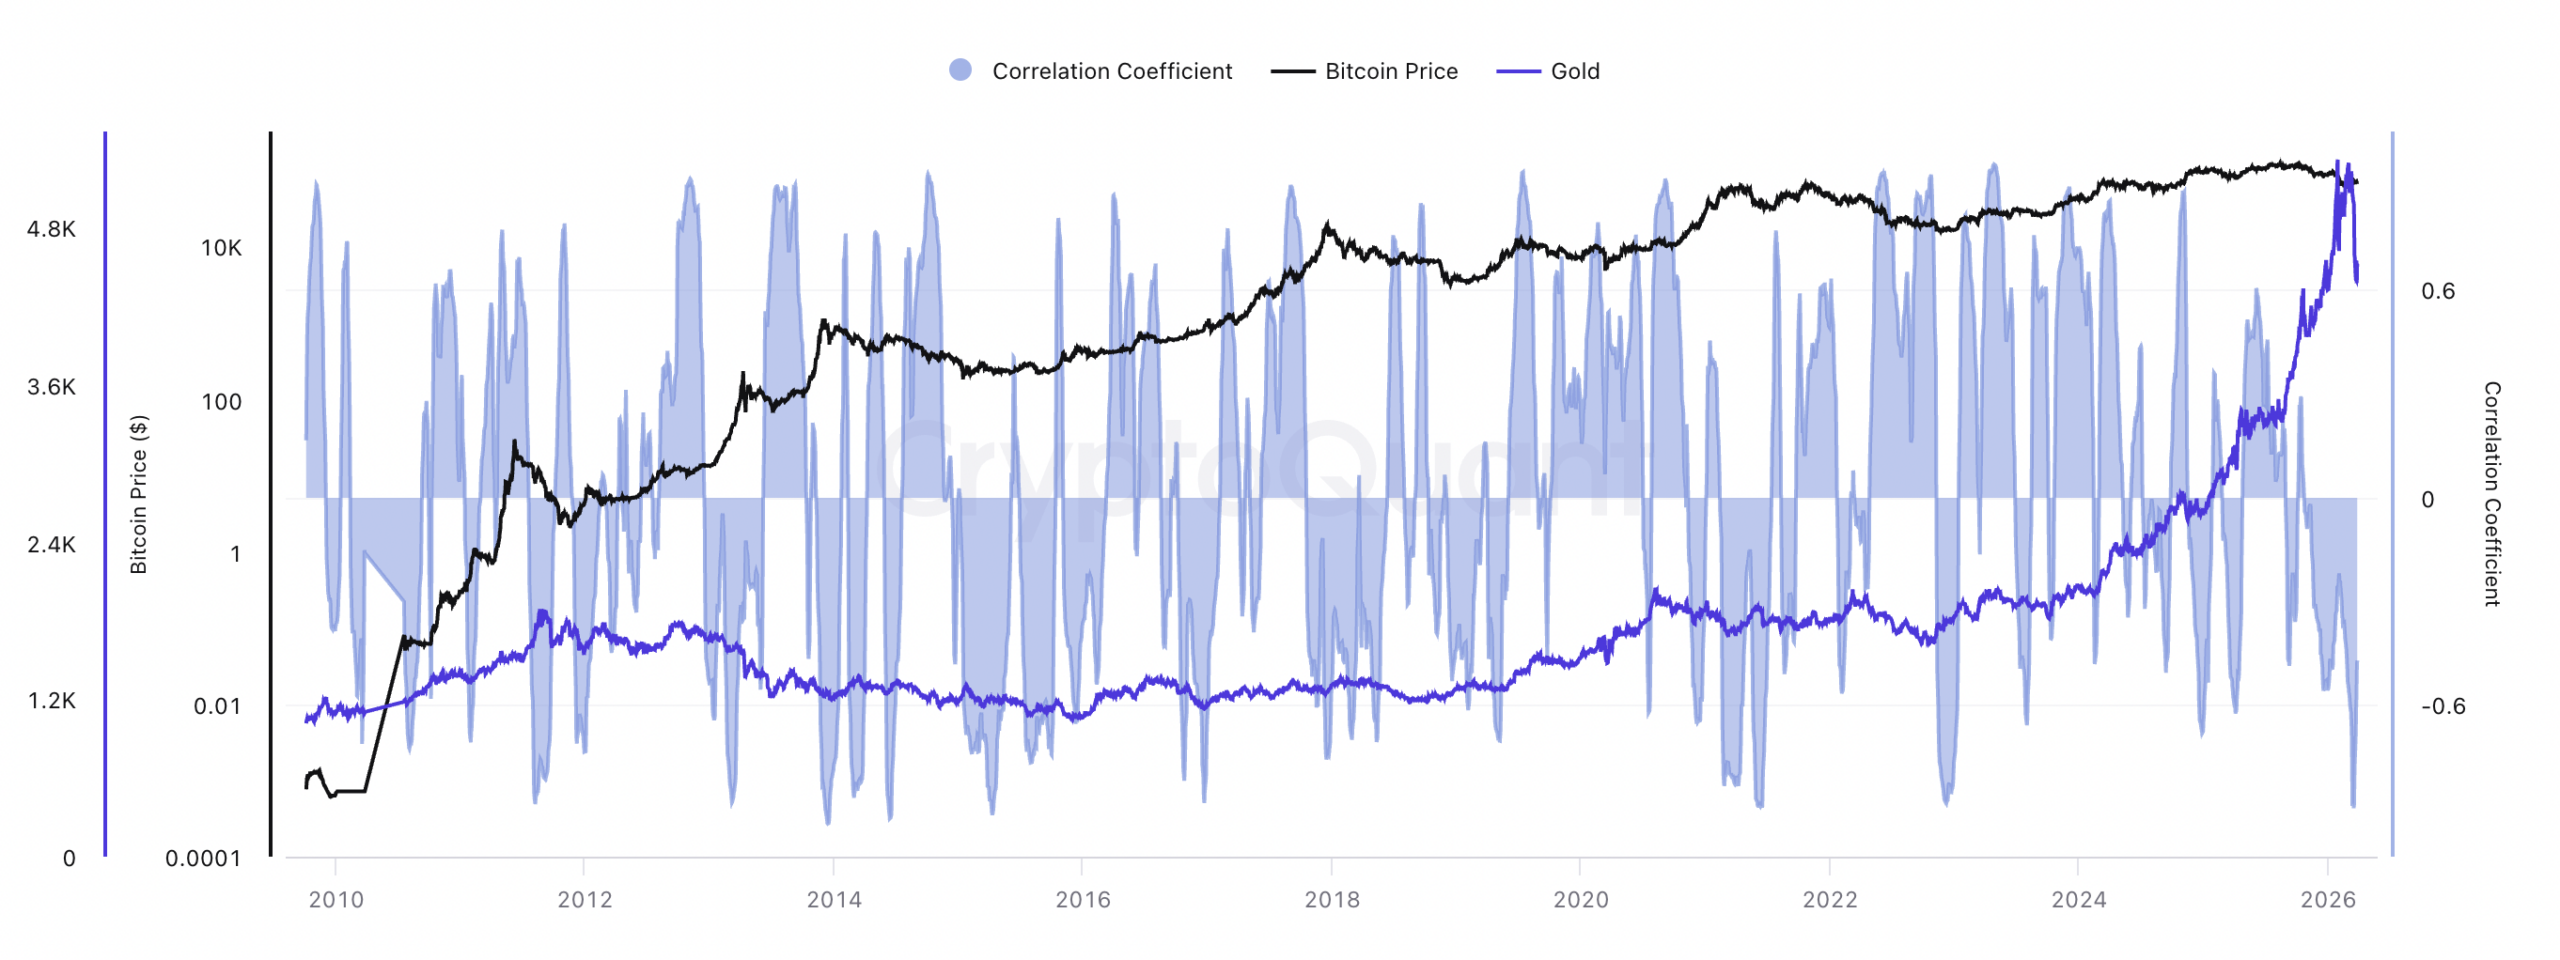
Source: CryptoQuant

So, according to on-chain analysis, Bitcoin is still being considered a risky asset in comparison to gold.

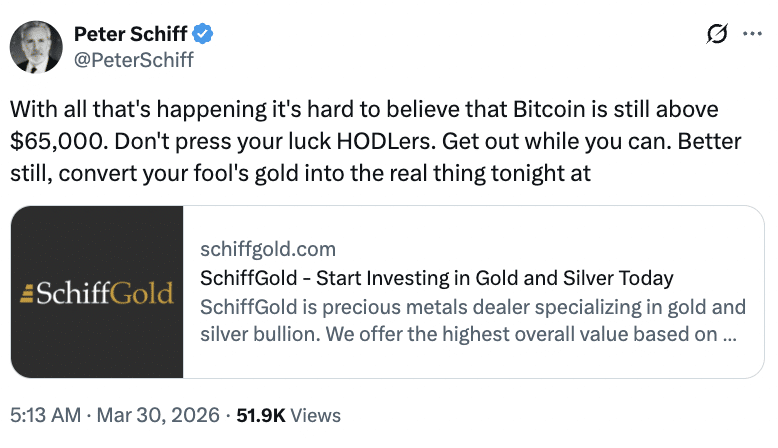
Bitcoin’s all-time critic, Peter Schiff, echoed this sentiment, noting,
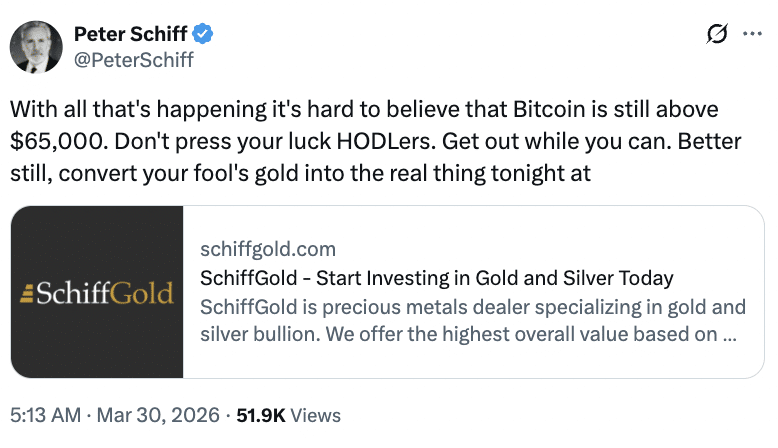
Source: Peter Schiff/X

Schiff’s narrative was further supported by the asset market cap chart, which showed that Bitcoin was ranking 12th, whereas gold was at the top.
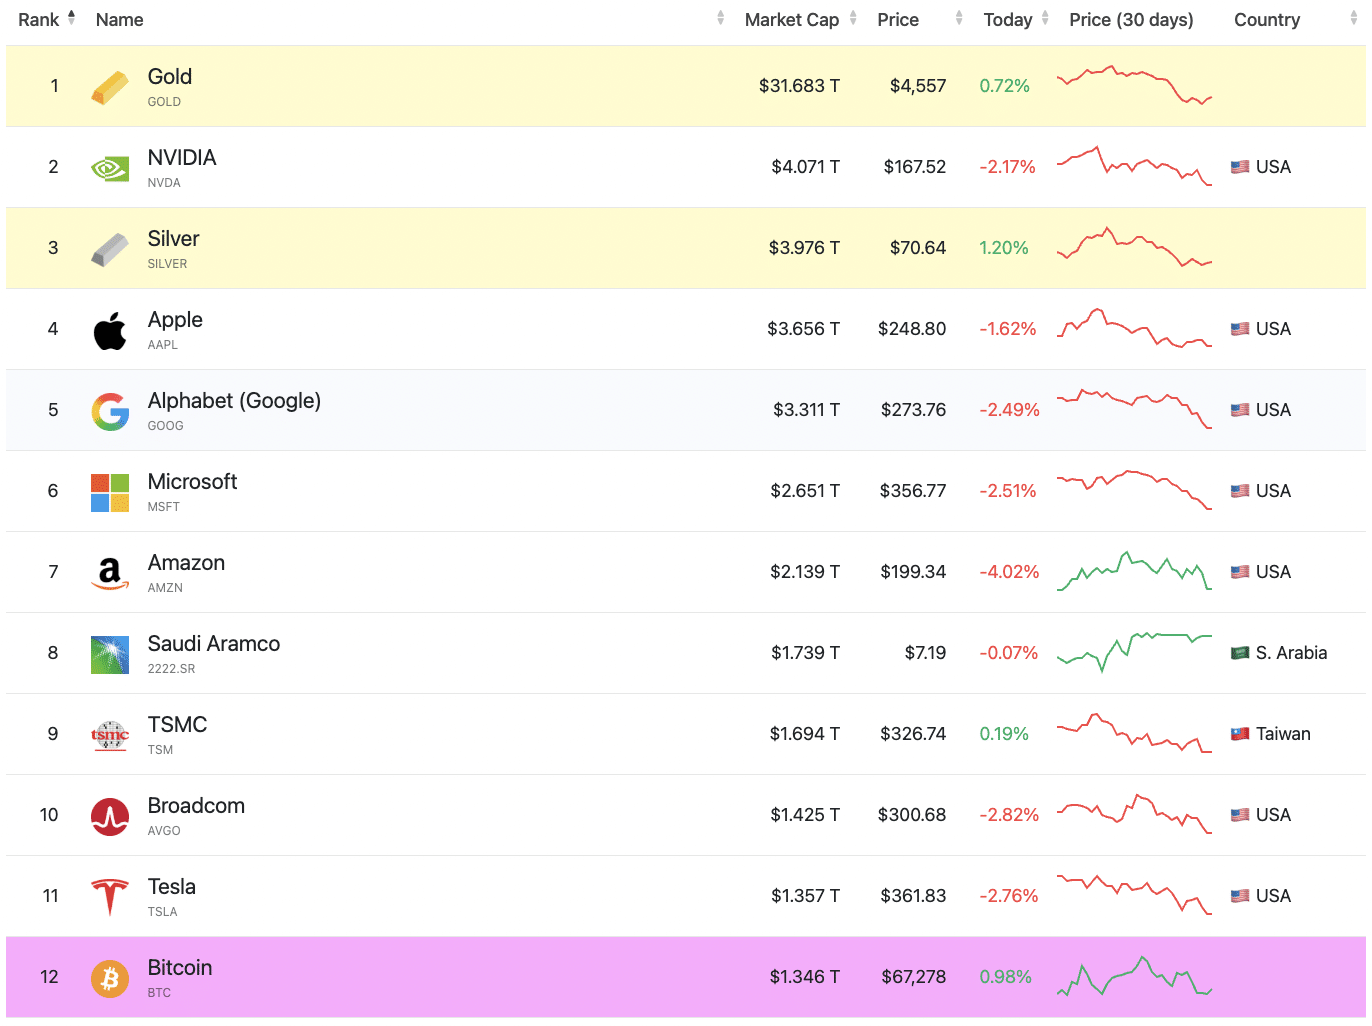
Source: CompaniesMarketCap

This comes as Bitcoin was trading around $67,258, and gold was priced at $4,536 at press time.

However, when you zoom out and look at the full month, Bitcoin was acting as a ‘safe haven’ when gold was witnessing its worst five-day drop since 1983.

Thus, as we move to Q2 of 2026, it remains to be seen whether the market is still divided or there is some agreement in terms of the actual ‘safe haven’ notion.


Final Summary

  • The Gold vs. Bitcoin debate continues to unfold, as both assets show strength at different times under different market conditions.
  • The negative correlation metric further confirms that both assets are not moving in the same direction.


İlgili Sorular

QWhat was the price correlation between Bitcoin and Gold at the time of reporting, and what does it indicate?

AThe price correlation between Bitcoin and Gold was -0.47, indicating that the two assets were moving in opposite directions.

QAccording to the article, which asset was performing better on the XAU/BTC 4-hour chart at the time of reporting?

AGold was performing better than Bitcoin, as indicated by the green candles on the XAU/BTC 4-hour chart.

QWhat did the RSI level of 72 suggest about the market sentiment for the assets discussed?

AThe RSI level of 72 was in the overbought zone, which confirmed the sentiment that the bounce was minimal and not indicative of a real trend change.

QWho is cited in the article as a major critic of Bitcoin, and what was his stance?

APeter Schiff is cited as a major critic of Bitcoin, echoing the sentiment that Bitcoin is a risky asset compared to gold and advising people to 'get out while you still can'.

QHow did Bitcoin's role as a 'safe haven' asset compare to Gold's during the worst five-day drop for gold since 1983?

ABitcoin acted as a 'safe haven' asset during gold's worst five-day drop since 1983, outperforming gold and providing a hedge during that period of market stress.

İlgili Okumalar

Goldman Sachs: July Smashes Through Crowded Trades, U.S. Stock Bull Market Not Broken but Harder to Navigate

Goldman Sachs: July Sees Crowded Trades Unwound, U.S. Bull Market Intact but Getting Tougher. The U.S. stock market in July did not see an index-level crash, but rather a significant unwinding of speculative positions. While the S&P 500 remained stable—trading within a narrow 3.5% range and staying within 2% of its high—underlying market dynamics were volatile. Heavily crowded trades, particularly in high-momentum tech, AI-linked stocks, and Asian strategies, faced severe pressure and forced deleveraging. Data indicates this was a meaningful cleanse, not a minor adjustment. Global tech exposure saw its largest sell-off in over five years, leverage in Korean equity ETFs plummeted, and Goldman's prime brokerage recorded the largest gross exposure reduction since late 2022. Leverage on momentum factors among fundamental long/short clients fell to the 28th percentile of its one-year range. The AI trade narrative shifted from pure potential to a focus on tangible returns. While Meta failed to show clear AI monetization, Microsoft and Amazon provided evidence that massive capital expenditure is translating into scalable revenue and product growth, preventing a blanket sell-off of the AI sector. The Federal Reserve's more opaque communication style and volatility in long-end Treasury yields have introduced new friction, particularly for rate-sensitive growth and tech stocks. The broader outlook for U.S. equities remains favorable, supported by a strong economy, robust earnings, and substantial AI capital expenditure. However, risk/reward is no longer cheap, and the market's upward elasticity has weakened. The Nasdaq 100's trajectory—up 12% year-to-date despite significant pullbacks—illustrates that the bull trend persists but the path is becoming more difficult. The key lesson from July is that the market no longer rewards crowded, highly leveraged trades, requiring more disciplined and liquid portfolio approaches.

marsbit58 dk önce

Goldman Sachs: July Smashes Through Crowded Trades, U.S. Stock Bull Market Not Broken but Harder to Navigate

marsbit58 dk önce

Interview with Robinhood Executive: Meme + Tokenized US Stocks as "Barbell" Customer Acquisition Strategy, All Business Lines Achieve Hundreds of Millions in Revenue

Interview with Robinhood executive Johann Kerbrat reveals the company's "barbell" customer acquisition strategy for its new Robinhood Chain, combining meme tokens with tokenized stocks. Three weeks after mainnet launch, the chain has seen over $3B in weekly DEX volume and 105M transactions. Kerbrat explains the logic behind the permissionless chain: meme tokens attract DeFi users, while tokenized real-world assets (RWA), currently over 90 US stocks and ETFs accessible in 120+ countries, serve global users. The goal is to bring Robinhood's 27 million funded accounts on-chain by simplifying DeFi with a user-friendly interface, exemplified by features like Robinhood Earn which offers yield without requiring wallet management. Built on Arbitrum's technology stack for its speed, low cost, and Ethereum's security, the chain focuses on financial products like Earn, spot trading, and perpetuals. Kerbrat downplays direct competition with platforms like Base, emphasizing the goal of expanding the overall market for on-chain assets. He details selective partnerships (e.g., Morpho, Lighter) based on compliance, unique UX, and differentiation. While regulatory clarity is pending for US perpetuals, the expansion continues via Bitstamp in Europe. Finally, Kerbrat positions Robinhood as a "super app" integrating stocks, options, crypto, banking, and AI trading, with all major business lines generating hundreds of millions in revenue. For the chain, current priority is driving adoption over maximizing gas fee revenue.

marsbit3 saat önce

Interview with Robinhood Executive: Meme + Tokenized US Stocks as "Barbell" Customer Acquisition Strategy, All Business Lines Achieve Hundreds of Millions in Revenue

marsbit3 saat önce

Fidelity Q3 Report: BTC, ETH, and SOL Continue to Build Bottoms; How Much Further Will This Crypto Bear Market Go?

Fidelity's Q3 Crypto Signal Report analyzes the current bear market, noting Bitcoin (BTC), Ethereum (ETH), and Solana (SOL) are in a prolonged bottoming phase. Key indicators like the weighted Net Unrealized Profit/Loss (NUPL) have turned negative (-0.01), signaling the market is slightly below its aggregate cost basis, with BTC acting as the primary stabilizing asset. BTC's dominance has risen to 68%, indicating a lack of capital rotation to other digital assets. Performance has been weak across the board, with BTC, ETH, and SOL down significantly year-to-date. Market sentiment is depressed, exacerbated by substantial outflows from spot ETPs and a challenging macro environment. The report compares the current ~203-day downtrend to historical ~300-day bottoming cycles, suggesting the process may be two-thirds complete, with late 2026 as a potential timeframe to monitor. For Bitcoin, NUPL at 0.09 indicates cautious sentiment, while momentum signals remain negative. The Yardstick metric points to potential undervaluation relative to network security (hashrate). Ethereum's NUPL is deep in the "capitulation" zone at -0.43, a historically positive signal for future returns, though its momentum and network fee revenue are negative. Solana shows the deepest NUPL at -0.72 but demonstrates relative resilience in on-chain activity and stablecoin transfer volume. The report concludes that while several metrics are near historical capitulation levels, a definitive market bottom has not yet been established. The path forward likely involves continued consolidation, with BTC's relative strength and fundamental on-chain usage for ETH and SOL providing key areas for investor observation.

marsbit3 saat önce

Fidelity Q3 Report: BTC, ETH, and SOL Continue to Build Bottoms; How Much Further Will This Crypto Bear Market Go?

marsbit3 saat önce

İşlemler

Spot
活动图片