Global Wealth Report: US Produces 36 New Millionaires Daily, India Emerges as Fastest-Growing Dark Horse

marsbit2026-04-25 tarihinde yayınlandı2026-04-25 tarihinde güncellendi

Özet

Knight Frank's "The Wealth Report 2026" highlights the rapid expansion of global private wealth. Between 2021 and 2026, the number of ultra-high-net-worth individuals (UHNWIs), those with over $30 million, increased by 162,191 to 713,626—averaging 89 new millionaires daily. The United States led this growth, contributing 41% of all new UHNWIs and increasing its global share from 33% to 35%. China remains the second-largest wealth hub, though its share declined from 18% to 17%. India emerged as a standout, with a 63% surge in UHNWIs. Regionally, North America dominates with 37% of UHNWIs, followed by Asia-Pacific (31%) and Europe (25%). The Middle East also saw significant growth. Future growth is expected from rapidly maturing economies like Indonesia, Saudi Arabia, and Poland.

Author: Knight Frank

Compiled by: Felix, PANews

Global private real estate advisory firm Knight Frank recently released the "2026 Wealth Report," highlighting the rapid expansion of global private wealth and dynamic changes in its geographical distribution. PANews has summarized the core content of the report.

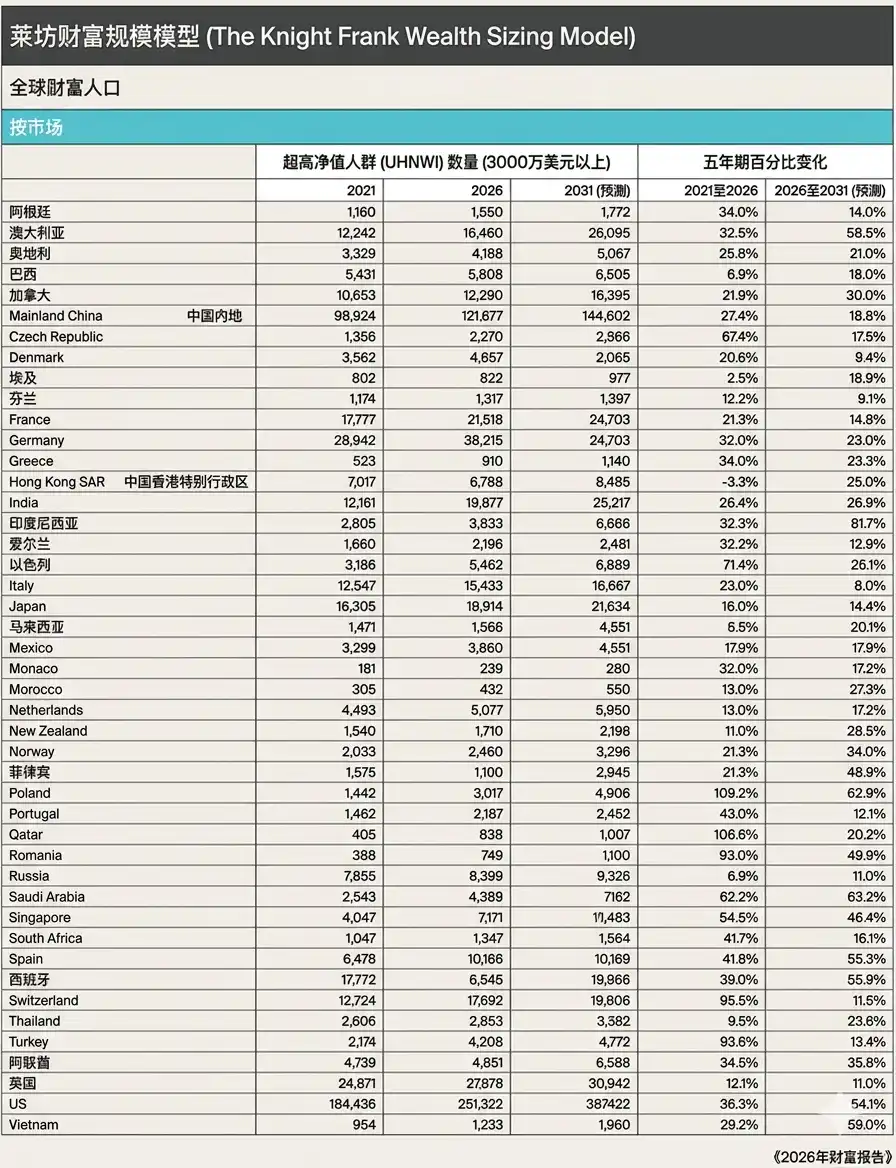
The report shows that between 2021 and 2026, the number of global ultra-high-net-worth individuals (with wealth exceeding $30 million) increased from 551,435 to 713,626, adding 162,191 new ultra-high-net-worth individuals over five years, or an average of 89 people per day breaking through the $30 million wealth threshold.

The United States led this wealth growth. During this period, 41% of all new ultra-high-net-worth individuals came from the U.S. The U.S. share of global ultra-high-net-worth individuals steadily increased from 33% in 2021 to 35% in 2026. By 2031, the U.S. is projected to account for 41% of the world's ultra-high-net-worth individuals.

China remains the world's second-largest wealth creation center, although its relative position is declining. China's share of global ultra-high-net-worth individuals fell from 18% in 2021 to 17% in 2026 and is expected to drop further to 15% by 2031. In fact, almost all countries are losing their global market share to accommodate the continued growth of U.S. wealth.

India is a counterexample. Between 2021 and 2026, its number of ultra-high-net-worth individuals (over $30 million) surged by 63%, from just over 12,000 to nearly 20,000. India's share of global ultra-high-net-worth individuals is only 2.8%, up from just over 2% five years ago. By 2031, the number of ultra-high-net-worth individuals in India is expected to increase from the current 19,877 to 25,217.

Australia holds a position in the global wealth landscape that far exceeds its size. Over the next five years, its number of ultra-high-net-worth individuals is expected to grow by nearly 60%, reaching 26,095, accounting for almost one-thousandth of its total population. Australia has a large number of billionaires, which is projected to grow by 77% between 2026 and 2031.

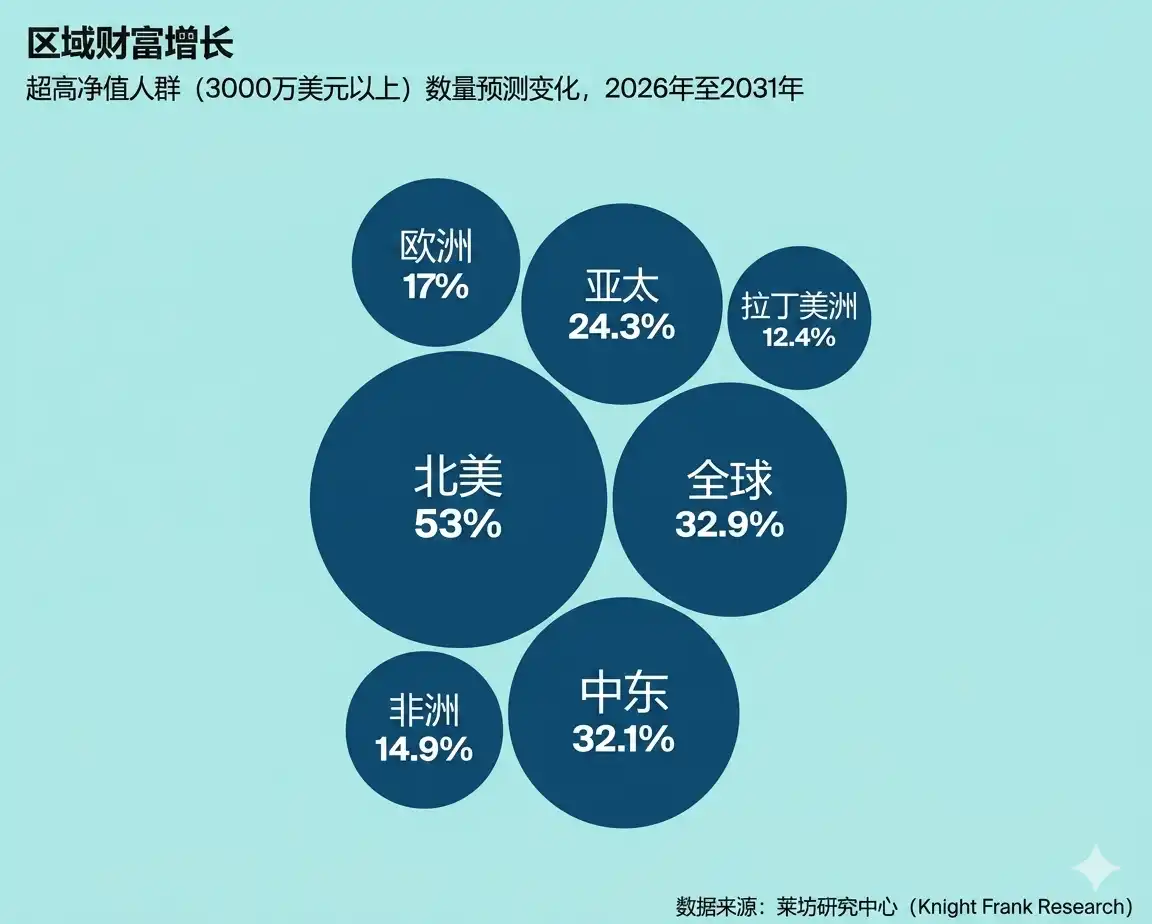
By region, the global wealth landscape is dominated by three major areas.

North America leads, accounting for 37% of global ultra-high-net-worth individuals in 2026. The Asia-Pacific region accounts for nearly 31% of ultra-high-net-worth individuals in 2026. Europe follows closely, with 183,953 super-rich, representing about a quarter of the global total. Beyond these regions, the Middle East stands out. Over the past five years, the Middle East's share of global millionaires increased from 2.4% to 3.1%.

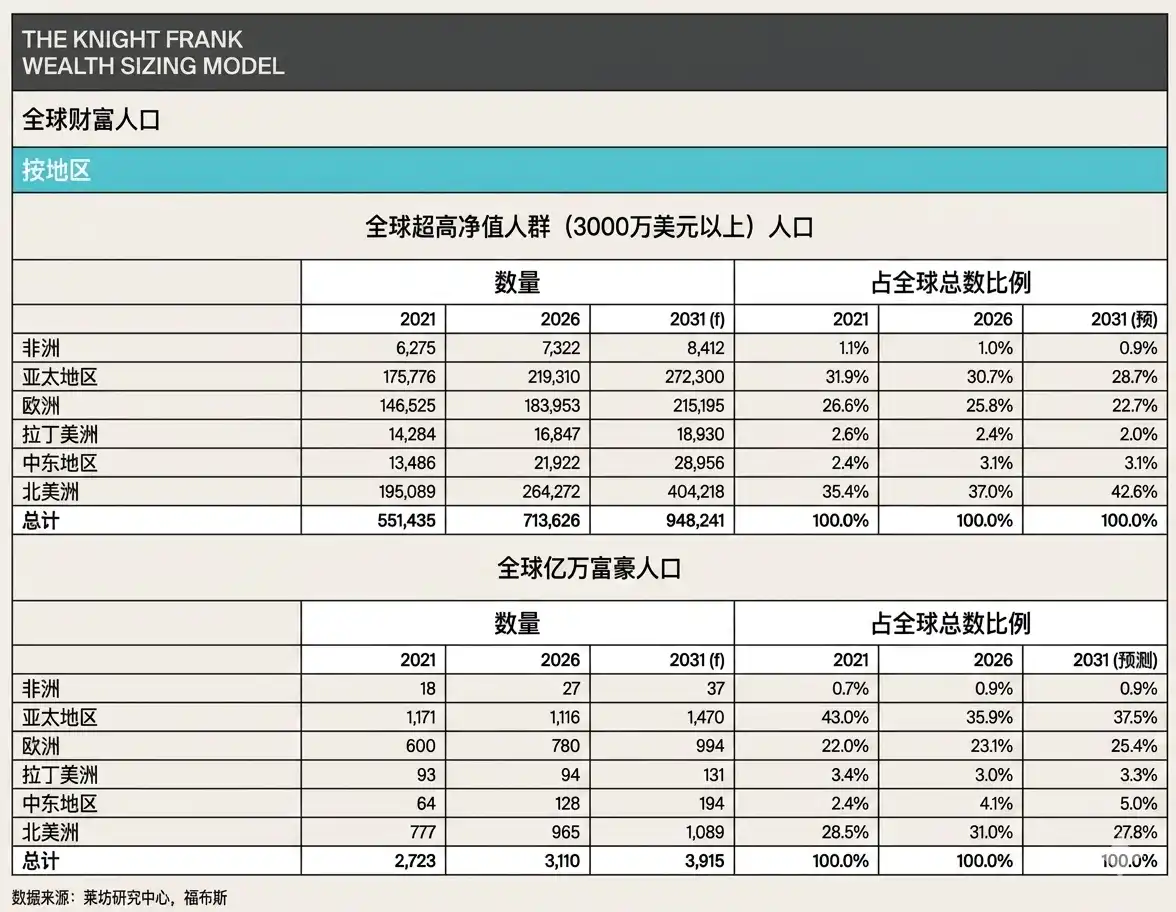
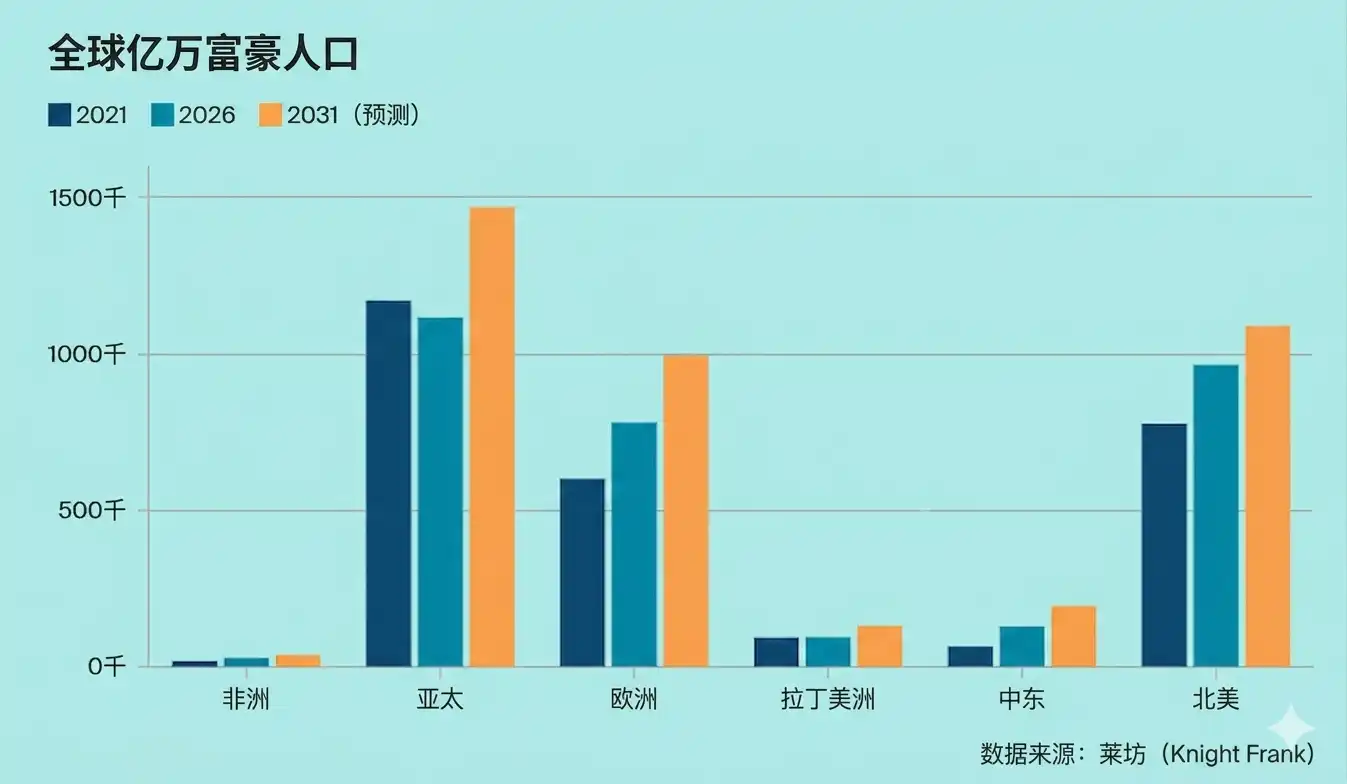
Additionally, the geographical distribution of the world's 3,110 billionaires is more dispersed than the broader ultra-high-net-worth individual group. The Asia-Pacific region has the most billionaires, with 1,116, followed by North America with 965. The Middle East accounts for just over 4% of the world's billionaires, significantly higher than its share of ultra-high-net-worth individuals.

Looking ahead, billionaire growth is expected to be highly geographically diverse. In percentage terms, Saudi Arabia is projected to lead, with its number of billionaires growing by 183%, followed by Poland (123%), Sweden (81%), and Australia (77%). This highlights the increasingly global trend of future billionaire growth.

Over the next five years, the growth of global ultra-high-net-worth individuals will not be led by traditional economies but by some rapidly maturing economies. Indonesia tops the list, with its number of ultra-high-net-worth individuals (over $30 million) expected to surge by 82% by 2031. It is followed by Saudi Arabia and Poland, both with growth rates exceeding 60%. Vietnam's nearly 60% growth highlights the rapid rise of emerging wealth centers in Southeast Asia.

Europe also shows strong performance, with Sweden, Romania, and Greece all achieving significant growth. Although wealth remains concentrated in a few global economic powerhouses, its geographical distribution is expanding.

Related reading: California to 'Harvest' 5% from Billionaires in One Go? Some Are Moving Overnight

İlgili Sorular

QAccording to Knight Frank's report, how many new ultra-high-net-worth individuals (UHNWIs) were added globally between 2021 and 2026, and what was the daily average?

ABetween 2021 and 2026, 162,191 new ultra-high-net-worth individuals (with wealth exceeding $30 million) were added globally, which is an average of 89 people per day.

QWhich country was the dominant force in global wealth creation, contributing the largest share of new UHNWIs, and what is its projected share by 2031?

AThe United States was the dominant force, contributing 41% of all new UHNWIs. Its share of the global UHNWI population is projected to rise to 41% by 2031.

QIndia is highlighted as a standout performer. What was the percentage growth of its UHNWI population from 2021 to 2026?

AIndia's ultra-high-net-worth individual population surged by 63% between 2021 and 2026.

QWhich three regions currently dominate the global wealth landscape in terms of UHNWI concentration, and what are their respective shares?

AThe three dominant regions are North America (37% of global UHNWIs in 2026), the Asia-Pacific region (nearly 31%), and Europe (about 25%).

QWhich country is expected to have the highest percentage growth in its billionaire population, according to the future projections in the report?

ASaudi Arabia is expected to lead in billionaire growth, with a projected increase of 183%.

İlgili Okumalar

Will the Next Crypto Bull Run Start with On-Chain Trading of SpaceX?

This article presents a scenario-based forecast for the crypto industry from 2026 to 2029, arguing that the next major cycle will be driven not by technological narratives but by legal access to real-world assets. The author predicts that by mid-2026, pre-IPO perpetual contracts for top private companies like SpaceX, OpenAI, and Anthropic on platforms like Hyperliquid will become the primary gateway for accessing quality assets, as most crypto-native tokens fail to capture real value. The much-hyped AI x Crypto intersection largely fails except for prediction markets, which thrive on betting on AI model supremacy. By 2027, public blockchain foundations are forced to choose between catering to retail speculation or building compliant infrastructure for institutions, with many opting for the latter. Growth in stablecoins and tokenized private credit/equity hits a "triple ceiling" due to regulatory and political uncertainty rather than market demand. The pivotal shift is forecast for 2028. A major liquidation event in pre-IPO perpetuals exposes the structural flaw of synthetic markets lacking a real underlying asset anchor. In response, regulatory changes finally allow the public solicitation of private securities resales to verified accredited investors. This creates a legitimate secondary market for real company equity, which then becomes the core asset class of the new bull market, relegating synthetic perps to a niche role. By 2029, the industry becomes "boring" but foundational. Tokens without claims on real cash flows or assets cease trading. Stablecoin growth is steady but politically capped. Crypto infrastructure fades from view as it gets absorbed into traditional finance backends. The article's central thesis is that the key bottleneck for crypto's next phase is legal and regulatory channels for real asset ownership, not technology.

marsbit20 dk önce

Will the Next Crypto Bull Run Start with On-Chain Trading of SpaceX?

marsbit20 dk önce

The Value Distribution of Stablecoins

**Summary: The Value Distribution of Stablecoins** The article argues that stablecoins are evolving from mere trading tools into broader channels for dollar access. It divides the stablecoin ecosystem into four layers to analyze how value is distributed: 1. **Issuance Layer:** Mints stablecoins, holds reserve assets, and captures the spread between reserve yield and user costs (e.g., Tether, Circle). This layer currently earns the largest profit margin. 2. **Infrastructure Layer:** Connects stablecoins to the traditional financial system, handling fiat on/off-ramps, banking integration, compliance (KYC/AML), and asset management (e.g., Bridge, BVNK). This is the "unglamorous" but critical work, building the essential bridges between crypto and real-world finance. 3. **Acquiring/Distribution Layer:** Integrates stablecoins into merchant systems, manages payment flows, and provides enterprise financial software (e.g., Stripe, Coinbase). They act as the access point for businesses. 4. **Application Layer:** The end-users and businesses that ultimately use stablecoins for payments, settlements, or as a store of value. They benefit from convenience but have little pricing power. The core thesis is that while the issuance layer currently dominates profits, the often-overlooked **infrastructure layer holds significant long-term potential**. The real challenge and barrier to mass adoption is not the on-chain transfer of stablecoins (which is simple), but the complex "last mile" integration into existing business workflows, banking systems, and regulatory frameworks across different countries. Companies in this layer are currently in a "land grab" phase, investing heavily to build networks, secure bank partnerships, and establish compliance pathways. While their position is currently pressured by the profitable issuers above and distribution platforms below, the article suggests that if stablecoins become a default financial rail for businesses, the infrastructure providers who have done the hard work of integration will ultimately gain strong pricing power and become entrenched, essential players.

marsbit7 saat önce

The Value Distribution of Stablecoins

marsbit7 saat önce

The Value Distribution of Stablecoins

The Value Distribution of Stablecoins The article argues that stablecoins are evolving from a mere trading tool into a broad "dollar channel." It analyzes the industry's value chain through four layers: 1. **Issuance Layer (e.g., Tether, Circle):** The top layer that mints stablecoins, holds reserve assets, and captures the thickest interest rate spread. 2. **Infrastructure Layer (e.g., Bridge, BVNK):** Connects stablecoins to the traditional financial system, handling critical but complex "dirty work" like fiat on/off-ramps, banking integration, compliance (KYC/AML), and cross-border settlement. 3. **Acquiring/Distribution Layer (e.g., Stripe, Coinbase):** Embeds stablecoins into merchant systems, manages payment flows, and integrates with enterprise software. 4. **Application Layer:** End-users and businesses that ultimately use stablecoins for payments, settlement, or storing value. The author posits that while the issuance layer currently captures the most profit, the most overlooked and potentially critical layer is infrastructure. The core challenge for stablecoin adoption isn't the on-chain transfer (which is simple), but bridging the gap between blockchain and the real-world financial system. This involves solving practical problems for businesses: fiat conversion, reconciliation, tax handling, and user onboarding. Infrastructure companies are currently in a difficult "land-grab" phase—building networks, securing banking relationships, and achieving compliance country-by-country. They face pressure from both the profitable issuance layer above and distribution platforms below. However, the author suggests this layer is building a crucial moat. Once stablecoins become a default business rail, the infrastructure players who have done the hard work of integration may gain significant, durable value and pricing power.

链捕手7 saat önce

The Value Distribution of Stablecoins

链捕手7 saat önce

İşlemler

Spot
Futures
活动图片