Missed Pivot Points (MPP) are levels plotted on charts. The main difference with MPP is that they are drawn not in the standard way, but based on calculations. The foundation of missed pivot points is data from the previous trading period, which can be a day, week, or month. The tool was popularized by retail trader Rob Booker, who specializes in short selling.
So how are they calculated?
Calculating Missed Pivot Points
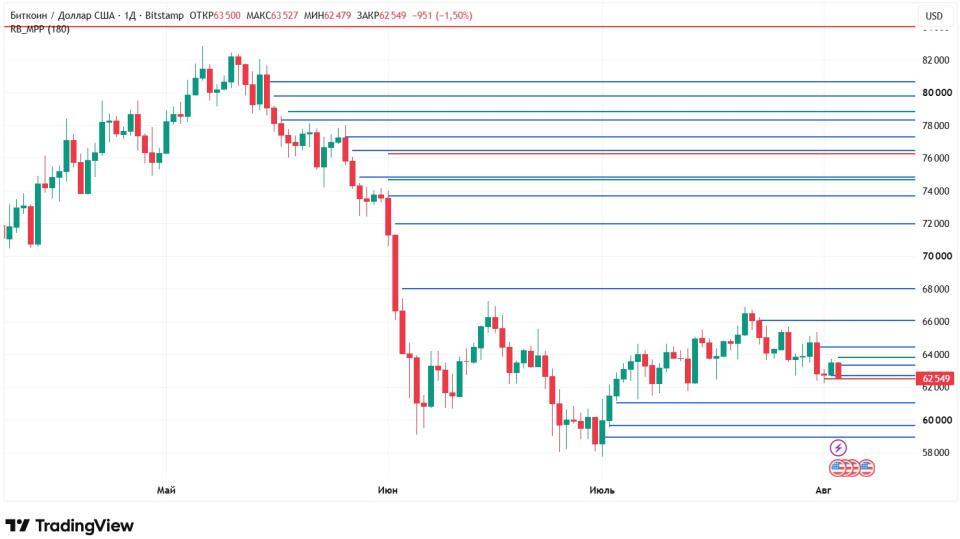
To determine where a particular missed pivot point is located, it is necessary to find the arithmetic mean of the closing, high, and low prices of the previous trading period. Considering that the determination of the level is based on mathematics, drawing it on the chart may not always be obvious from a visualization standpoint. An image of Bitcoin's price movement on the Bitstamp exchange will help confirm this:
Source: tradingview.com
The chart shows many lines of different colors: red monthly, green weekly, and blue daily. As can be seen from the image, far from all of them could have been drawn by eye alone, as they often do not coincide with extremes.
In actual cryptocurrency trading, you won't have to calculate missed pivot points yourself. The trading platform will do this automatically. For example, on TradingView, you only need to set the "Days Ago" argument. It is responsible for the time period on which to search for levels. By default, the argument is set to 180 days. A crypto trader can decrease or increase this parameter at their discretion.
Having figured out how to build and plot missed pivot points, let's turn to how to trade using them.
Missed Pivot Points in Trading
Rob Booker himself believes that the levels act as so-called magnets: the price will tend towards them one way or another. The best reversal signal for a crypto trader will be an area where many different levels have formed. This strengthens the signal that a long-term trend break is quite likely.
If we look at Bitcoin's daily chart, quite strong resistance zones have currently formed in two ranges: $62,000–66,000 and $74,000–80,000. If BTC can break above them, a serious rise is quite possible. At the moment, they act as substantial resistance zones.
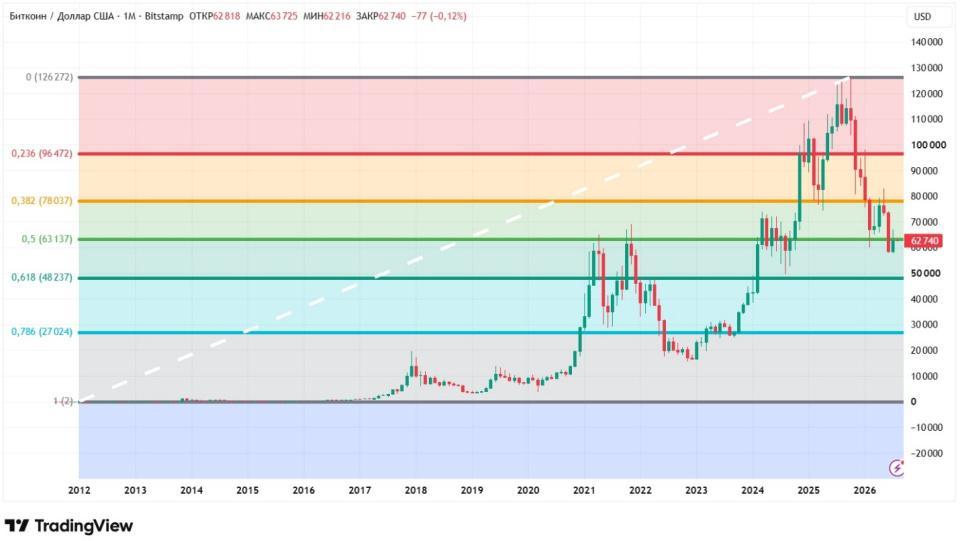
Moreover, Booker claims that a cluster of missed pivot points is often confirmed by Fibonacci levels. If we consider Bitcoin from its low to its high, this holds true. The 50% correction level is around $63,000, thus falling into the first range, and the 38.2% level is not far from $78,000, which corresponds to the second price interval.
Source: tradingview.com
Additionally, missed pivot points can also be used as regular support and resistance levels. In this case, you only need to decide on a strategy: breakout or bounce. In the first case, a trade is made when the level is broken in its direction; in the second case, in the opposite direction. In any case, do not forget to place stop-loss orders, which will prevent unlimited losses.
Despite missed pivot points according to Rob Booker being a simple and effective tool, it has some drawbacks.
Indicator Disadvantages
The first downside is multiple variations. There are quite a few versions of missed pivot points. There are versions by Booker, by Thomas DeMark, by Ken Wood, and others. They all have a right to exist, and their effectiveness depends on the specific trading system.
The second downside is that missed pivot points should not be used as a standalone analytical tool. Even Rob Booker himself, in his lessons, constantly uses the Knoxville Divergence indicator as confirmation.
The third downside is subjectivity. Determining where there are "many" missed pivot points, as Booker advises, has no clear boundaries. As a result, the outcomes can be ambiguous.
The fourth downside is that the indicator can give false signals, especially during consolidation.
Conclusion
Rob Booker's Missed Pivot Points, MPP, is an indicator that operates on the principle of support and resistance levels. The peculiarity of MPP is that the set of its lines is plotted not based on visual representation, but on a mathematical calculation.
This material and the information in it are not individual or any other recommendation. The opinion of the editorial board may not coincide with the opinions of analytical portals and experts.