Everyone Is Waiting for the War to End, But Does the Oil Price Suggest a Long-Term Conflict?

marsbit2026-04-07 tarihinde yayınlandı2026-04-07 tarihinde güncellendi

Özet

This article argues that the market views oil price volatility as a consequence of the ongoing conflict, but the real insight is understanding how the war itself is being priced through oil. With the Strait of Hormuz blocked, global crude supply is being restructured, with Asian buyers shifting to US oil, causing WTI to surpass Brent—a sign of structural changes in pricing and trade flows. While short-term price differences can be explained by contract timing, the deeper issue is a fundamental shift in who can supply oil. The market's key misjudgment is not on price, but on time. Futures curves still imply the conflict will end soon and supply will recover. However, the more likely path is a prolonged war of attrition. This means high oil prices are not a temporary shock but a new structural reality, with a range of $120-$150. In this framework, oil is no longer just a commodity but the "upstream variable" for all assets. Its repricing will ripple through interest rates, currencies, equity, and credit markets. The market has priced in the war's occurrence, but not its persistence. The analysis concludes that a prolonged conflict is the base case scenario, and any pullbacks in oil prices present an opportunity as the market has yet to fully price in a long-term disruption.

Editor's Note: While the market still views oil price fluctuations as an "outcome variable" of the war, this article argues that what truly needs to be understood is how the war itself is being priced through oil.

As the Strait of Hormuz remains blocked, the global crude oil supply system is being forcibly restructured—Asian buyers are turning to U.S. crude oil on a large scale, and WTI surpassing Brent marks a structural shift in pricing mechanisms and trade flows. Short-term price differentials can be explained by contracts, but at a deeper level, it's a question of "who can still supply."

The author further points out that the market's key misjudgment lies not in price but in time. The futures curve still implies one premise: the conflict will end in the short term, and supply will recover. But the more likely path is a prolonged war of attrition. This means that high oil prices are no longer a temporary shock but will evolve into a more persistent structural state, with the range potentially shifting upward to $120–150.

Under this framework, crude oil is no longer just a commodity but becomes the "upstream variable" for all assets. Its repricing will transmit layer by layer through interest rates, exchange rates, stock markets, and credit markets.

The market has priced in the occurrence of the war but has not yet priced in its persistence.

Below is the original text:

Trump gave Iran a 10-day deadline. That was a week ago. Yesterday, he reminded everyone again: the countdown has only 48 hours left. Tehran's response: no.

Five weeks ago, on February 28, when U.S. and Israeli warplanes launched airstrikes on Iran, the market's pricing logic was still that of a "surgical" air strike: two weeks, three at most; the Strait of Hormuz would reopen; oil prices would spike and then fall back, and everything would return to normal.

But our judgment at the time was: it won't.

From day one, our core view has been that this war would first escalate and only later possibly de-escalate. The most likely path is the involvement of ground forces, evolving into a long and draining conflict. The duration of the Strait of Hormuz's closure would far exceed the assumptions the market is willing to model. We have provided the full logic in our duration framework, Hormuz pricing model, and war variable analysis.

The core judgment is simple: Iran doesn't need to win; it only needs to raise the cost of the war high enough to force Washington to seek an exit path. And this "exit" will not come with the smooth reopening of the strait.

Five weeks later, every key part of this judgment is being gradually validated. The Strait of Hormuz remains closed. Brent crude settled around $110. The Pentagon is preparing for weeks of ground operations. Trump's war goals have also shifted from "denuclearization" to "bombing them back to the Stone Age," but he still cannot clearly define what "victory" means.

The deployment of ground forces is the escalation inflection point we have been tracking. Marine and airborne troops are already assembling in the theater; this moment is approaching.

But more critical than the next round of airstrikes or the next ultimatum is oil.

Oil is not a byproduct of this war; oil is the core of the war itself. Stock markets, bond markets, crypto markets, the Fed, even your daily food expenses—everything is a downstream variable. As long as you judge oil prices correctly, everything else will unfold accordingly; once you misjudge, all other decisions will lose meaning.

WTI crude prices have just surpassed Brent for the first time since 2022, a change that has already drawn market attention.

Good. It should.

WTI Above Brent: What Everyone Is Asking

On April 2, WTI crude settled at $111.54, while Brent settled at $109.03. WTI's premium over Brent was $2.51, the largest spread since 2009. Just two weeks ago, WTI was still at a significant discount to Brent.

Everyone is asking: What happened? Below is the brief version, and the version closer to reality.
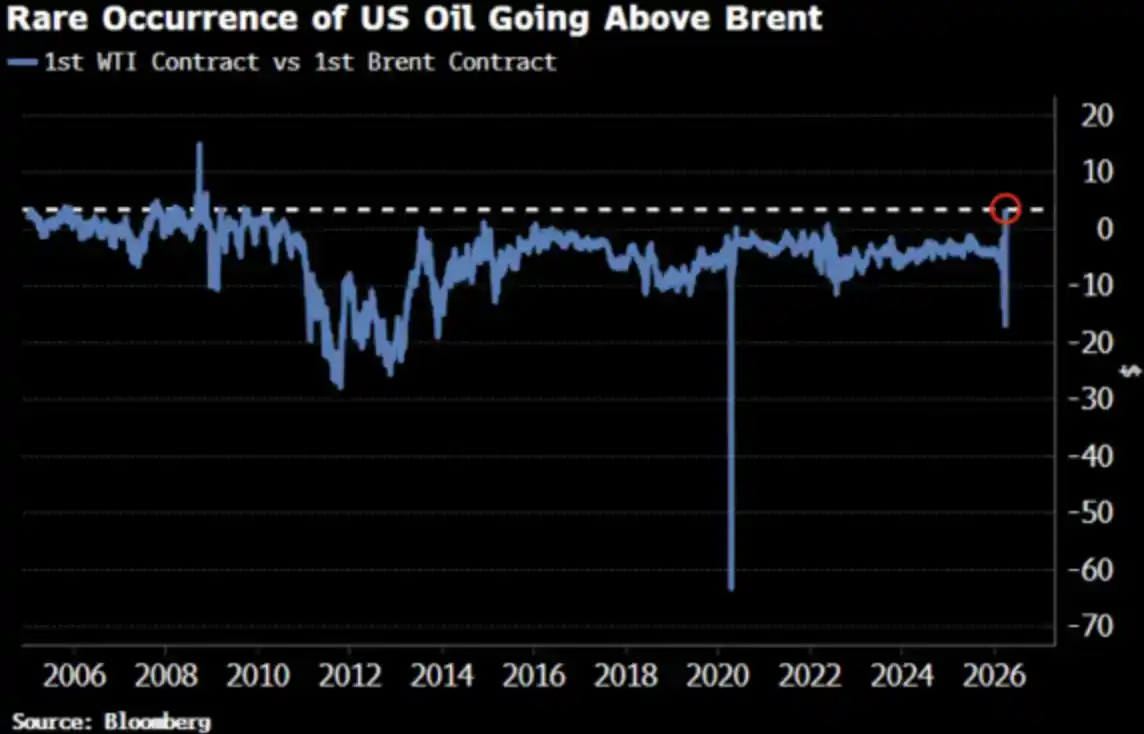
Brief Version: Mismatch in Contract Expiries

WTI's front-month contract is for May delivery, while Brent's front-month contract has rolled to June. In such a tight supply situation, "delivery one month earlier" means a higher price—WTI just happens to have an earlier delivery date.

Adi Imsirovic, an oil trader with 35 years of experience now at Oxford, stated that on top of historically high freight and insurance costs, buyers are willing to pay nearly $30/barrel more for Brent crude delivered one month earlier. In his 35-year career, he has never seen anything like this.

This is a "mechanism-level" explanation—it is correct but incomplete.

Real Version: The Entire Price Curve Is Shifting

The convergence of WTI and Brent is not just a sporadic mismatch in front-month contracts. Bloomberg points out that this phenomenon is clearly visible across multiple contract months, running through the entire forward curve. In other words, the entire price curve is being repriced.

Why? A shift in Asian demand. In late March, Asian refineries locked in about 10 million barrels of U.S. crude for May shipment; the previous week, they also purchased about 8 million barrels. Kpler expects U.S. crude exports to Asia to reach 1.7 million barrels per day in April, up from 1.3 million in March. China, South Korea, Japan, and ExxonMobil's refinery in Singapore are all buying U.S. crude—because it is "the only available supply right now."

The Strait of Hormuz remains closed. Abu Dhabi's benchmark crude Murban—the closest substitute for WTI—has disappeared from the global market. WTI is becoming the world's "marginal pricing oil."

This is not panic buying but a change in flow structure.
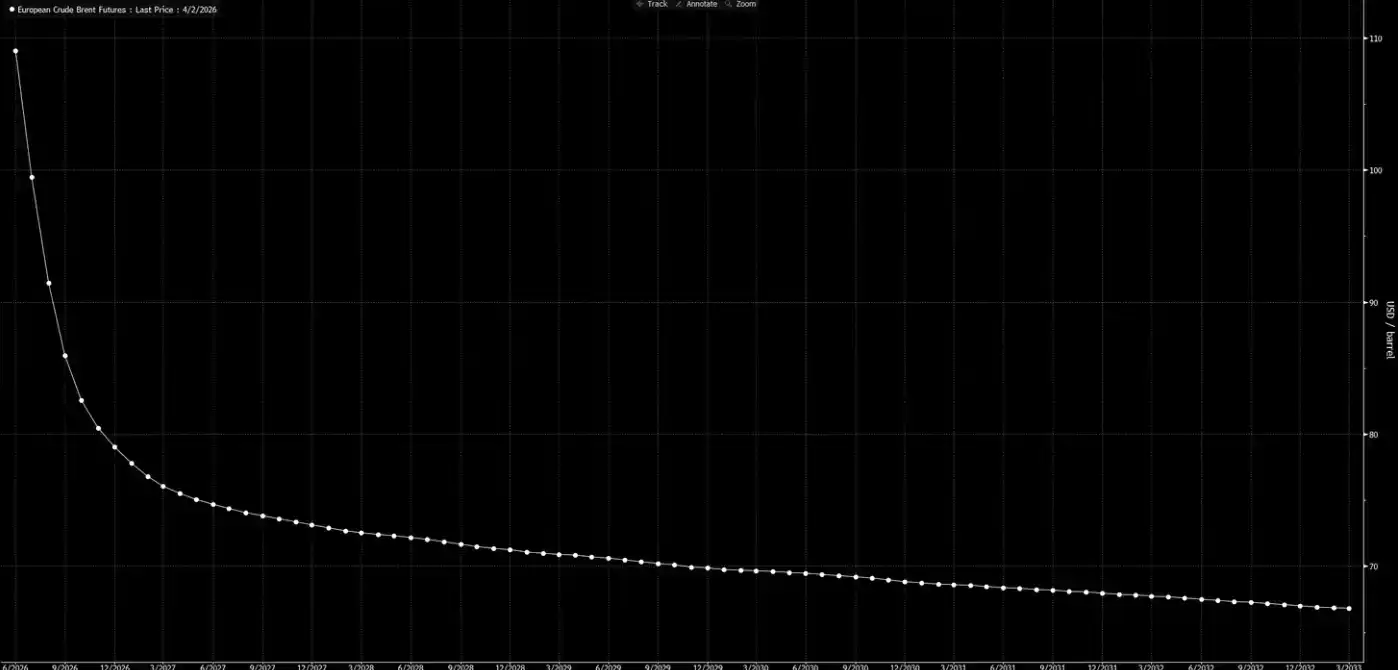
Now look at the forward price curve.

This curve is sending a signal: this is just a temporary shock; by Christmas, everything will be back to normal.

Our judgment: This curve is "dreaming."

Three Endings, One Baseline Path

We have already proposed this analytical framework in the "Weekly Signal Playbook." So far, nothing has changed; if anything, the probability of the baseline scenario has only strengthened.

This war will ultimately end in only three ways:
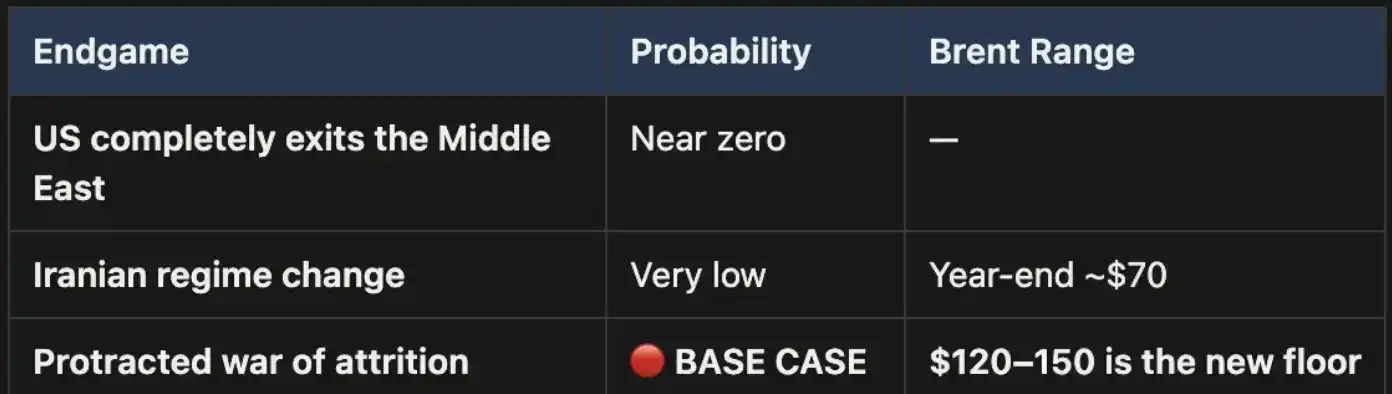
Ending one is almost politically impossible.


Ending two is equally untenable: terrain conditions, troop requirements, and the logic of guerrilla warfare all indicate that this path would be costly and difficult to conclude. Iran's land area is three times that of Iraq, with nearly twice the population, not to mention mountainous terrain that leaves no room for invaders. This is not 2003.

Ending three is the baseline scenario, and its probability is far ahead. If the conflict evolves into a long-term war of attrition, the closure of the Strait of Hormuz will persist, and oil prices will remain high. This high level will be structural, not temporary. The current forward price curve clearly underprices this.

What most people overlook is this: from the perspective of the oil industry itself, a long-term war might actually align with U.S. strategic interests. Middle Eastern crude production capacity would be damaged in the conflict, forcing global buyers to turn to North American energy because other alternative sources are scarce. Higher oil prices would also stimulate U.S. producers to expand output—increasing rigs and investing more in shale oil. Look at the chart below: historically, almost every major oil price spike has been followed by an uptick in U.S. production within 12 to 18 months.
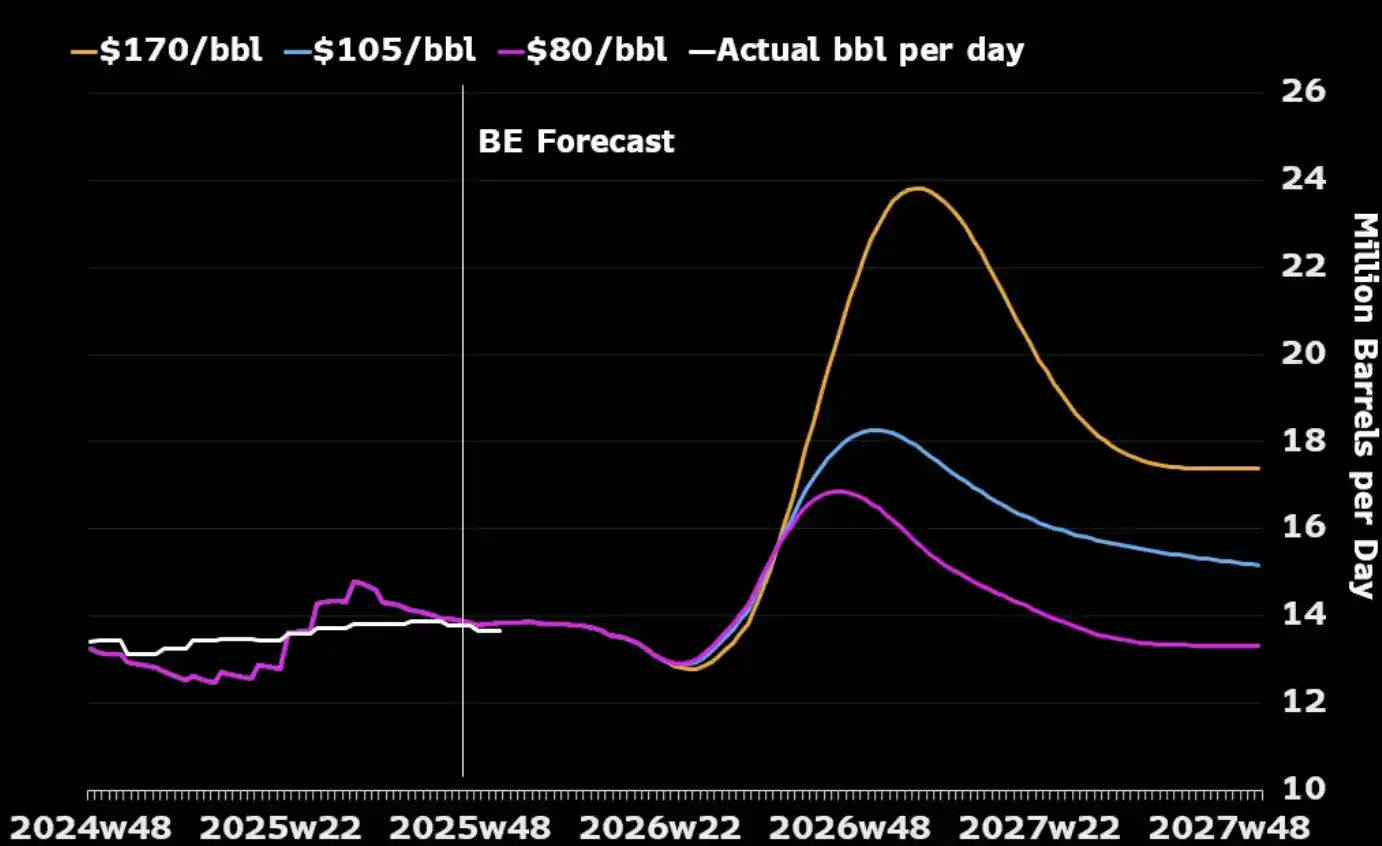
The only cost the U.S. truly needs to manage is domestic: how to avoid gasoline prices staying above $4 per gallon for too long, triggering political backlash. This is a "pain threshold," not a condition for ending the war.

The "Arithmetic" of Price

With the Strait of Hormuz closed, $110 for Brent is not the ceiling but the starting point. Under our baseline scenario, as long as the strait remains closed, oil prices will sustain in the $120 to $150 range.

With each passing week, inventories are being drawn down. UBS data shows global inventories had fallen to the five-year average by the end of March—and that was before the latest round of escalation. Macquarie estimates: if the war drags past June and the strait remains closed, there is a 40% probability oil prices will surge to $200.

The front-month spread (the difference between Brent's two nearest contracts) has widened to $8.59/barrel. The market is paying about an 8% premium for "delivery one month earlier"—this is tension at the 2008 level.

But in 2008, 15% of global supply wasn't physically blocked.

Now, almost every model, every price curve, every year-end prediction on Wall Street is built on the same premise: this conflict will end, the Strait of Hormuz will reopen, oil prices will return to normal, and the world will go back to the way it was.

Our judgment: It won't.

The back end of the forward curve hasn't caught up with reality. The market has priced in the "occurrence of the war" but has not priced in the "persistence of the war." Before Hormuz reopens, every pullback in crude is an opportunity. This is our core position, and we will not hedge it.

Oil is the first node. When "ground forces enter" and there is no quick victory—when the conflict evolves into the long-term war of attrition we judged from day one—repricing will not stop at crude itself but will transmit sequentially to interest rates, exchange rates, stock markets, and credit markets. This is what will happen next.


Trend Kriptolar

İlgili Sorular

QWhat is the main argument of the article regarding the oil market and the ongoing conflict?

AThe article argues that the oil market is mispricing the duration of the conflict. While the market prices in a short-term disruption, the more likely path is a prolonged war of attrition, which would make high oil prices a structural, not a transitory, state. Oil is not just a commodity but the core of the war and the upstream variable for all other assets.

QWhat significant change occurred between WTI and Brent crude oil prices, and what does it signify?

AWTI crude oil price traded at a premium to Brent for the first time since 2022, with a spread of $2.51. This signifies a structural shift in global oil trade flows, driven by Asian buyers turning to US crude after the closure of the Strait of Hormuz, making WTI the marginal pricing oil for the world.

QAccording to the article, what are the three possible outcomes of the conflict, and which is the most probable?

AThe three outcomes are: 1) A swift, decisive US victory forcing Iran surrender (politically impossible), 2) A full-scale US invasion and occupation of Iran (unviable due to terrain and cost), and 3) A prolonged war of attrition. The article states that Outcome 3 is the base case with the highest probability.

QWhat is the expected price range for oil in the article's base case scenario, and why?

AIn the base case scenario of a prolonged conflict with the Strait of Hormuz closed, the expected oil price range is $120 to $150 per barrel. This is because the disruption is structural, global inventories are being drawn down, and 15% of global supply is physically blockaded.

QHow does the article suggest the market's current pricing is flawed?

AThe market's current pricing, as seen in the futures curve, is flawed because it is predicated on the assumption that the conflict will end soon and the Strait of Hormuz will reopen. The article contends the market has priced in the 'occurrence' of the war but has not priced in its 'persistence,' leading to a significant mispricing of long-term oil price structure.

İlgili Okumalar

After Three Consecutive Quarters of Decline, Can the Crypto Market Find a Window for Stabilization in Q3?

The cryptocurrency market has just concluded its worst-performing quarter since 2022, with total capitalization dropping 12.6% to $2.1 trillion. All core metrics indicate capital is leaving the sector, not just rotating within it. Bitcoin fell 14.2% and Ethereum dropped 25.4% in Q2, breaking their previous correlation with US tech stocks. A key driver is the reversal in US spot Bitcoin ETF flows, which saw a net outflow of approximately $4.67 billion in Q2, including a record monthly outflow near $4.5 billion in June. While recent data suggests long-term holders are accumulating again, sustained ETF outflows mean continued selling pressure. Market focus is now singularly on the Federal Reserve. The upcoming July FOMC meeting is seen as the most critical event for Q3. A dovish signal could support Bitcoin reclaiming a $68,000-$84,000 range, while a hawkish stance might establish a new trading band around $50,000-$56,000. Additionally, regulatory uncertainty persists, with the progress of the crucial *CLARITY Act* stalling in the Senate, reducing its perceived 2026 passage probability to 40-45%. Despite the broad downturn, a few sectors showed growth. Prediction markets saw nominal volume surge 48.7% year-over-year to $113.8 billion, and tokenized collectibles transaction volume rose 143% quarterly to $1.4 billion. The Real-World Asset (RWA) tokenization sector also continued steady growth, now representing ~$28.1 billion in on-chain value. The market's foundation for an extreme crash appears limited, with Bitcoin price hovering near its 200-week moving average. However, the trading paradigm has shifted from narrative-driven speculation to decisions based on price action, policy developments, and interest rate expectations, making a broad sentiment-driven rally unlikely in the near term.

marsbit8 saat önce

After Three Consecutive Quarters of Decline, Can the Crypto Market Find a Window for Stabilization in Q3?

marsbit8 saat önce

BIT Trading Moment: BTC Still Suppressed by Weekly 200 EMA, Rejection May Restart Decline; Storage and Semiconductors that Surged Last Night Begin Falling in Evening Trading

**Crypto & Stock Market Wrap: Bitcoin Tests Resistance, Stocks Retreat After AI Surge** Bitcoin consolidates around $66,000, facing key resistance near $68,000—an area seen as a major psychological and technical hurdle where previous rallies have failed. Analysts note the cryptocurrency is caught between its 200-week moving average (~$63,333) and 200-week EMA (~$68,328). A clear break above $68k is needed to signal a stronger bullish trend, while a rejection could lead to a retest of $63k support. Market sentiment remains cautious, with low futures open interest pointing to a low-liquidity rebound rather than a full bull market. Bitcoin spot ETFs saw another $203 million inflow. US stock futures pointed lower after a strong Tuesday session led by a massive rebound in semiconductors and memory stocks. The rally was fueled by renewed optimism about AI-driven hardware demand, with Micron, SanDisk, and SK Hynix surging. However, those gains reversed in pre-market trading. Super Micro Computer (SMCI) soared over 20% after hours on strong guidance and a record backlog. Other standouts included Rocket Lab and nuclear energy plays Oklo and X-Energy. Rising oil prices (Brent above $91) and climbing Treasury yields (10-year near 4.64%), however, are reigniting inflation concerns and acting as a headwind for equities. In Asia, markets were mixed. South Korea's KOSPI pared early gains to close slightly higher as semiconductor stocks like SK Hynix gave back initial surges. Japan's Nikkei edged lower as the yen hit a fresh 38-year low against the dollar, raising fears of potential market intervention. Key events to watch include the Samsung Galaxy launch, AMD's AI event, and a slew of major tech earnings from Alphabet, Tesla, and IBM after the close on Wednesday, followed by the ECB meeting and Intel's earnings on Thursday.

marsbit8 saat önce

BIT Trading Moment: BTC Still Suppressed by Weekly 200 EMA, Rejection May Restart Decline; Storage and Semiconductors that Surged Last Night Begin Falling in Evening Trading

marsbit8 saat önce

Former CFTC Chairman, Circle President Tarbert: Preaching Long-Termism While Cashing Out $30 Million Himself

Former CFTC Chairman and Circle President Heath Tarbert has consistently advocated for a long-term vision in public, urging patience from investors as Circle’s stock price has fallen significantly from its peak. However, it has been revealed that since Circle’s IPO, Tarbert has continuously sold his CRCL shares through pre-arranged trading plans, cashing out approximately $30 million, without making any public market purchases. This contrast between his public messaging and personal actions has drawn criticism. Tarbert joined Circle in July 2023 as Chief Legal Officer, leveraging his regulatory experience to help guide the company through its IPO and expansion. Despite promoting stablecoins as long-term infrastructure, he established a 10b5-1 trading plan just before Circle went public, leading to substantial stock sales over the following year. In March 2026, he initiated another plan to sell more shares. His career trajectory highlights a pattern of moving between high-level regulatory roles and influential positions in the financial sector. After resigning as CFTC Chairman in early 2021, he joined Citadel Securities as Chief Legal Officer just 27 days later, during a period of intense regulatory scrutiny for the firm. He later joined Circle, aiding its efforts to navigate regulatory challenges for its public listing. While Tarbert's expertise in policy and compliance is valuable to companies like Circle, his actions—advocating long-term confidence while personally divesting—raise questions about the alignment between his public statements and his private financial decisions, leaving investors who followed his advice to bear the market risks.

marsbit9 saat önce

Former CFTC Chairman, Circle President Tarbert: Preaching Long-Termism While Cashing Out $30 Million Himself

marsbit9 saat önce

Gate Research Institute: The 'Wall Street-ization' Wave of Crypto Financial Products – Competition or Integration?

The article titled "Gate Research Institute: Are Crypto Financial Products Sparking a 'Wall Street' Wave—Competition or Convergence?" explores the evolving relationship between the crypto ecosystem and traditional finance (TradFi). The piece begins by reflecting on Bitcoin's original 2009 vision of decentralization, disintermediation, and moving away from banks. It then contrasts this with the 2024 landscape, where key crypto assets like Bitcoin are increasingly held through Wall Street products like ETFs issued by giants like BlackRock. The article questions whether this signifies that TradFi is systematically taking over the rights to issue, price, custody, and distribute crypto financial assets. The core argument is that this is not a zero-sum takeover but rather a bidirectional convergence where each side addresses the other's weaknesses. Crypto offers 24/7 global markets, programmable settlement, and open access but lacks compliant channels, institutional-grade custody, deep fiat liquidity, and mainstream distribution. TradFi possesses these but is constrained by legacy systems, limited operating hours, and slow settlement. Two primary convergence paths are highlighted: * **Path A (CEX to TradFi):** Exemplified by Gate, which has progressed from offering tokenized stocks and CFDs to providing direct, real stock trading (US, Hong Kong, South Korea) within its platform, using USDT. * **Path B (TradFi to Crypto):** Exemplified by Robinhood, which has integrated crypto trading, acquired exchanges like Bitstamp, and is moving traditional assets like stocks onto the blockchain via tokenization and its own Layer 2. Both paths are ultimately competing to become the next-generation, unified financial account—a "super account" where users can seamlessly trade cryptocurrencies, stocks, ETFs, RWA (Real World Assets), and tokenized treasury products in one interface. The growth of RWA and tokenized treasuries (e.g., BlackRock's BUIDL) is presented as the asset-layer fusion, providing stable, yield-bearing assets on-chain and acting as a bridge between the two worlds. In conclusion, the "Wall Street-ization" of crypto is framed as a mutual transformation. Decentralized ideals persist in the protocol layer, while at the application layer, a more efficient, global, and accessible unified capital market is emerging from this convergence. The future competition lies not between crypto exchanges and stockbrokers, but between platforms vying to offer the most comprehensive asset coverage, liquidity, and user experience within a single account.

marsbit9 saat önce

Gate Research Institute: The 'Wall Street-ization' Wave of Crypto Financial Products – Competition or Integration?

marsbit9 saat önce

İşlemler

Spot

Popüler Makaleler

WAR Nasıl Satın Alınır

HTX.com’a hoş geldiniz! WAR (WAR) satın alma işlemlerini basit ve kullanışlı bir hâle getirdik. Adım adım açıkladığımız rehberimizi takip ederek kripto yolculuğunuza başlayın. 1. Adım: HTX Hesabınızı OluşturunHTX'te ücretsiz bir hesap açmak için e-posta adresinizi veya telefon numaranızı kullanın. Sorunsuzca kaydolun ve tüm özelliklerin kilidini açın. Hesabımı Aç2. Adım: Kripto Satın Al Bölümüne Gidin ve Ödeme Yönteminizi SeçinKredi/Banka Kartı: Visa veya Mastercard'ınızı kullanarak anında WAR (WAR) satın alın.Bakiye: Sorunsuz bir şekilde işlem yapmak için HTX hesap bakiyenizdeki fonları kullanın.Üçüncü Taraflar: Kullanımı kolaylaştırmak için Google Pay ve Apple Pay gibi popüler ödeme yöntemlerini ekledik.P2P: HTX'teki diğer kullanıcılarla doğrudan işlem yapın.Borsa Dışı (OTC): Yatırımcılar için kişiye özel hizmetler ve rekabetçi döviz kurları sunuyoruz.3. Adım: WAR (WAR) Varlıklarınızı SaklayınWAR (WAR) satın aldıktan sonra HTX hesabınızda saklayın. Alternatif olarak, blok zinciri transferi yoluyla başka bir yere gönderebilir veya diğer kripto para birimlerini takas etmek için kullanabilirsiniz.4. Adım: WAR (WAR) Varlıklarınızla İşlem YapınHTX'in spot piyasasında WAR (WAR) ile kolayca işlemler yapın.Hesabınıza erişin, işlem çiftinizi seçin, işlemlerinizi gerçekleştirin ve gerçek zamanlı olarak izleyin. Hem yeni başlayanlar hem de deneyimli yatırımcılar için kullanıcı dostu bir deneyim sunuyoruz.

288 Toplam GörüntülenmeYayınlanma 2024.12.11Güncellenme 2026.06.02

WAR Nasıl Satın Alınır

Tartışmalar

HTX Topluluğuna hoş geldiniz. Burada, en son platform gelişmeleri hakkında bilgi sahibi olabilir ve profesyonel piyasa görüşlerine erişebilirsiniz. Kullanıcıların WAR (WAR) fiyatı hakkındaki görüşleri aşağıda sunulmaktadır.

活动图片












