Ethereum (ETH) May See Triple-Digit Gains, ETF Inflows Become a Catalyst
Inflows into spot Ethereum ETFs have resumed, while trading volume demand has improved. Will the Ethereum futures market follow this trend and initiate a round of upward movement towards new historical highs?

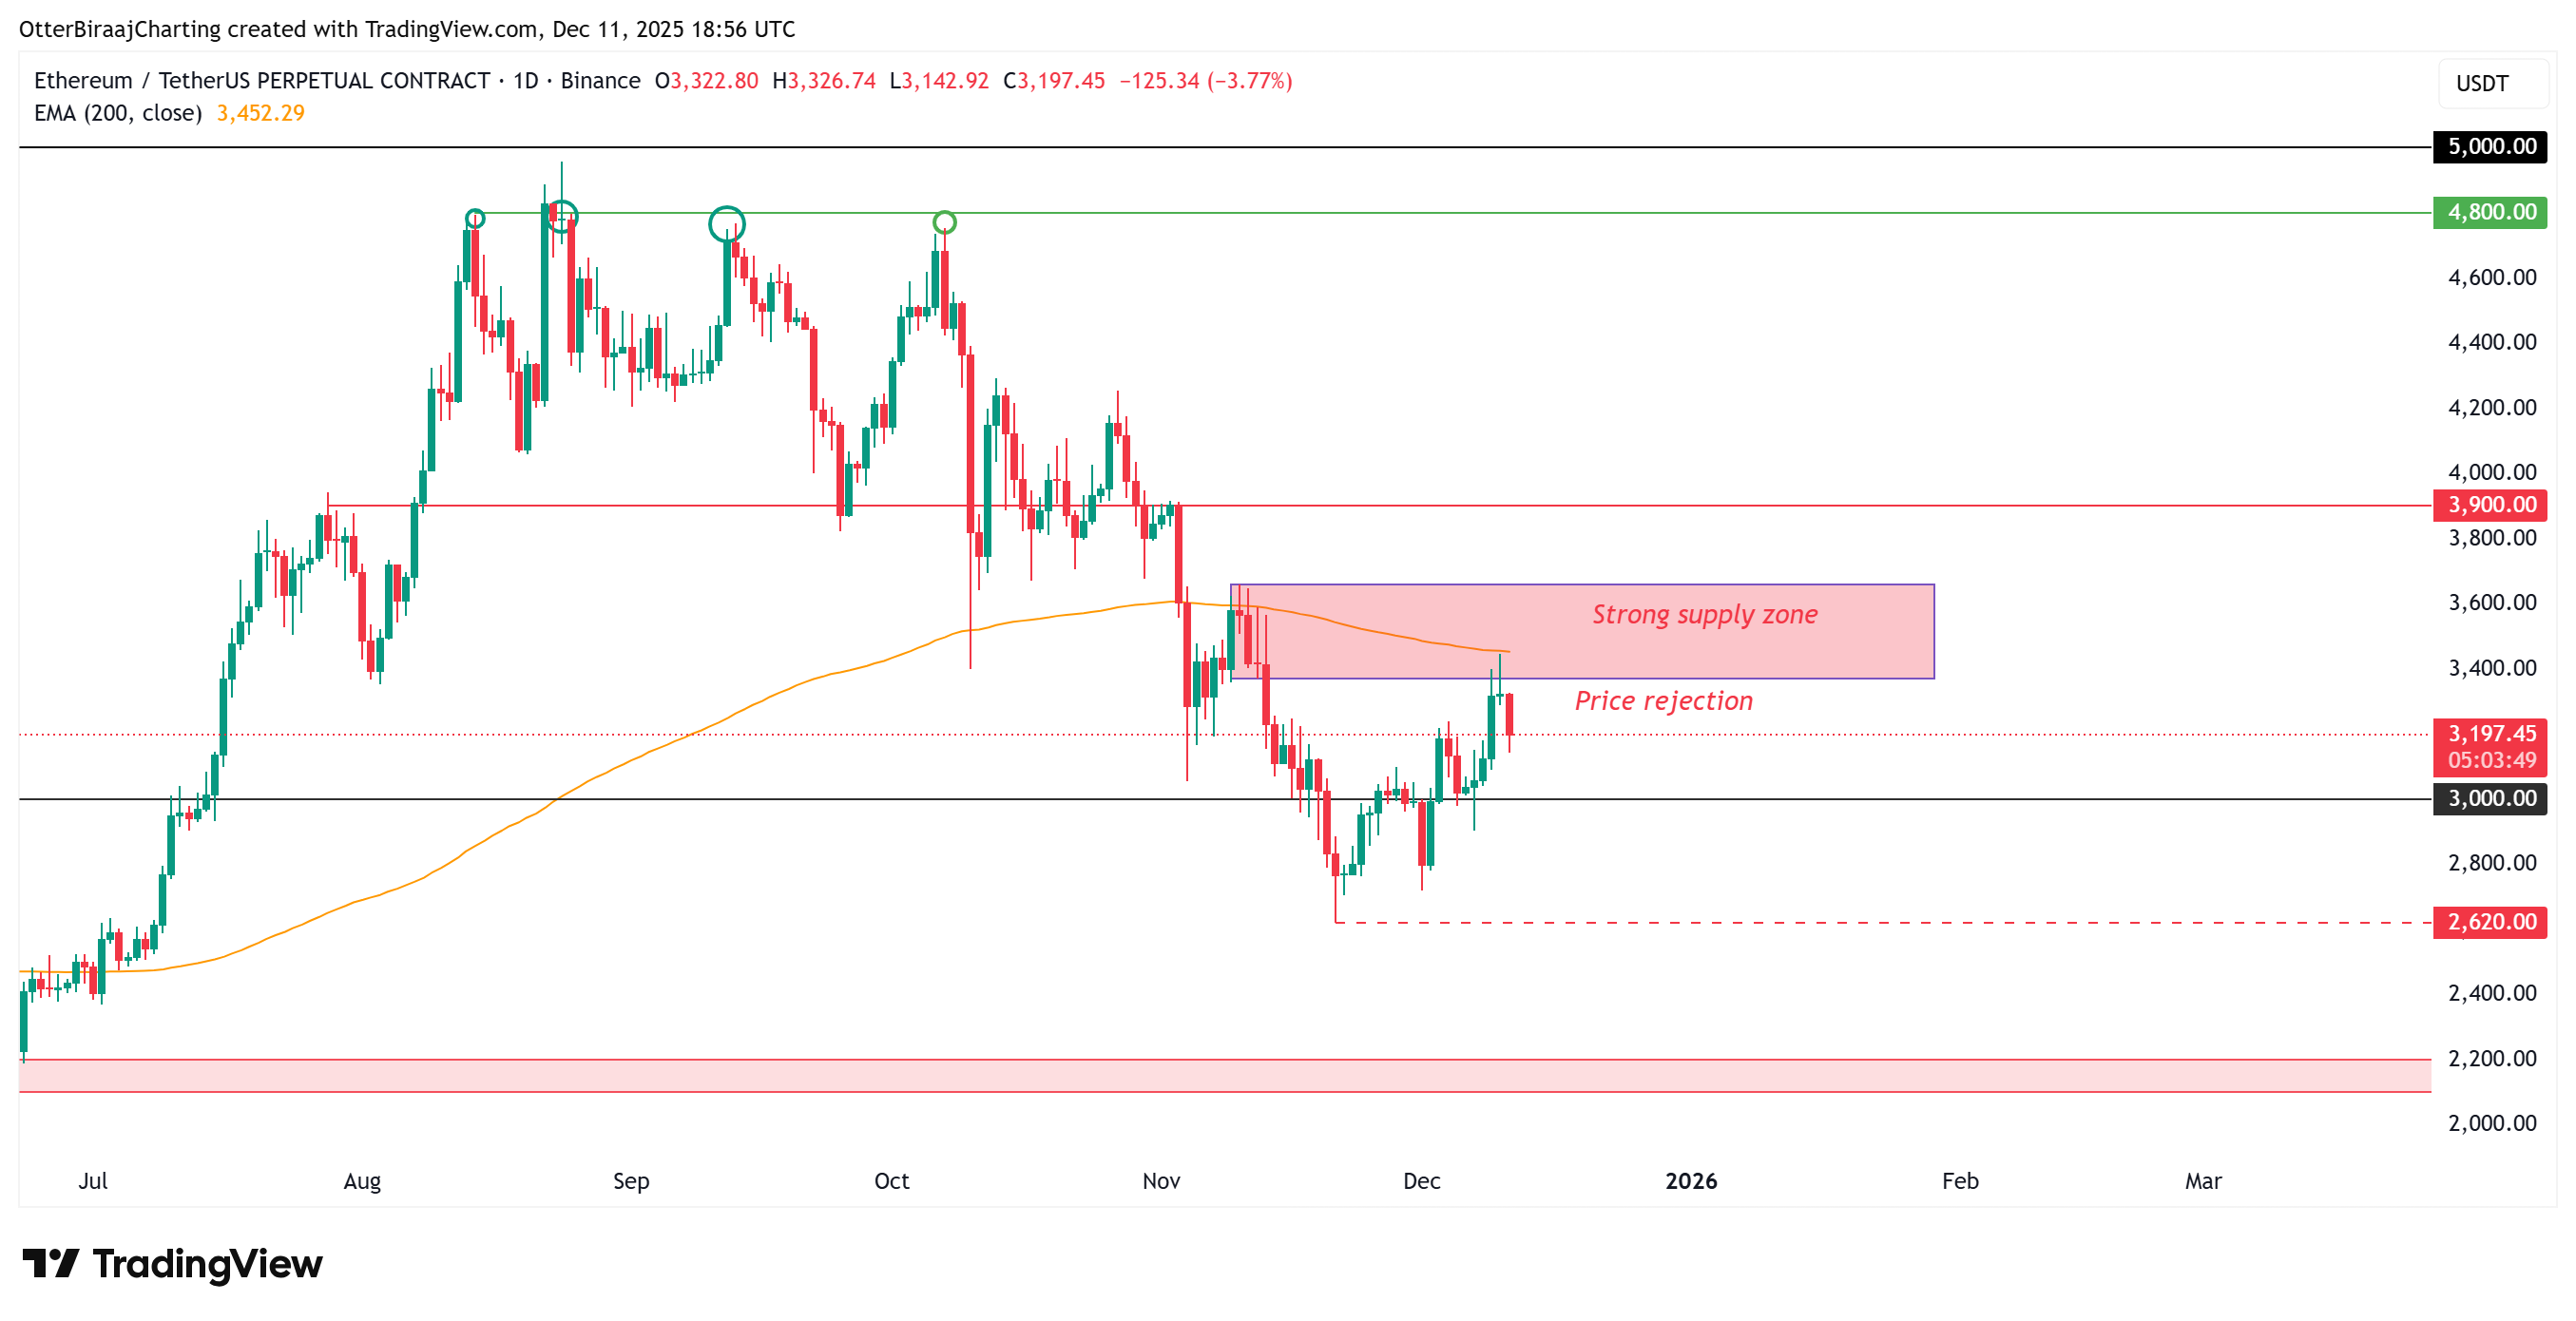
Ethereum (ETH) prices cooled this week after encountering strong selling pressure in the $3,650 to $3,350 supply zone, currently hovering near $3,200. This pullback coincided with technical resonance on the 200-day Exponential Moving Average (EMA), reinforcing resistance pressure from above—this occurred just as spot exchange-traded fund (ETF) inflows began to show signs of recovery, creating a contradictory signal between technicals and capital flows.
Key Points:
Since November 21, the assets under management of spot Ethereum ETFs have increased from $16.8 billion to $21.5 billion, a 28% rise.
Net active trading volume has risen simultaneously, indicating that aggressive selling pressure is weakening, while active buying is gradually returning to the market.
ETF Inflows Resume, But ETH Price Chart Reflects Trader Fear.
According to Glassnode data, spot Ethereum ETFs have finally shown "initial signs of recovery" after weeks of capital outflows. Since November 21, total ETF net assets have rebounded by 28%, suggesting year-end demand is gradually improving.
However, compared to the peak value of $32 billion in early October, the current rebound remains moderate, indicating that institutional investor confidence has not fully recovered.
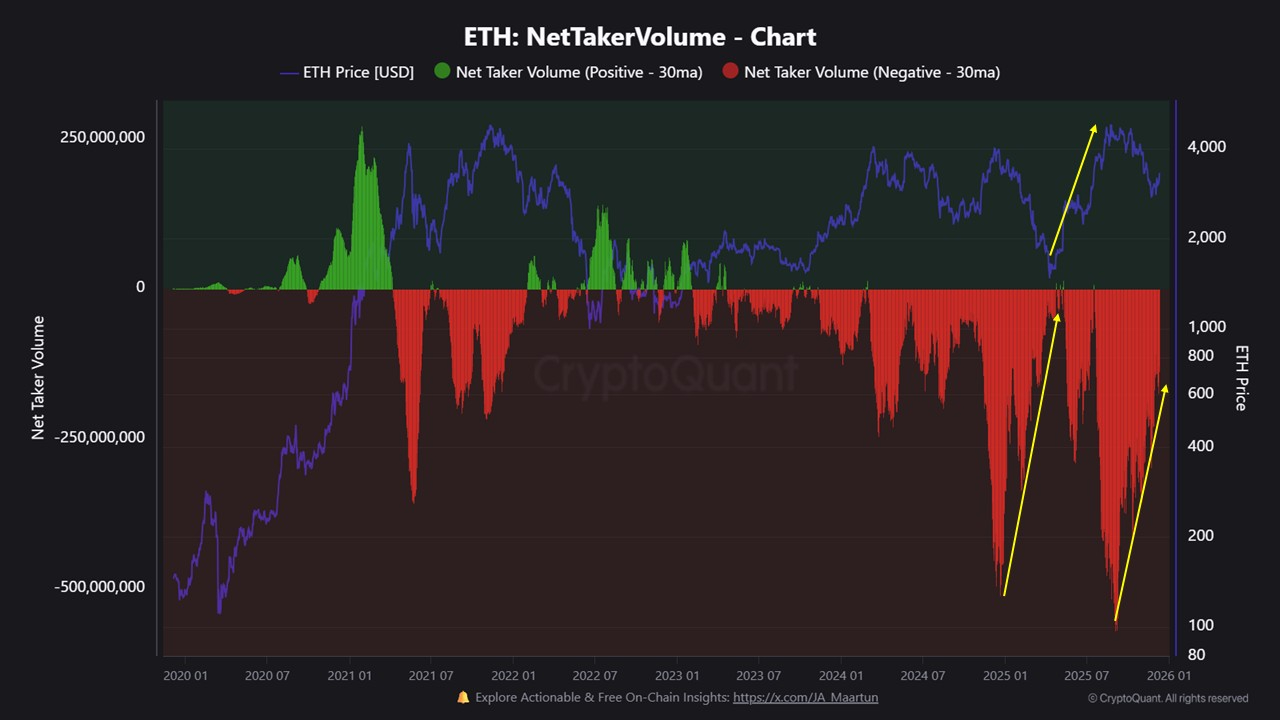
Data from CryptoQuant reinforces this judgment. Net active trading volume remains negative at -$138 million, but it has significantly improved from the extreme level of -$500 million in October, marking a shift in market structure. During the decline from September to October, aggressive sellers dominated the market, but this dynamic is gradually fading.
The 30-day moving average of net active trading volume is also showing an upward trend. This market structure last appeared in early 2025—just before Ethereum initiated a 3x rally and set a new historical high.
If the current trend continues and active trading activity turns positive, it could become a key catalyst in the coming weeks to push Ethereum into a new phase of upward breakout.
Ethereum Price Fluctuates Near Support, Altcoin Market Cools
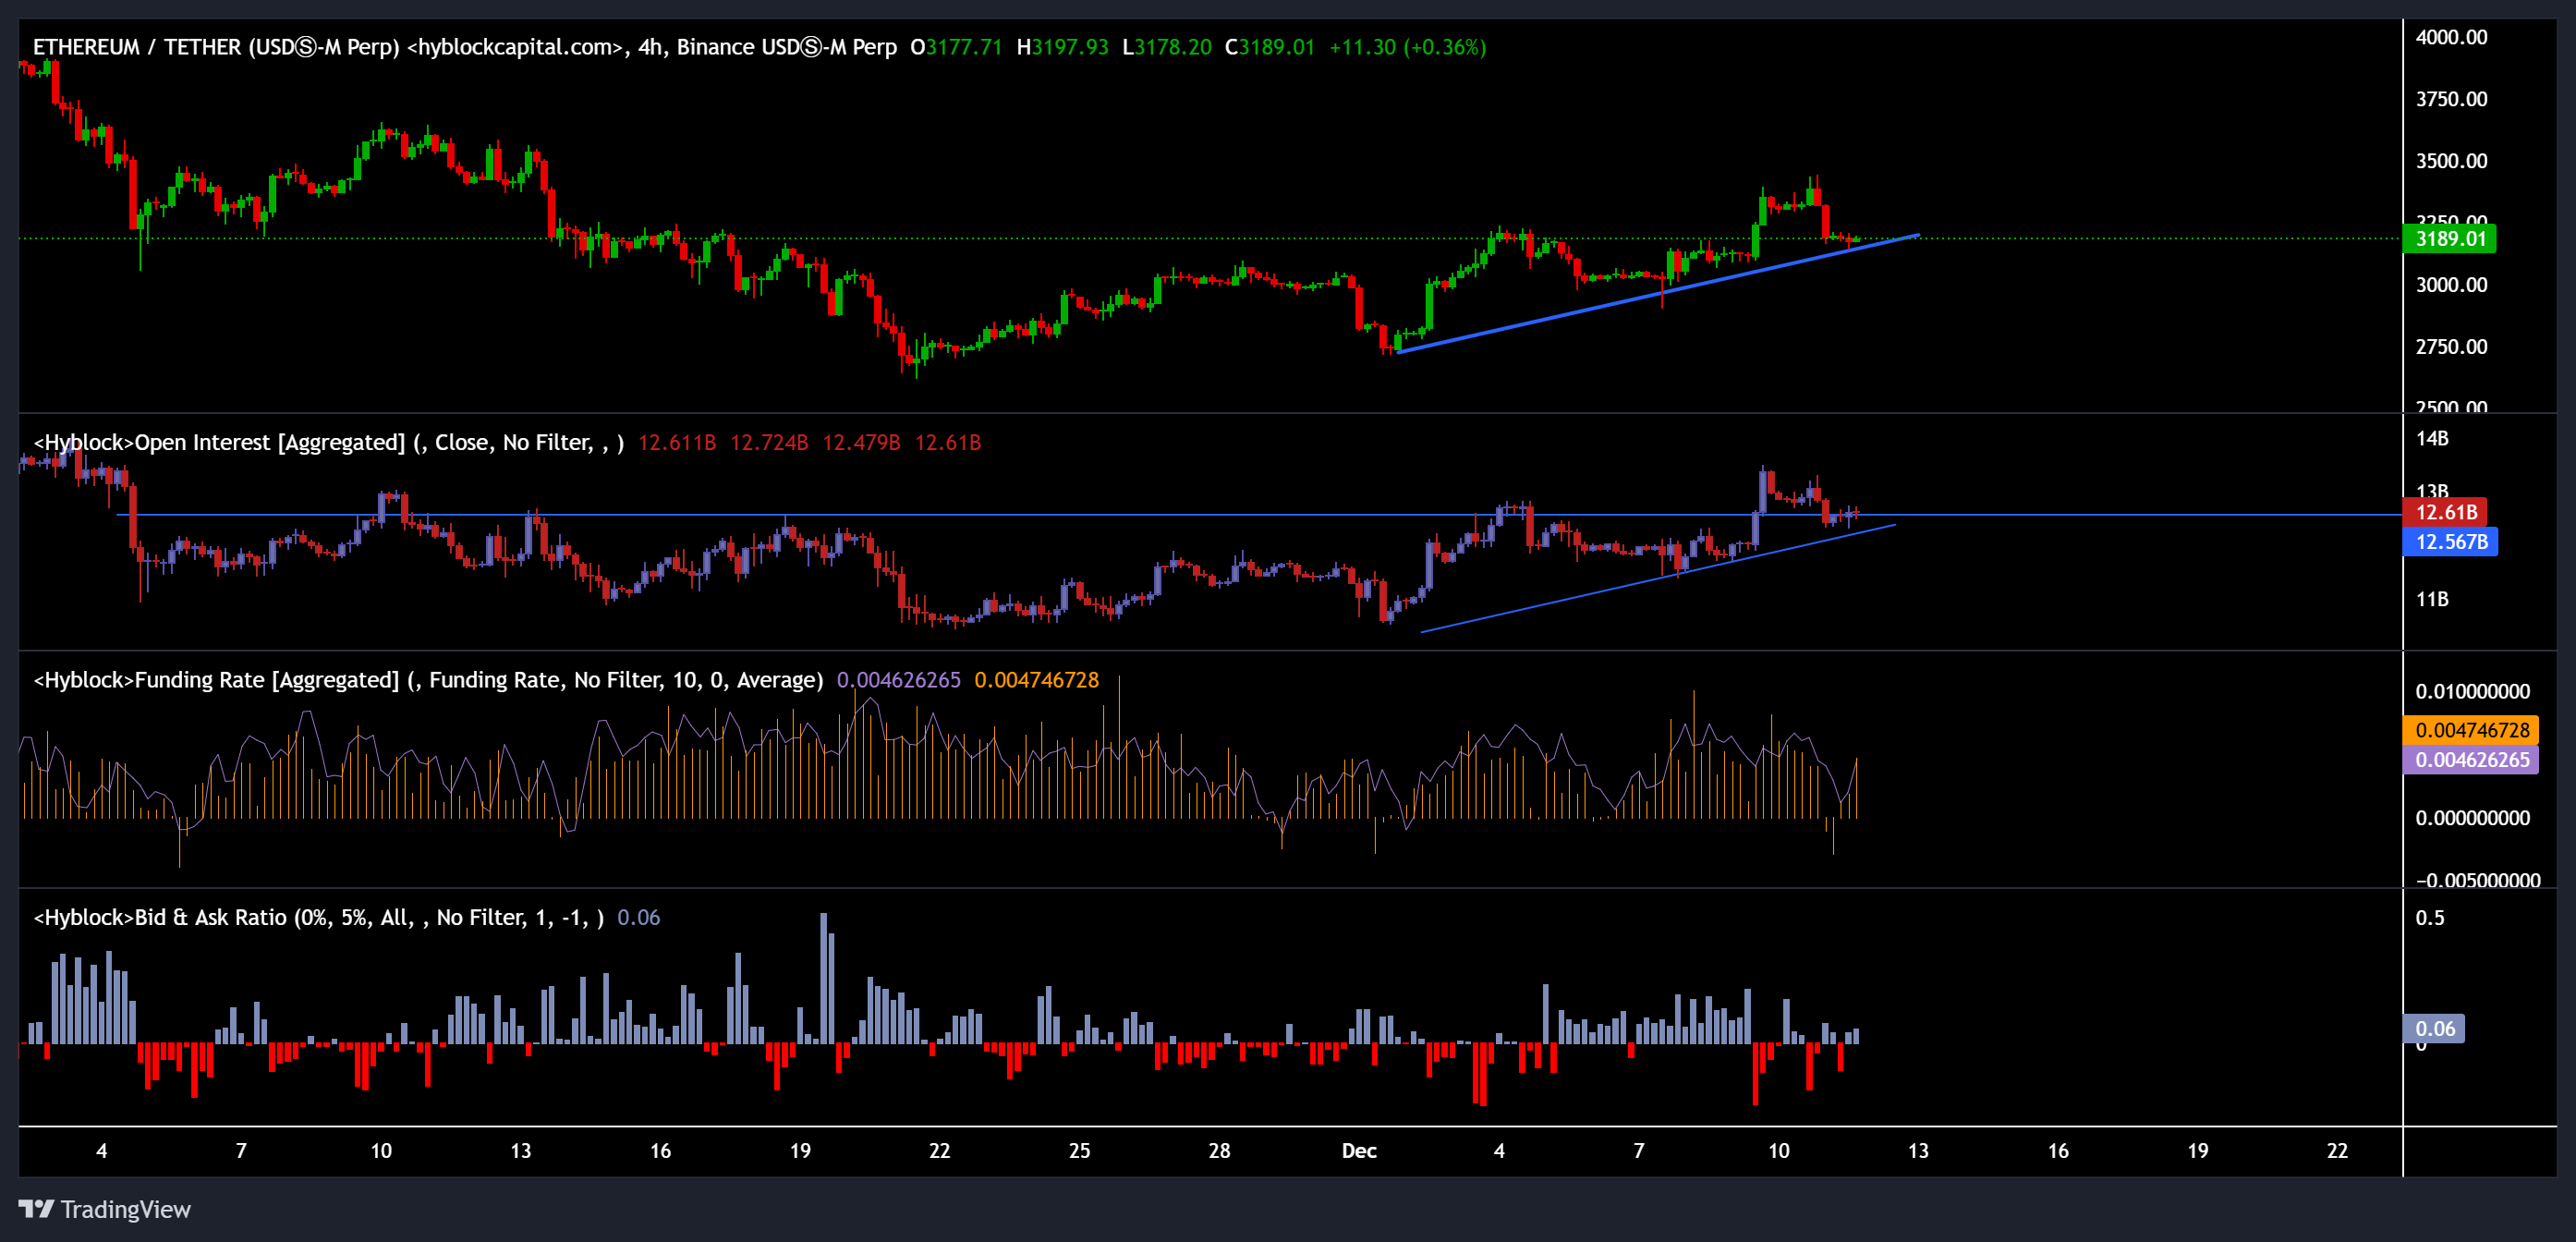
Ethereum is currently testing the $3,100 to $3,180 price range on the 4-hour chart, an area that could form a demand support zone. ETH price remains within the upward channel, but upward momentum has noticeably slowed. The market is at a critical structural inflection point.
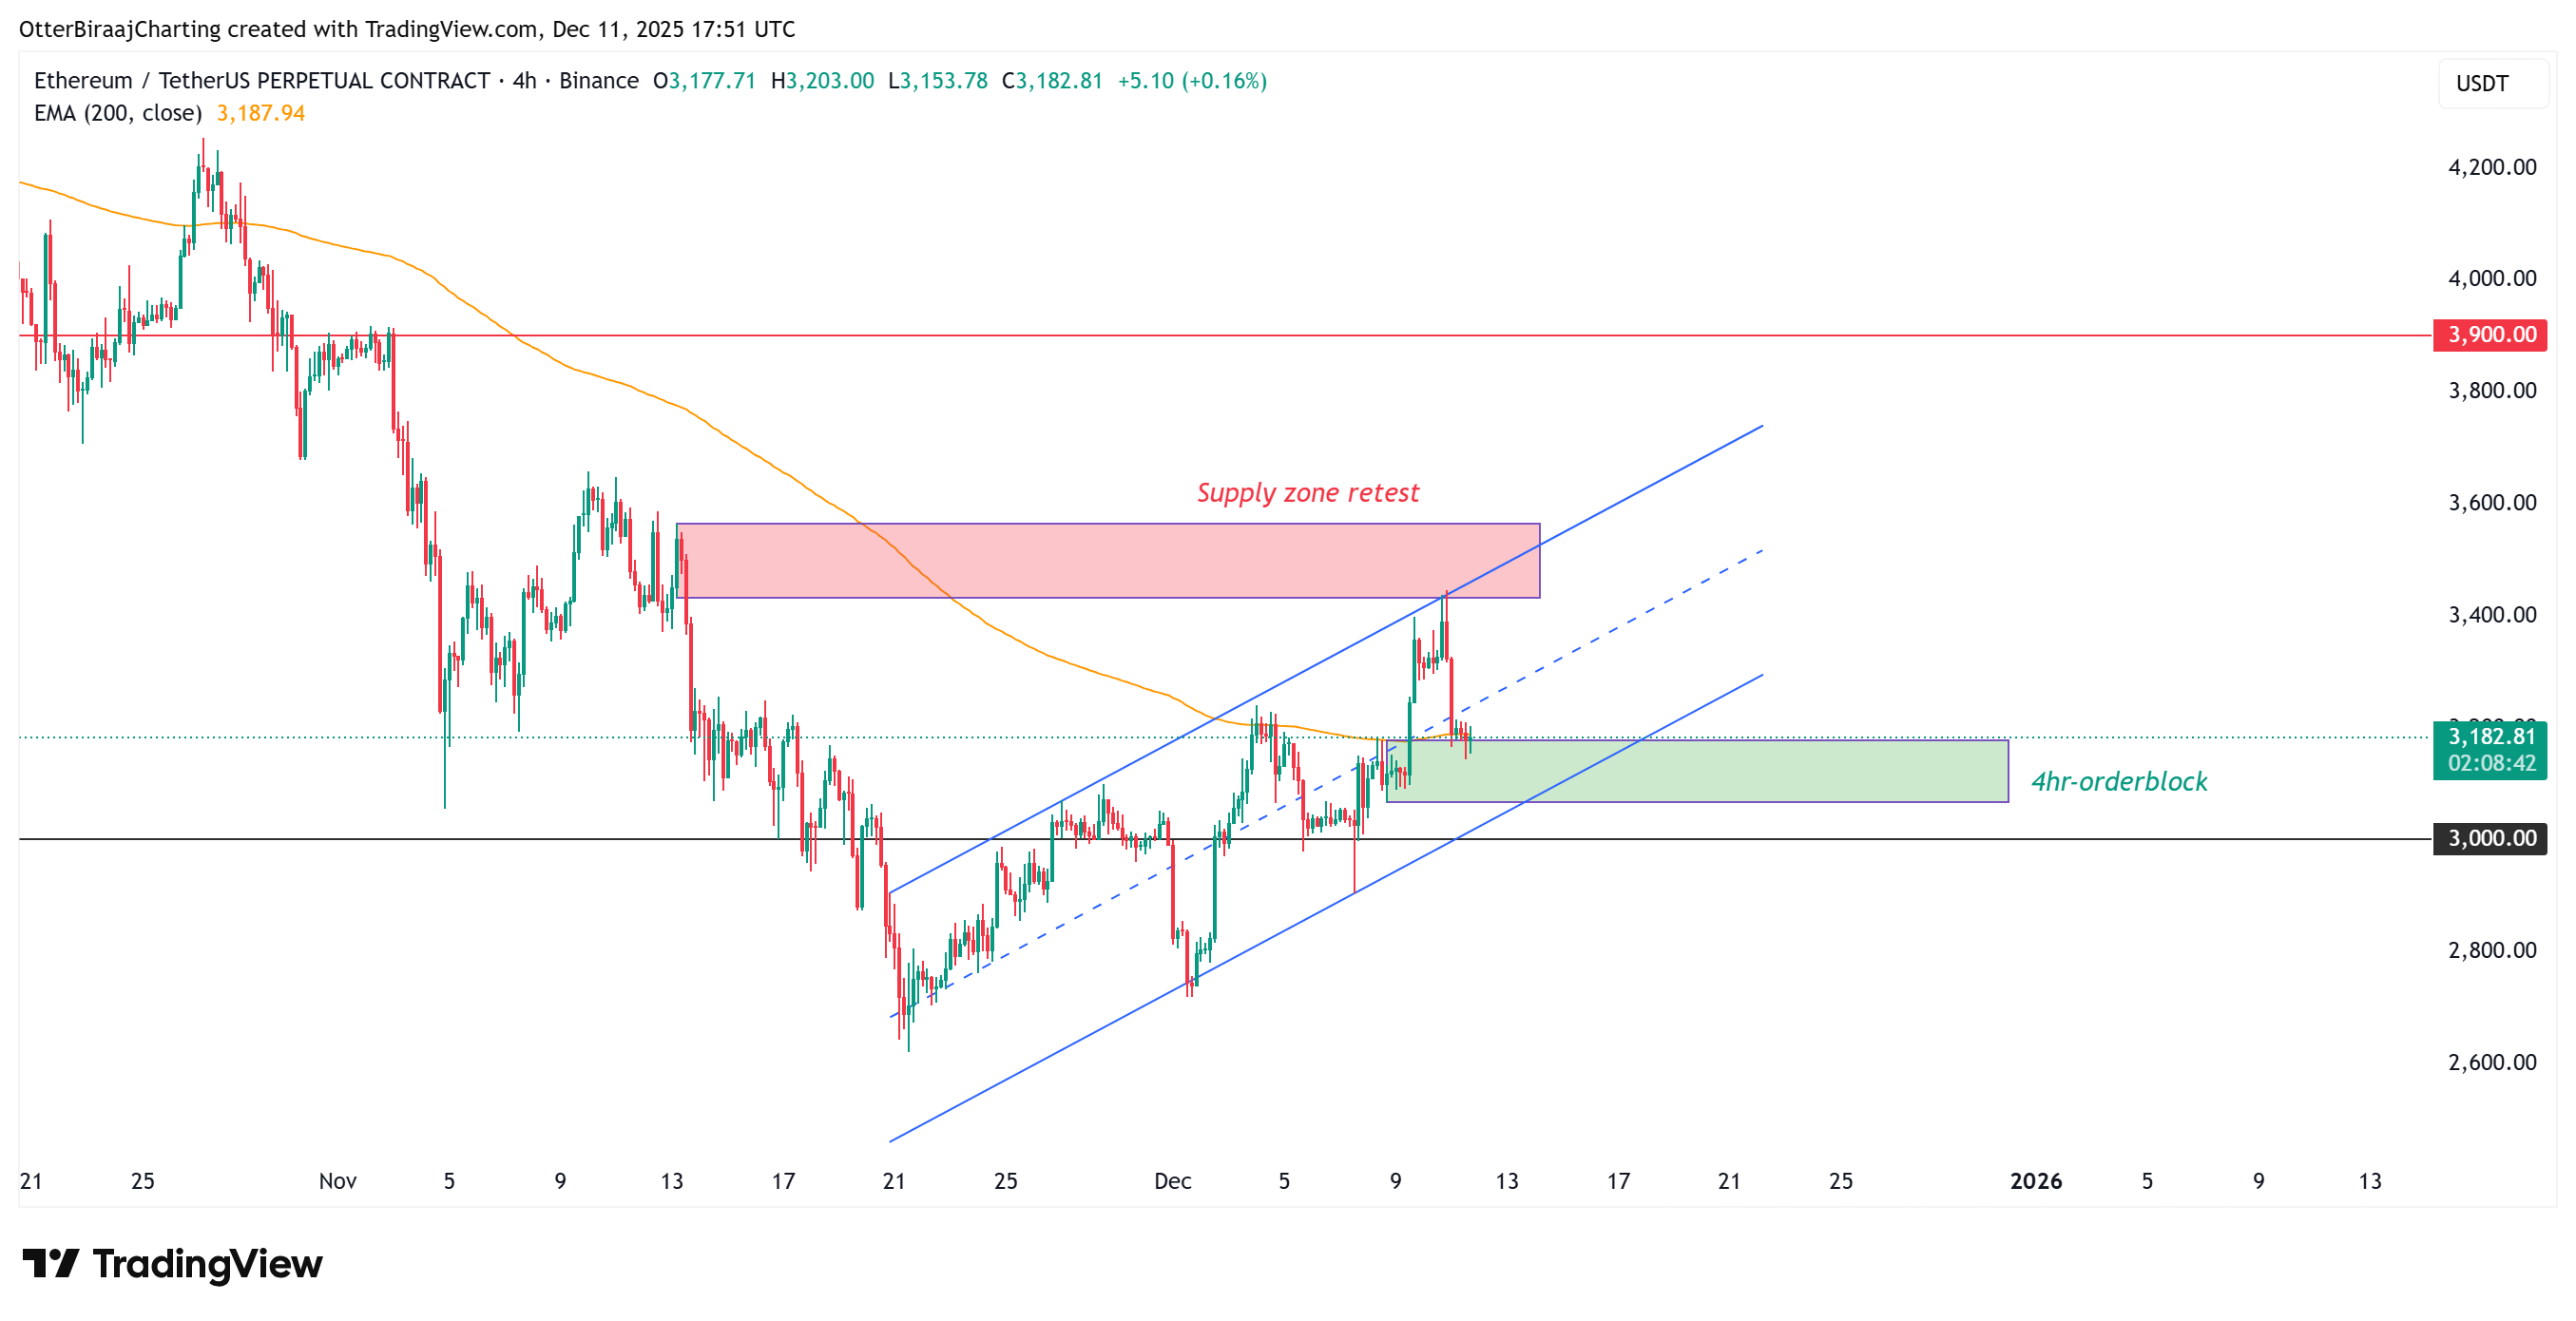
From a bullish perspective, if the demand area and channel support hold, ETH may rebound to test the daily 200-day EMA. A clear break above $3,450 could negate the previous受阻 structure and open a path to rechallenge the $3,900 resistance level.
However, from a bearish observation, a break below the rising channel support would confirm a bearish signal, potentially triggering a retest of the key $3,000 support level.
Hyblock chain data shows that the Ethereum altcoin market现状 supports a "neutral but fragile" judgment. After the price encountered resistance, the total open interest across the market fell slightly. Funding rates are温和 positive but not excessively high, while the buy/sell order ratio remains near neutral levels, indicating that现货 active traders have not yet formed a strong bullish bias.
Ethereum's next key trend will depend on whether the bulls can long-term hold the demand area, allowing the持续 improvement in active trading flow and ETF demand to最终 transform into sustainable upward pressure.
Related Recommendation: Market Predicts Bitcoin (BTC) Will Struggle to Break $100,000 Before Year-End
This article does not contain investment advice or recommendations. Every investment and trading move involves risk, and readers should conduct their own research when making a decision. Although we strive to provide accurate and timely information, Cointelegraph does not guarantee the accuracy, completeness, or reliability of any information in this article. This article may contain forward-looking statements subject to risks and uncertainties. Cointelegraph is not responsible for any losses or damages resulting from reliance on this information.