Ethereum "Cooling Off" to Build Momentum? ETF Funds Quietly Flow Back, Is the Historic Rally Script About to Play Out Again?

marsbit2025-12-12 tarihinde yayınlandı2025-12-12 tarihinde güncellendi

Özet

Ethereum's price has been consolidating near $3,200 after facing resistance between $3,350 and $3,650, a zone reinforced by the 200-day EMA. Despite this, signs of recovery are emerging in spot ETF flows. Since November 21, ETH ETF assets under management have increased by 28%, from $16.8 billion to $21.5 billion, indicating a gradual return of buyer interest. Although net flows remain negative at -$138 million, this marks a significant improvement from October’s -$500 million, suggesting weakening selling pressure. The 30-day moving average of net active buying is also rising, resembling a pattern seen in early 2025 that preceded a major price surge. On the 4-hour chart, ETH is testing a key demand zone between $3,100 and $3,180. A hold above this level could lead to a retest of the 200-day EMA and a breakout toward $3,900. However, a breakdown may trigger a drop toward $3,000. Derivatives data shows neutral sentiment with mild funding rates and open interest, indicating cautious optimism. The key for Ethereum’s next major move depends on sustained defense at current support levels, coupled with growing ETF inflows and active buying momentum.

Ethereum's price action has flattened this week, encountering significant resistance in the supply zone between $3,650 and $3,350. The token is currently consolidating near $3,200. This resistance level roughly coincides with the 200-day Exponential Moving Average (EMA), further reinforcing the overhead pressure in this area. Notably, just as this is happening, spot Exchange Traded Fund (ETF) flows are beginning to show initial signs of recovery.

Key Points:

  • Since November 21st, the Assets Under Management (AUM) for spot Ethereum ETFs have increased from $16.8 billion to $21.5 billion, a gain of 28%.
  • Net active buying volume is showing an upward trend, indicating that the previously strong selling pressure is weakening, while buying power is gradually returning.
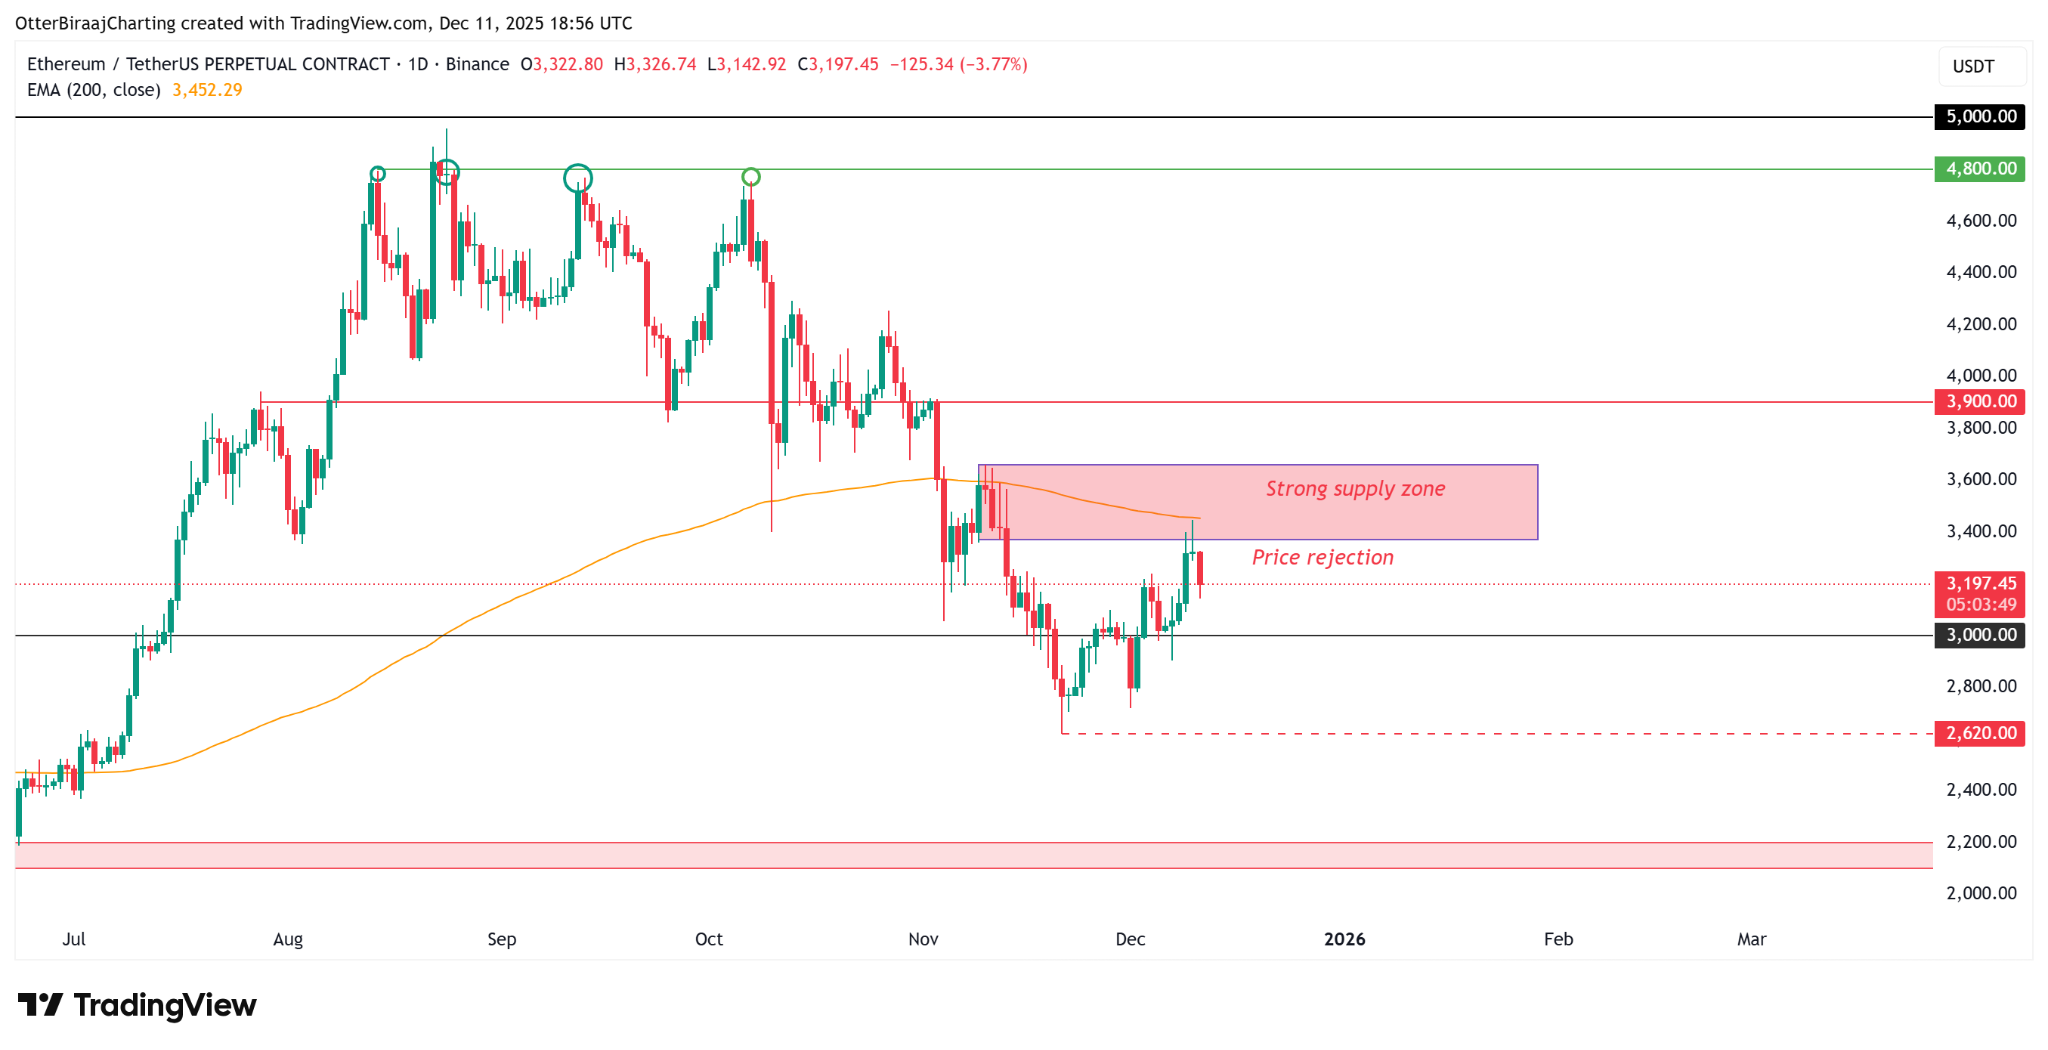
Ethereum Daily Chart. Source: TradingView


ETF Inflows Resume, But Charts Reflect Lingering Investor Caution

According to data from Glassnode, after weeks of consecutive outflows, spot ETH ETFs are finally showing initial "signs of recovery." Since November 21st, ETF net asset values have rebounded by 28%, suggesting potential improvement in market demand before year-end. However, compared to the peak of $32 billion in early October, the magnitude of this rebound remains modest, indicating that institutional confidence has not yet fully recovered.
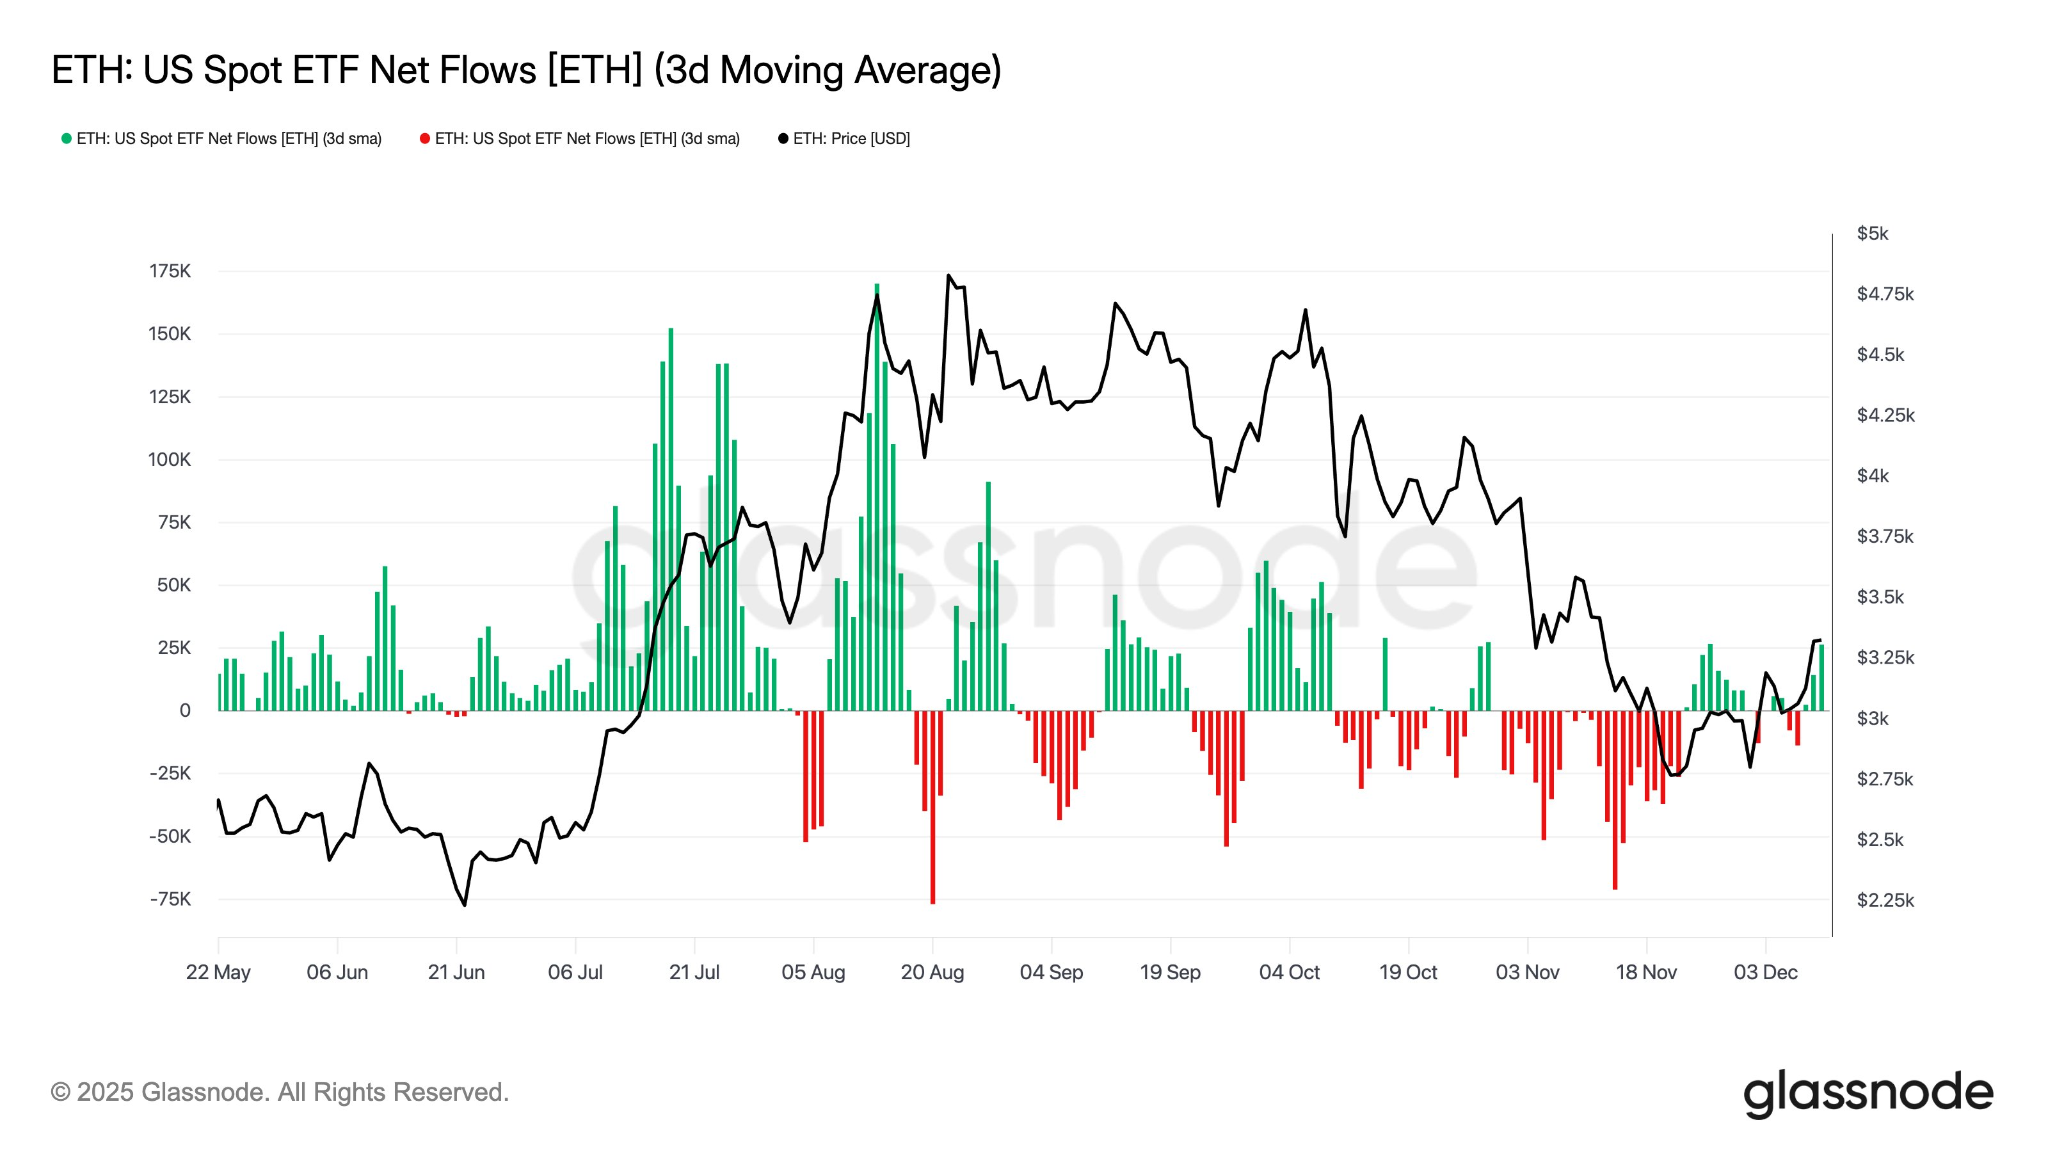
Spot ETH ETF Net Flow. Source: Glassnode

Data from CryptoQuant further supports this assessment. Although the net flow remains negative (-$138 million), it has improved significantly from the -$500 million seen in October, marking a structural shift. During the correction phase from September to October, the market was dominated by active selling, but this trend is gradually subsiding.

The 30-day moving average of net active buying volume is also showing a pattern of rising lows. A similar structure appeared in early 2025, after which the Ethereum price achieved a nearly 3-fold increase and reached a new all-time high.

If the current trend continues, this positive shift in active buying activity could become a key catalyst driving Ethereum to break out upward again in the coming weeks.
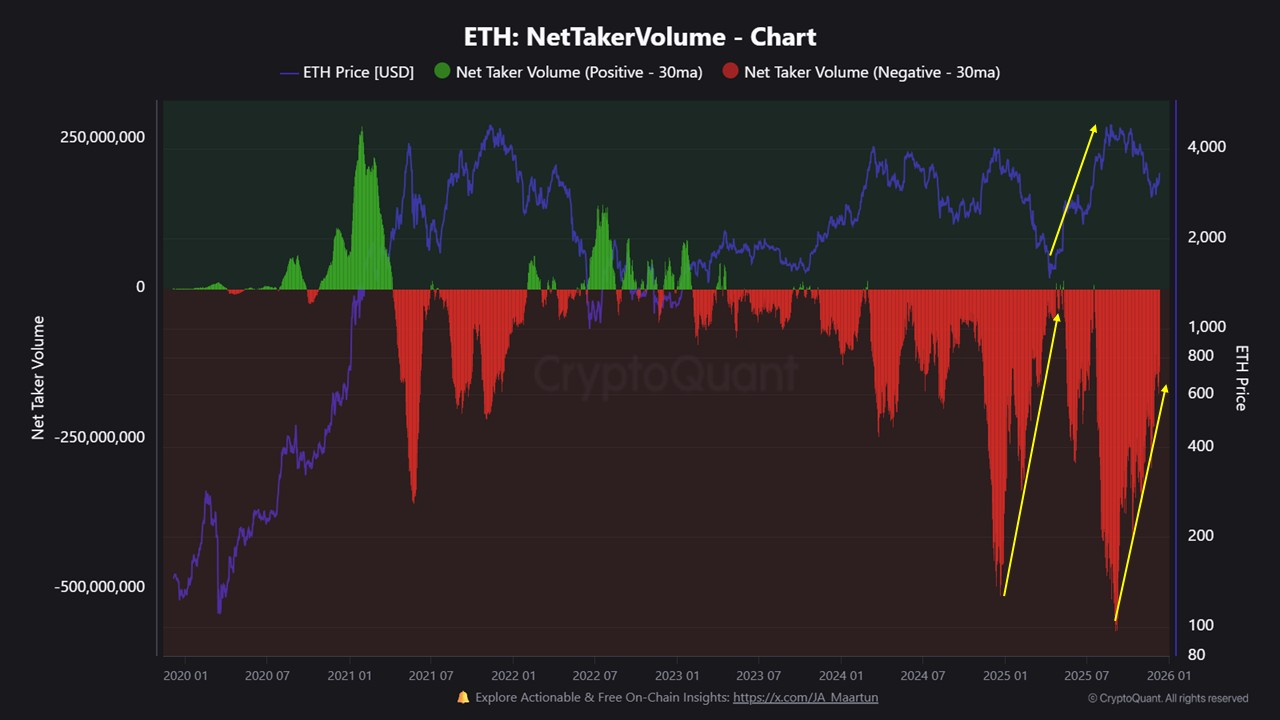

Ethereum On-Chain Flow Data. Source: CryptoQuant


ETH Price Consolidates in Support Zone, Derivatives Market Cools Off

The current Ethereum price is testing the order block density zone between $3,100 and $3,180 on the 4-hour chart, an area that could transform into near-term demand support. Although the ETH price remains within an ascending channel, the upward momentum has noticeably weakened. The market is in a structural decision-making phase regarding its direction.
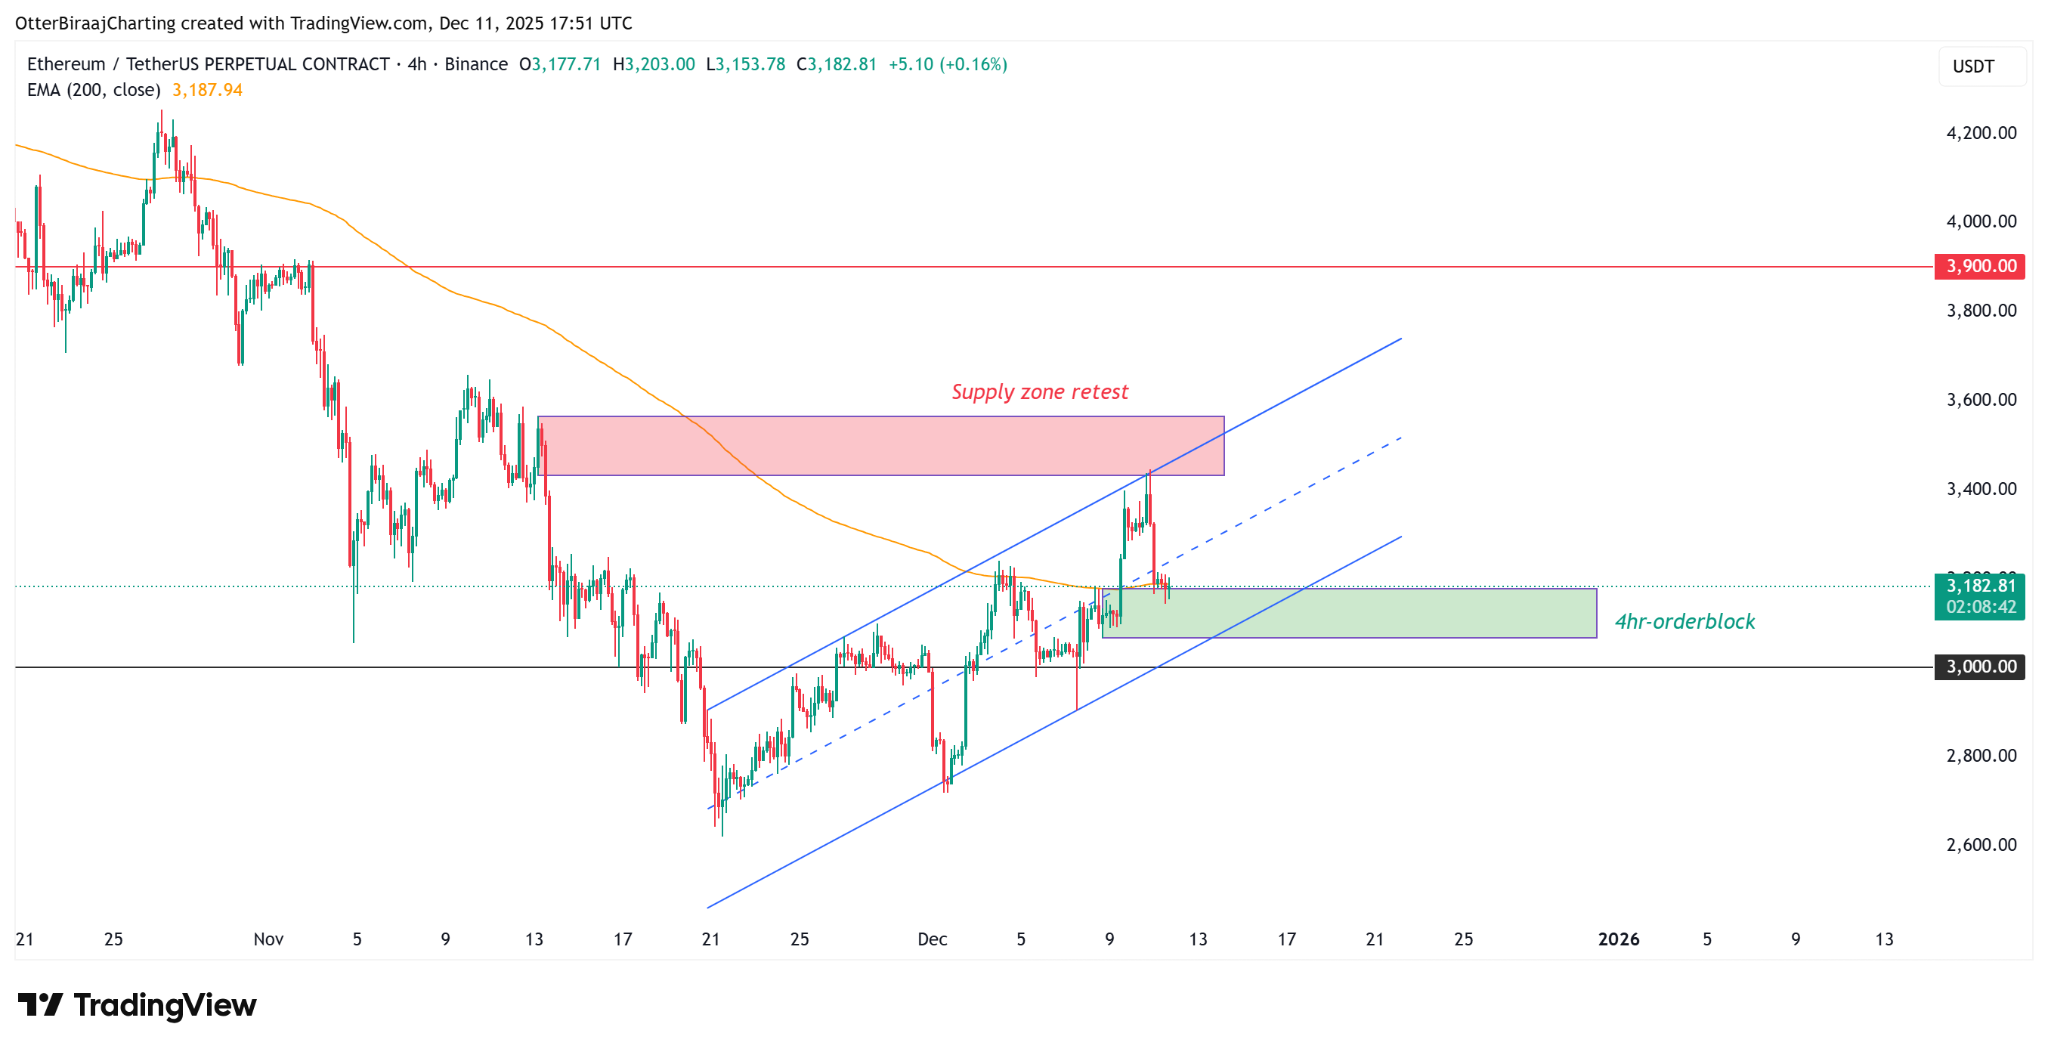

4-Hour Price Chart. Source: TradingView

From a bullish perspective, if the price can hold above this demand zone and the channel support, ETH could potentially attack the daily 200-day EMA again. A clear break above $3,450 would invalidate the previously formed resistance and open the path for the price to test the $3,900 resistance level.

From a bearish viewpoint, a break below the lower trendline of the current ascending channel would constitute a bearish signal, potentially leading the price to test the key $3,000 support level.

Data from Hyblock shows the Ethereum derivatives market presents a neutral yet fragile landscape. After the price met resistance, the Total Open Interest (OI) slightly declined. Funding rates are positive but not significantly high, and the buy-sell ratio is also near neutral, indicating that spot investors have not yet formed a consensus bullish expectation.
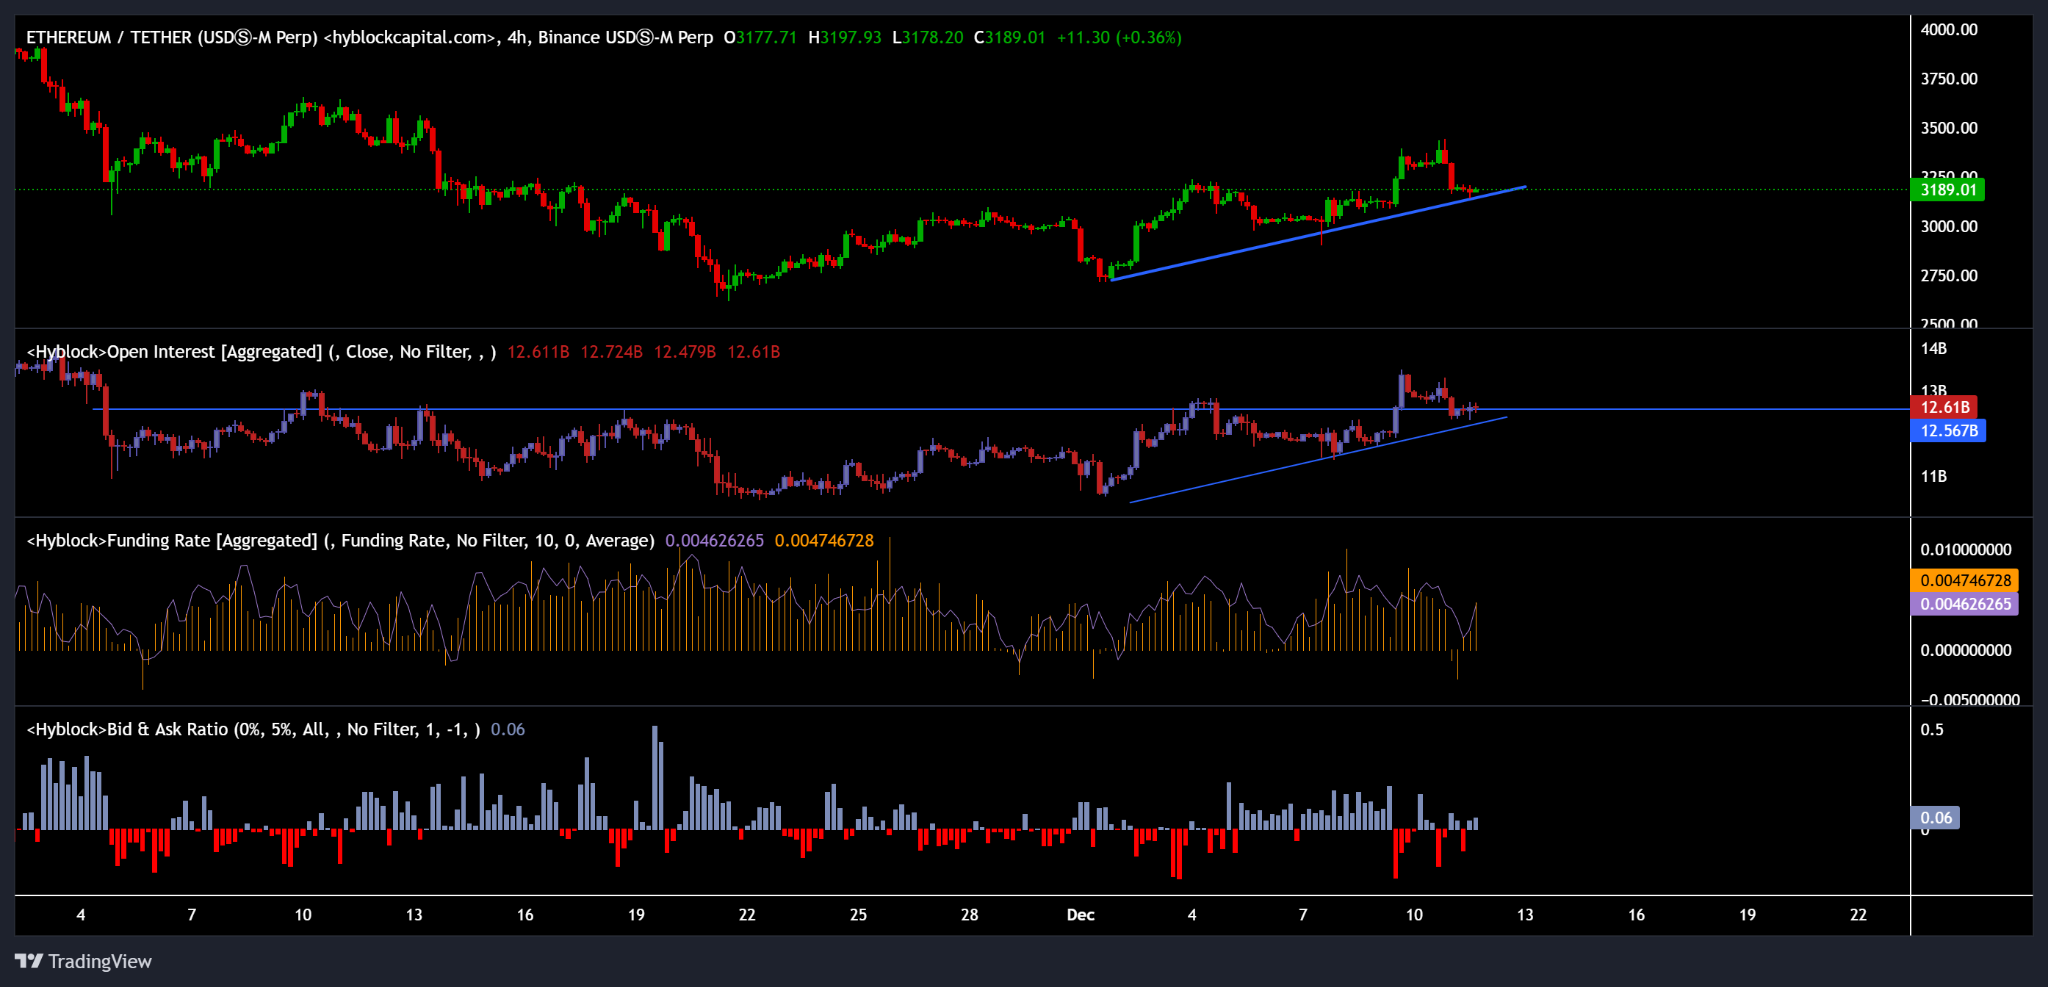
Ethereum Futures Market Data. Source: Hyblock Capital

Summary: The key to Ethereum's subsequent price action lies in whether the bulls can sustain their defense in the demand support area, thereby catalyzing a virtuous cycle between active buying flows and ETF demand, ultimately translating into sustained upward momentum.


Trend Kriptolar

İlgili Sorular

QWhat is the current price range where Ethereum is consolidating, and what key resistance level is it facing?

AEthereum is currently consolidating around $3200, facing significant resistance in the $3650 to $3350 supply zone, which aligns with the 200-day Exponential Moving Average (EMA).

QHow much has the assets under management (AUM) for spot Ethereum ETFs increased since November 21, and what does this indicate?

ASince November 21, the AUM for spot Ethereum ETFs has increased by 28%, from $16.8 billion to $21.5 billion, indicating a potential recovery in market demand and a shift from strong selling pressure to returning buyer interest.

QWhat key on-chain metric from CryptoQuant shows a structural shift in market dynamics, and how has it improved?

AThe net flow metric, while still negative at -$138 million, has improved significantly from -$500 million in October, indicating a structural shift where the previously dominant active selling pressure is diminishing.

QWhat is the critical support zone on the 4-hour chart that Ethereum is testing, and what are the potential price targets for a bullish breakout?

AEthereum is testing the order block support zone between $3100 and $3180 on the 4-hour chart. A bullish breakout above the 200-day EMA and a clear break above $3450 could open the path for a move towards the $3900 resistance level.

QWhat does the data from Hyblock Capital indicate about the current sentiment in the Ethereum derivatives market?

AHyblock Capital data shows a neutral but fragile sentiment in the derivatives market. Open Interest (OI) has slightly decreased, funding rates are positive but not excessively high, and the buy-sell ratio is near neutral, indicating that spot investors have not yet formed a strong, unified bullish consensus.

İlgili Okumalar

7 Months After the Collapse of Huiwang, Southeast Asia's Escrow Platforms Undergo a Major Reshuffle

Following the collapse of Huione Pay—dubbed the "Alipay of Southeast Asia"—seven months ago, the region's underground financial guarantee platform sector is undergoing a significant reshuffle. This power vacuum has been swiftly filled by emerging platforms such as XinBi, Tiger/Navigator, JinBei (renamed JinBo), Dali/Tiancheng, and FullyLight. These platforms, operating largely via Telegram and offering services like escrow for illicit transactions, have absorbed the vast user base and markets left behind by Huione. While positioning themselves as "trust intermediaries," their primary clientele consists of networks involved in online scams, money laundering, illegal gambling, and even human trafficking. For instance, the Tiger/Navigator platform explicitly provides "escrow" services for kidnapping-for-ransom operations ("强押车交易"). Data underscores the immense scale: Huione alone processed over $103 billion in cryptocurrency payments and facilitated over $31 billion through its escrow market before its downfall, linking it to Cambodia's notorious Prince Group. Since its collapse, competitors have seen explosive growth. For example, the XinBi platform has accumulated over $1.6 billion in total USDT revenue, while platforms like NewPay, OkPay (under Dali), and FullyLight Wallet collectively processed over $4.8 billion in USDT in a single year. This ecosystem thrives in regions like Cambodia and Myanmar, where regulatory gaps allow these platforms to act as critical financial infrastructure for sprawling cybercrime industries, from scam compounds to online casinos. The article concludes that the moniker "Southeast Asian Alipay" is a misnomer, obscuring the platforms' fundamental role in enabling serious criminal enterprises rather than representing legitimate financial innovation.

Odaily星球日报39 dk önce

7 Months After the Collapse of Huiwang, Southeast Asia's Escrow Platforms Undergo a Major Reshuffle

Odaily星球日报39 dk önce

The Changing Landscape: What Are Crypto VCs Experiencing?

Title: The Shifting Landscape of Crypto Venture Capital The era of dedicated crypto venture capital funds is undergoing a significant transformation. Once essential for navigating the sector's complexity and high risk, these specialized funds are now facing an identity crisis as the market matures. This shift mirrors historical patterns in other specialized investment classes like cleantech and SPACs, where initial information advantages dissipate as technologies become mainstream and integrated into existing industry frameworks. The article argues that crypto is reaching a critical inflection point, transitioning from a "building phase" to an "integration phase." Major players like Stripe, BlackRock, and Visa now engage with crypto not for its novel mechanics but as a foundational financial infrastructure. Their needs—regulatory compliance, banking partnerships, distribution channels—align with traditional fintech, a domain easily understood by large, generalist funds like Sequoia and Founders Fund. This evolution creates a "barbell effect" within the VC landscape. On one end are massive, diversified platforms that can incorporate crypto as one vertical among many. On the other are small, nimble funds focused on niche, experimental projects. The middle ground—medium-sized dedicated crypto funds—is being squeezed out. Their typical fund size makes it impossible to generate sufficient returns solely from early-stage crypto bets, yet they cannot compete with giants for later-stage deals. Consequently, leading crypto-native firms like Paradigm and Framework Ventures are expanding into AI, robotics, and other sectors, driven partly by LP pressure for better returns amid a broader VC DPI crisis. Others, like Dragonfly and a16z, have narrowed their crypto focus predominantly to financial infrastructure like stablecoins, reframing the sector's core narrative. For crypto entrepreneurs, this consolidation presents challenges. While generalist funds offer larger checks and broader resources, crypto projects now compete fiercely with AI for attention and capital within these firms. Furthermore, the long-term, non-commercial foundational work that built the ecosystem—funded by dedicated crypto VCs—is less likely to attract generalist capital focused on direct returns. The conclusion is that "crypto investor" as a standalone category is becoming obsolete, akin to "internet investor." Crypto is becoming a baseline infrastructure layer. The future will see a barbell structure: large-scale growth financing handled by generalist funds, while pioneering, speculative projects are funded by small, specialized vehicles. The dedicated crypto funds of the 2017-2021 boom, which incubated core infrastructure, are giving way to this new, bifurcated reality.

Foresight News57 dk önce

The Changing Landscape: What Are Crypto VCs Experiencing?

Foresight News57 dk önce

As Consensus Accelerates, What Are Young Investors Betting On?

Title: As Consensus Forms Faster, What Are Young Investors Betting On? In the rapid evolution of tech investment, a new generation of young investors is navigating a landscape where AI, robotics, commercial aerospace, and quantum computing are advancing simultaneously. Traditional investment logic based on financial models is giving way to a need for deep technical understanding and the ability to act before industry consensus forms. An analysis of trends from the "WAIC FUTURE TECH" list of young investment leaders reveals key shifts in focus. The first major trend is the movement of AI from the digital screen into the physical world. Investment is shifting from large language models and chatbots towards embodied AI, robotics, AI hardware, and edge computing. While demonstrations generate excitement, the real challenge lies in achieving scalable, reliable, and cost-effective delivery in complex real-world environments like factories and logistics. Success depends not just on algorithms but on the integration of sensors, actuators, and control systems. Second, the competitive focus for large models is moving beyond raw capability toward building an "intelligence flywheel." The goal is to create self-reinforcing systems where user interaction generates data, improving the model, which in turn enhances the user experience and attracts more engagement. Companies that successfully embed AI into workflows to create these closed-loop systems can build lasting value that isn't easily erased by the next model upgrade. Third, facing a potential bottleneck in high-quality human-generated data, investors are looking at new underlying technologies. Reinforcement learning and self-play, as demonstrated by AlphaGo Zero, offer paths for AI to generate its own experience. Scientific foundation models, which aim to build general AI capabilities for fields like life sciences and materials discovery, represent a non-consensus direction that could unlock new frontiers of knowledge and data. Finally, in deep-tech areas like quantum computing, commercial aerospace, and space-based infrastructure, patient capital is essential. These fields have long, uncertain development and validation cycles involving complex engineering, supply chains, and regulations. Investment here requires a long-term view, focusing on foundational team capabilities and the eventual emergence of market demand, even if commercial returns are distant. Collectively, these trends illustrate how young investors are adapting to a new era. They are learning to make earlier, technically-informed judgments, balance hype with real-world viability, and provide the patient capital needed to build the deep-tech foundations of the future.

marsbit1 saat önce

As Consensus Accelerates, What Are Young Investors Betting On?

marsbit1 saat önce

İşlemler

Spot

Popüler Makaleler

FLOW Nasıl Satın Alınır

HTX.com’a hoş geldiniz! Flow (FLOW) satın alma işlemlerini basit ve kullanışlı bir hâle getirdik. Adım adım açıkladığımız rehberimizi takip ederek kripto yolculuğunuza başlayın. 1. Adım: HTX Hesabınızı OluşturunHTX'te ücretsiz bir hesap açmak için e-posta adresinizi veya telefon numaranızı kullanın. Sorunsuzca kaydolun ve tüm özelliklerin kilidini açın. Hesabımı Aç2. Adım: Kripto Satın Al Bölümüne Gidin ve Ödeme Yönteminizi SeçinKredi/Banka Kartı: Visa veya Mastercard'ınızı kullanarak anında Flow (FLOW) satın alın.Bakiye: Sorunsuz bir şekilde işlem yapmak için HTX hesap bakiyenizdeki fonları kullanın.Üçüncü Taraflar: Kullanımı kolaylaştırmak için Google Pay ve Apple Pay gibi popüler ödeme yöntemlerini ekledik.P2P: HTX'teki diğer kullanıcılarla doğrudan işlem yapın.Borsa Dışı (OTC): Yatırımcılar için kişiye özel hizmetler ve rekabetçi döviz kurları sunuyoruz.3. Adım: Flow (FLOW) Varlıklarınızı SaklayınFlow (FLOW) satın aldıktan sonra HTX hesabınızda saklayın. Alternatif olarak, blok zinciri transferi yoluyla başka bir yere gönderebilir veya diğer kripto para birimlerini takas etmek için kullanabilirsiniz.4. Adım: Flow (FLOW) Varlıklarınızla İşlem YapınHTX'in spot piyasasında Flow (FLOW) ile kolayca işlemler yapın.Hesabınıza erişin, işlem çiftinizi seçin, işlemlerinizi gerçekleştirin ve gerçek zamanlı olarak izleyin. Hem yeni başlayanlar hem de deneyimli yatırımcılar için kullanıcı dostu bir deneyim sunuyoruz.

309 Toplam GörüntülenmeYayınlanma 2024.12.10Güncellenme 2026.06.02

FLOW Nasıl Satın Alınır

Tartışmalar

HTX Topluluğuna hoş geldiniz. Burada, en son platform gelişmeleri hakkında bilgi sahibi olabilir ve profesyonel piyasa görüşlerine erişebilirsiniz. Kullanıcıların FLOW (FLOW) fiyatı hakkındaki görüşleri aşağıda sunulmaktadır.

活动图片