Ethena sees $4 mln whale move as supply tightens – Is ENA’s rebound forming?

ambcrypto2026-03-24 tarihinde yayınlandı2026-03-24 tarihinde güncellendi

Özet

A significant $4.07 million ENA withdrawal from Binance aligns with ongoing exchange outflows and rising buyer activity, indicating a tightening supply structure. Despite this, ENA’s price remains subdued, trading within the $0.089–$0.10 demand zone, which has absorbed selling pressure. The broader structure remains bearish below the $0.262 resistance level. However, Spot Taker data shows increasing buyer dominance, suggesting accumulation is occurring. A liquidation cluster between $0.095–$0.101 presents a near-term liquidity target that could trigger upward momentum if breached. For a sustained rebound, ENA must reclaim $0.262 to shift market structure and target higher resistances.

A $4.07M ENA withdrawal from Binance coincides with persistent exchange outflows and rising buyer activity, reinforcing a tightening supply structure.

This withdrawal aligns with continued negative netflows, showing that tokens are leaving exchanges instead of preparing for sell pressure.

As a result, available supply on trading platforms keeps shrinking. However, Ethena’s [ENA] price has not yet reacted strongly, which suggests that accumulation continues beneath the surface.

This behavior often reflects positioning rather than immediate speculation. As liquidity tightens, even moderate demand could trigger sharper price reactions.

ENA compresses on demand

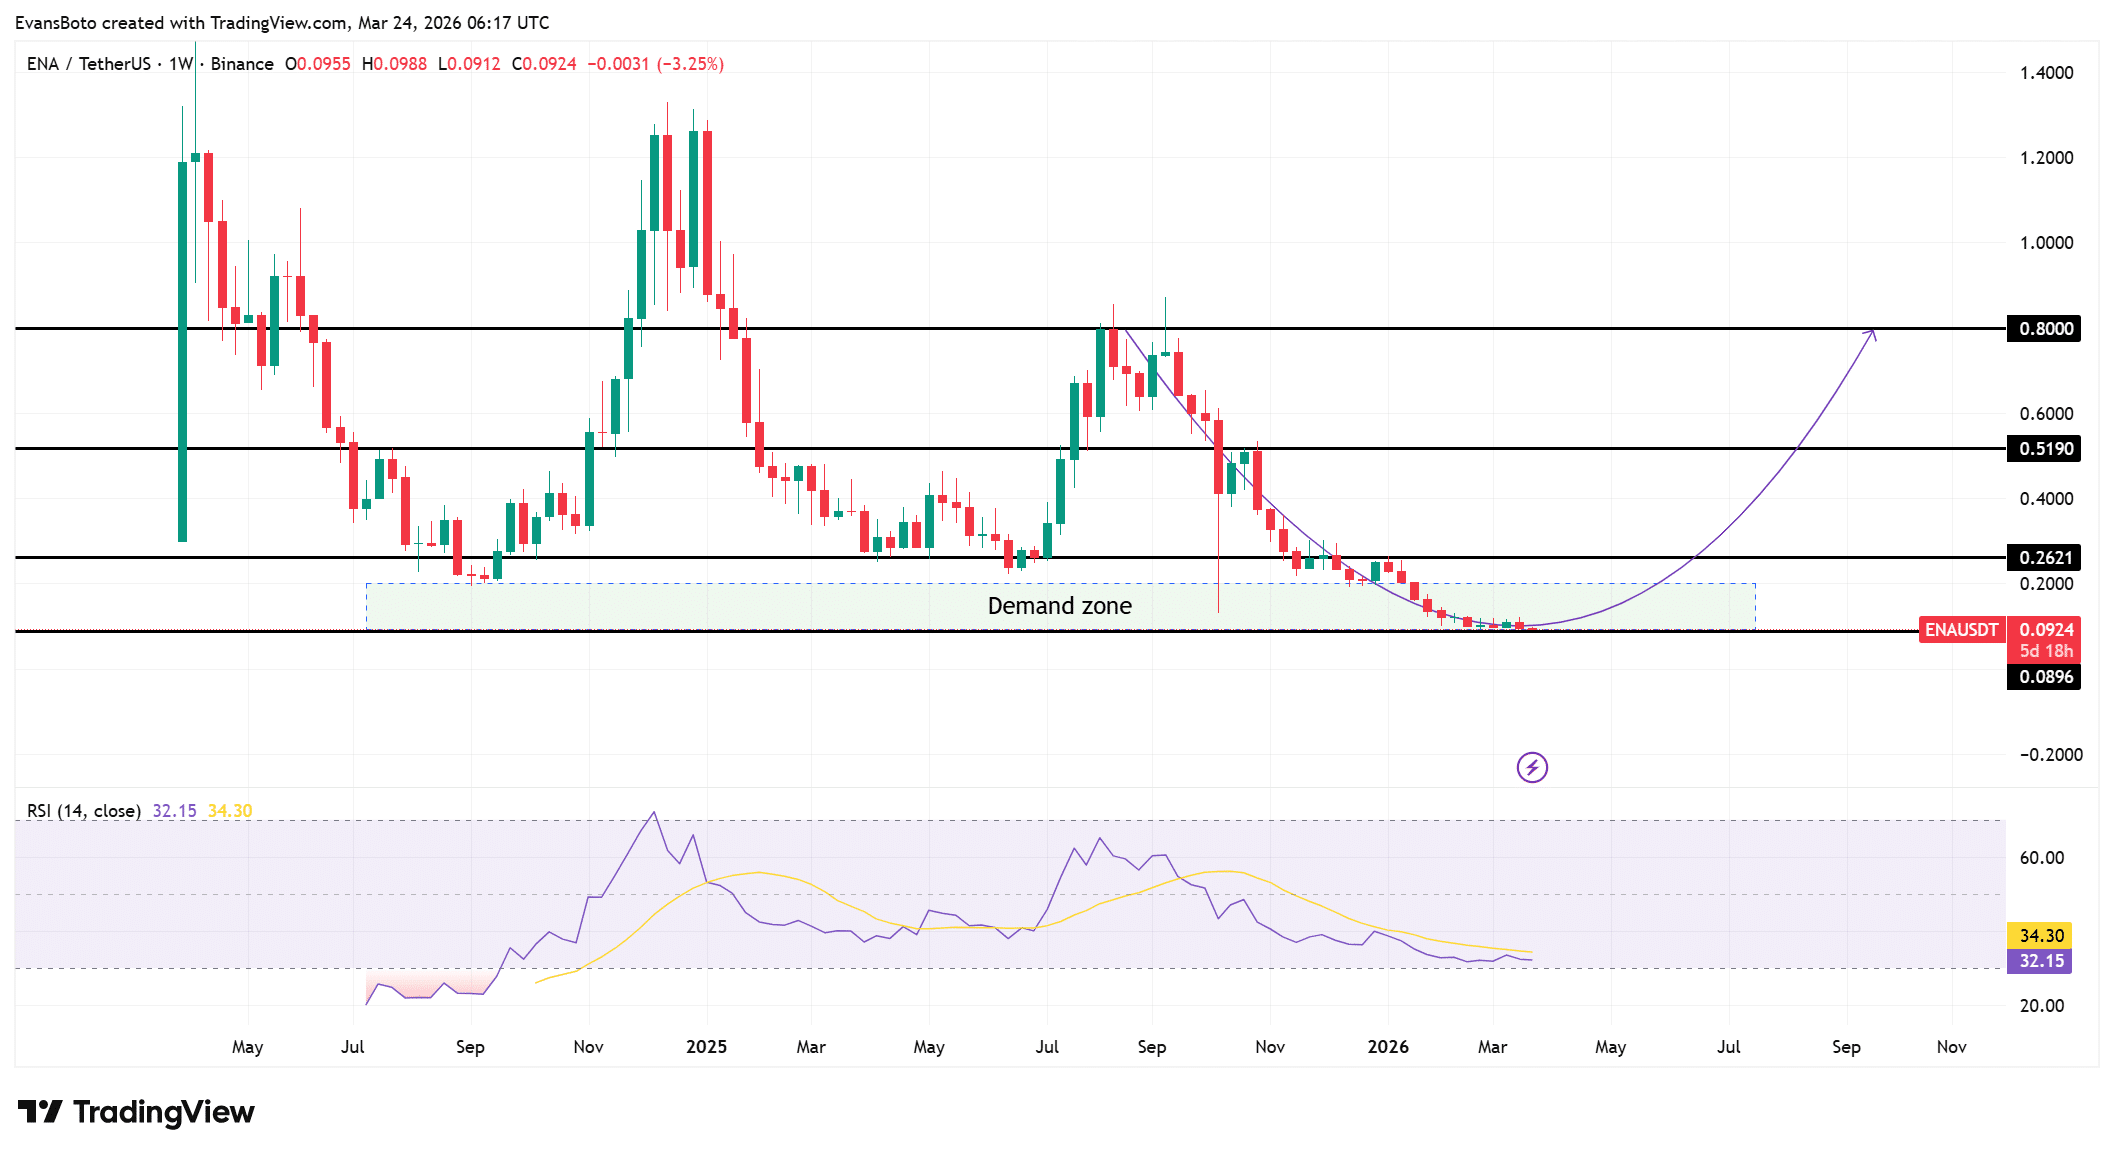
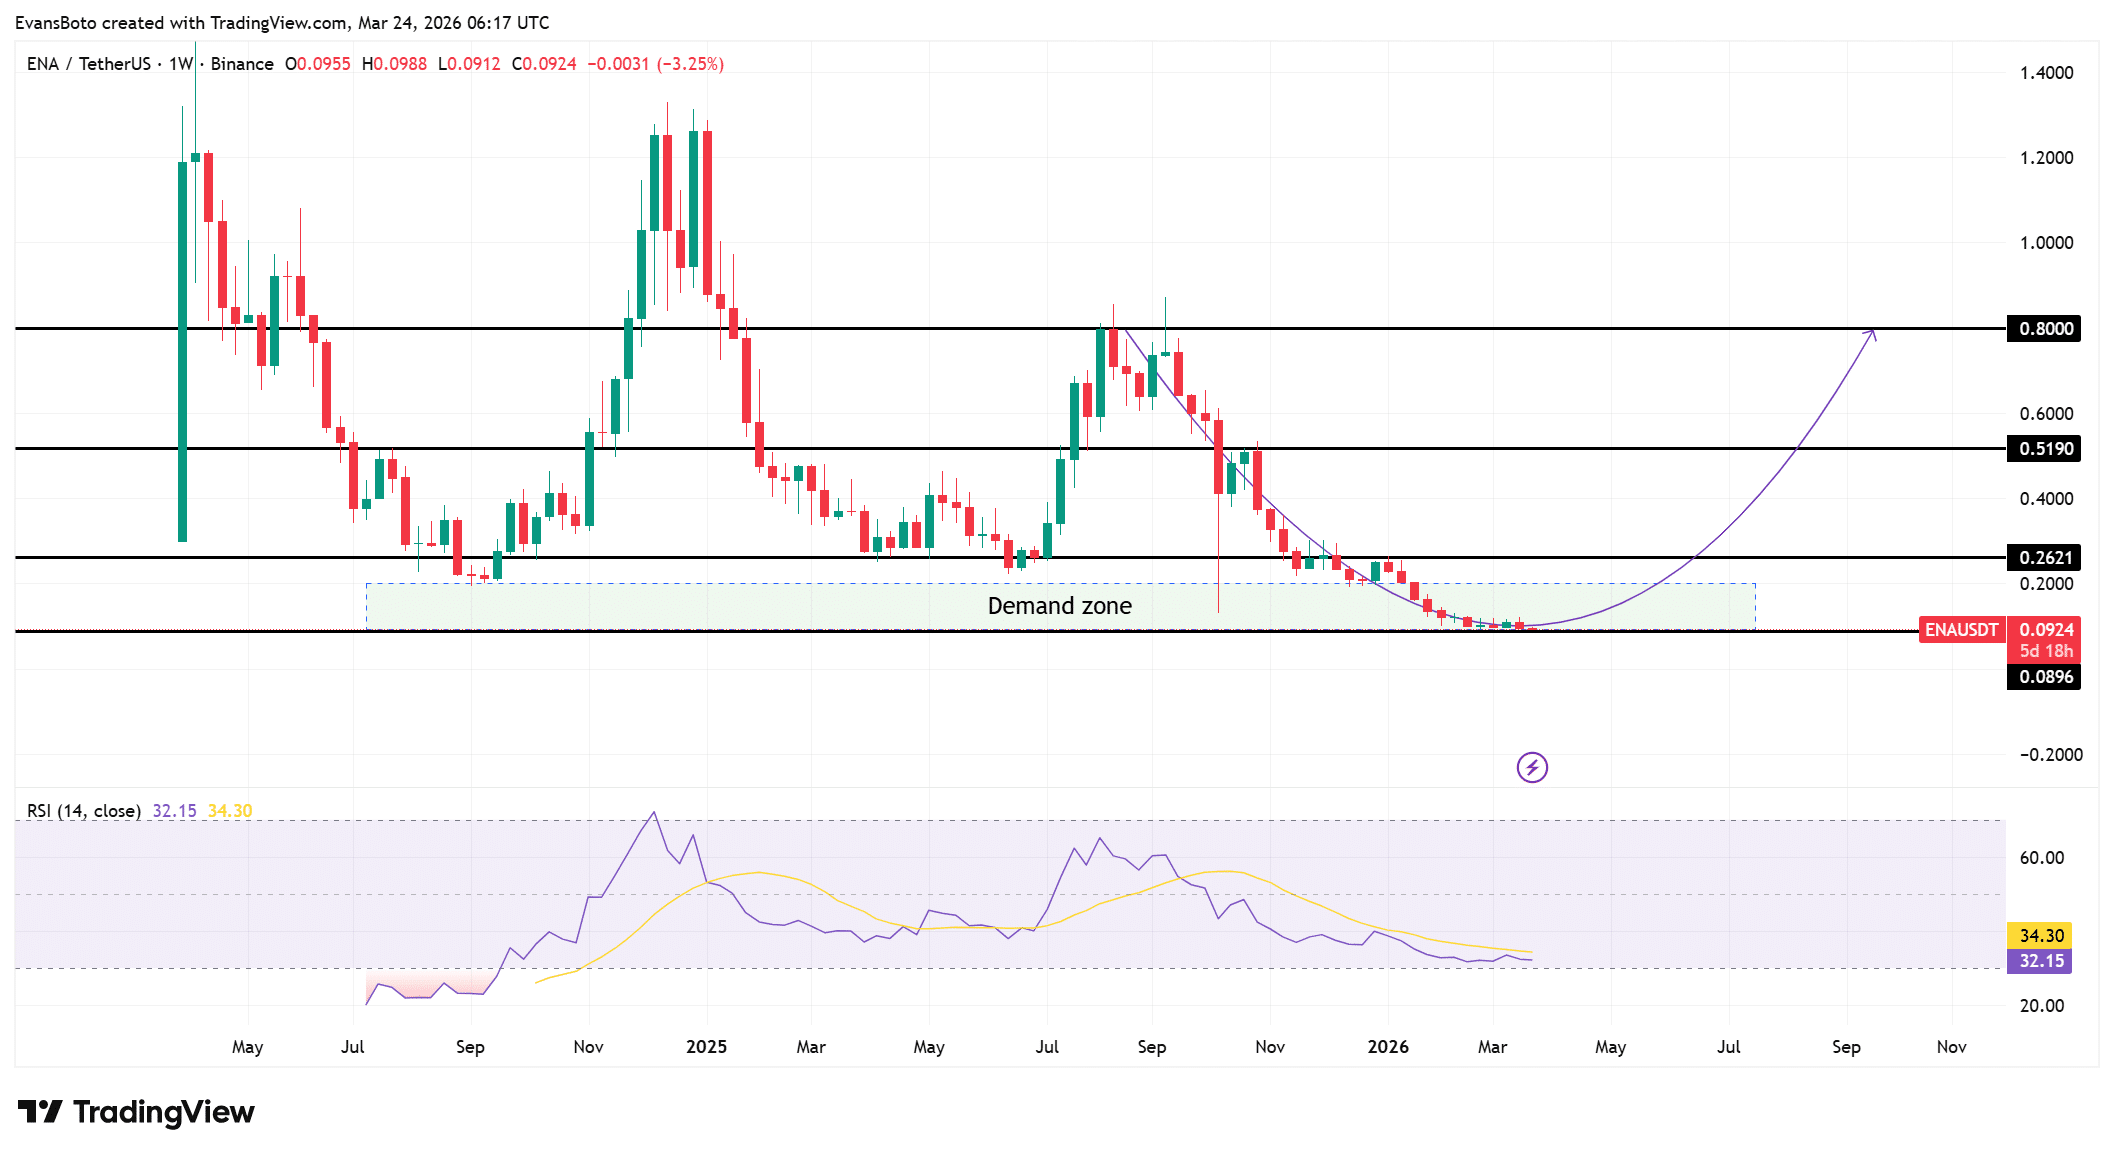
Price has declined steadily and now sits inside the $0.089–$0.10 demand zone, which marks a critical base on the weekly chart.

This level has absorbed selling pressure, as price no longer extends lower aggressively. However, ENA remains below the $0.262 resistance, which previously acted as support before the breakdown.

This shift confirms that the broader structure still leaned bearish. Above that, the $0.519 level stood as a major mid-range resistance, while $0.800 represented a higher timeframe barrier aligned with prior rejection zones.

Meanwhile, RSI hovered around 32, reflecting sustained weakness, yet it has started flattening. This behavior suggests that selling pressure is no longer intensifying.

As price compresses near demand while RSI stabilizes, the structure begins forming a base, though confirmation still depends on reclaiming higher levels.
Source: TradingView

Buyer aggression rises as demand absorbs supply

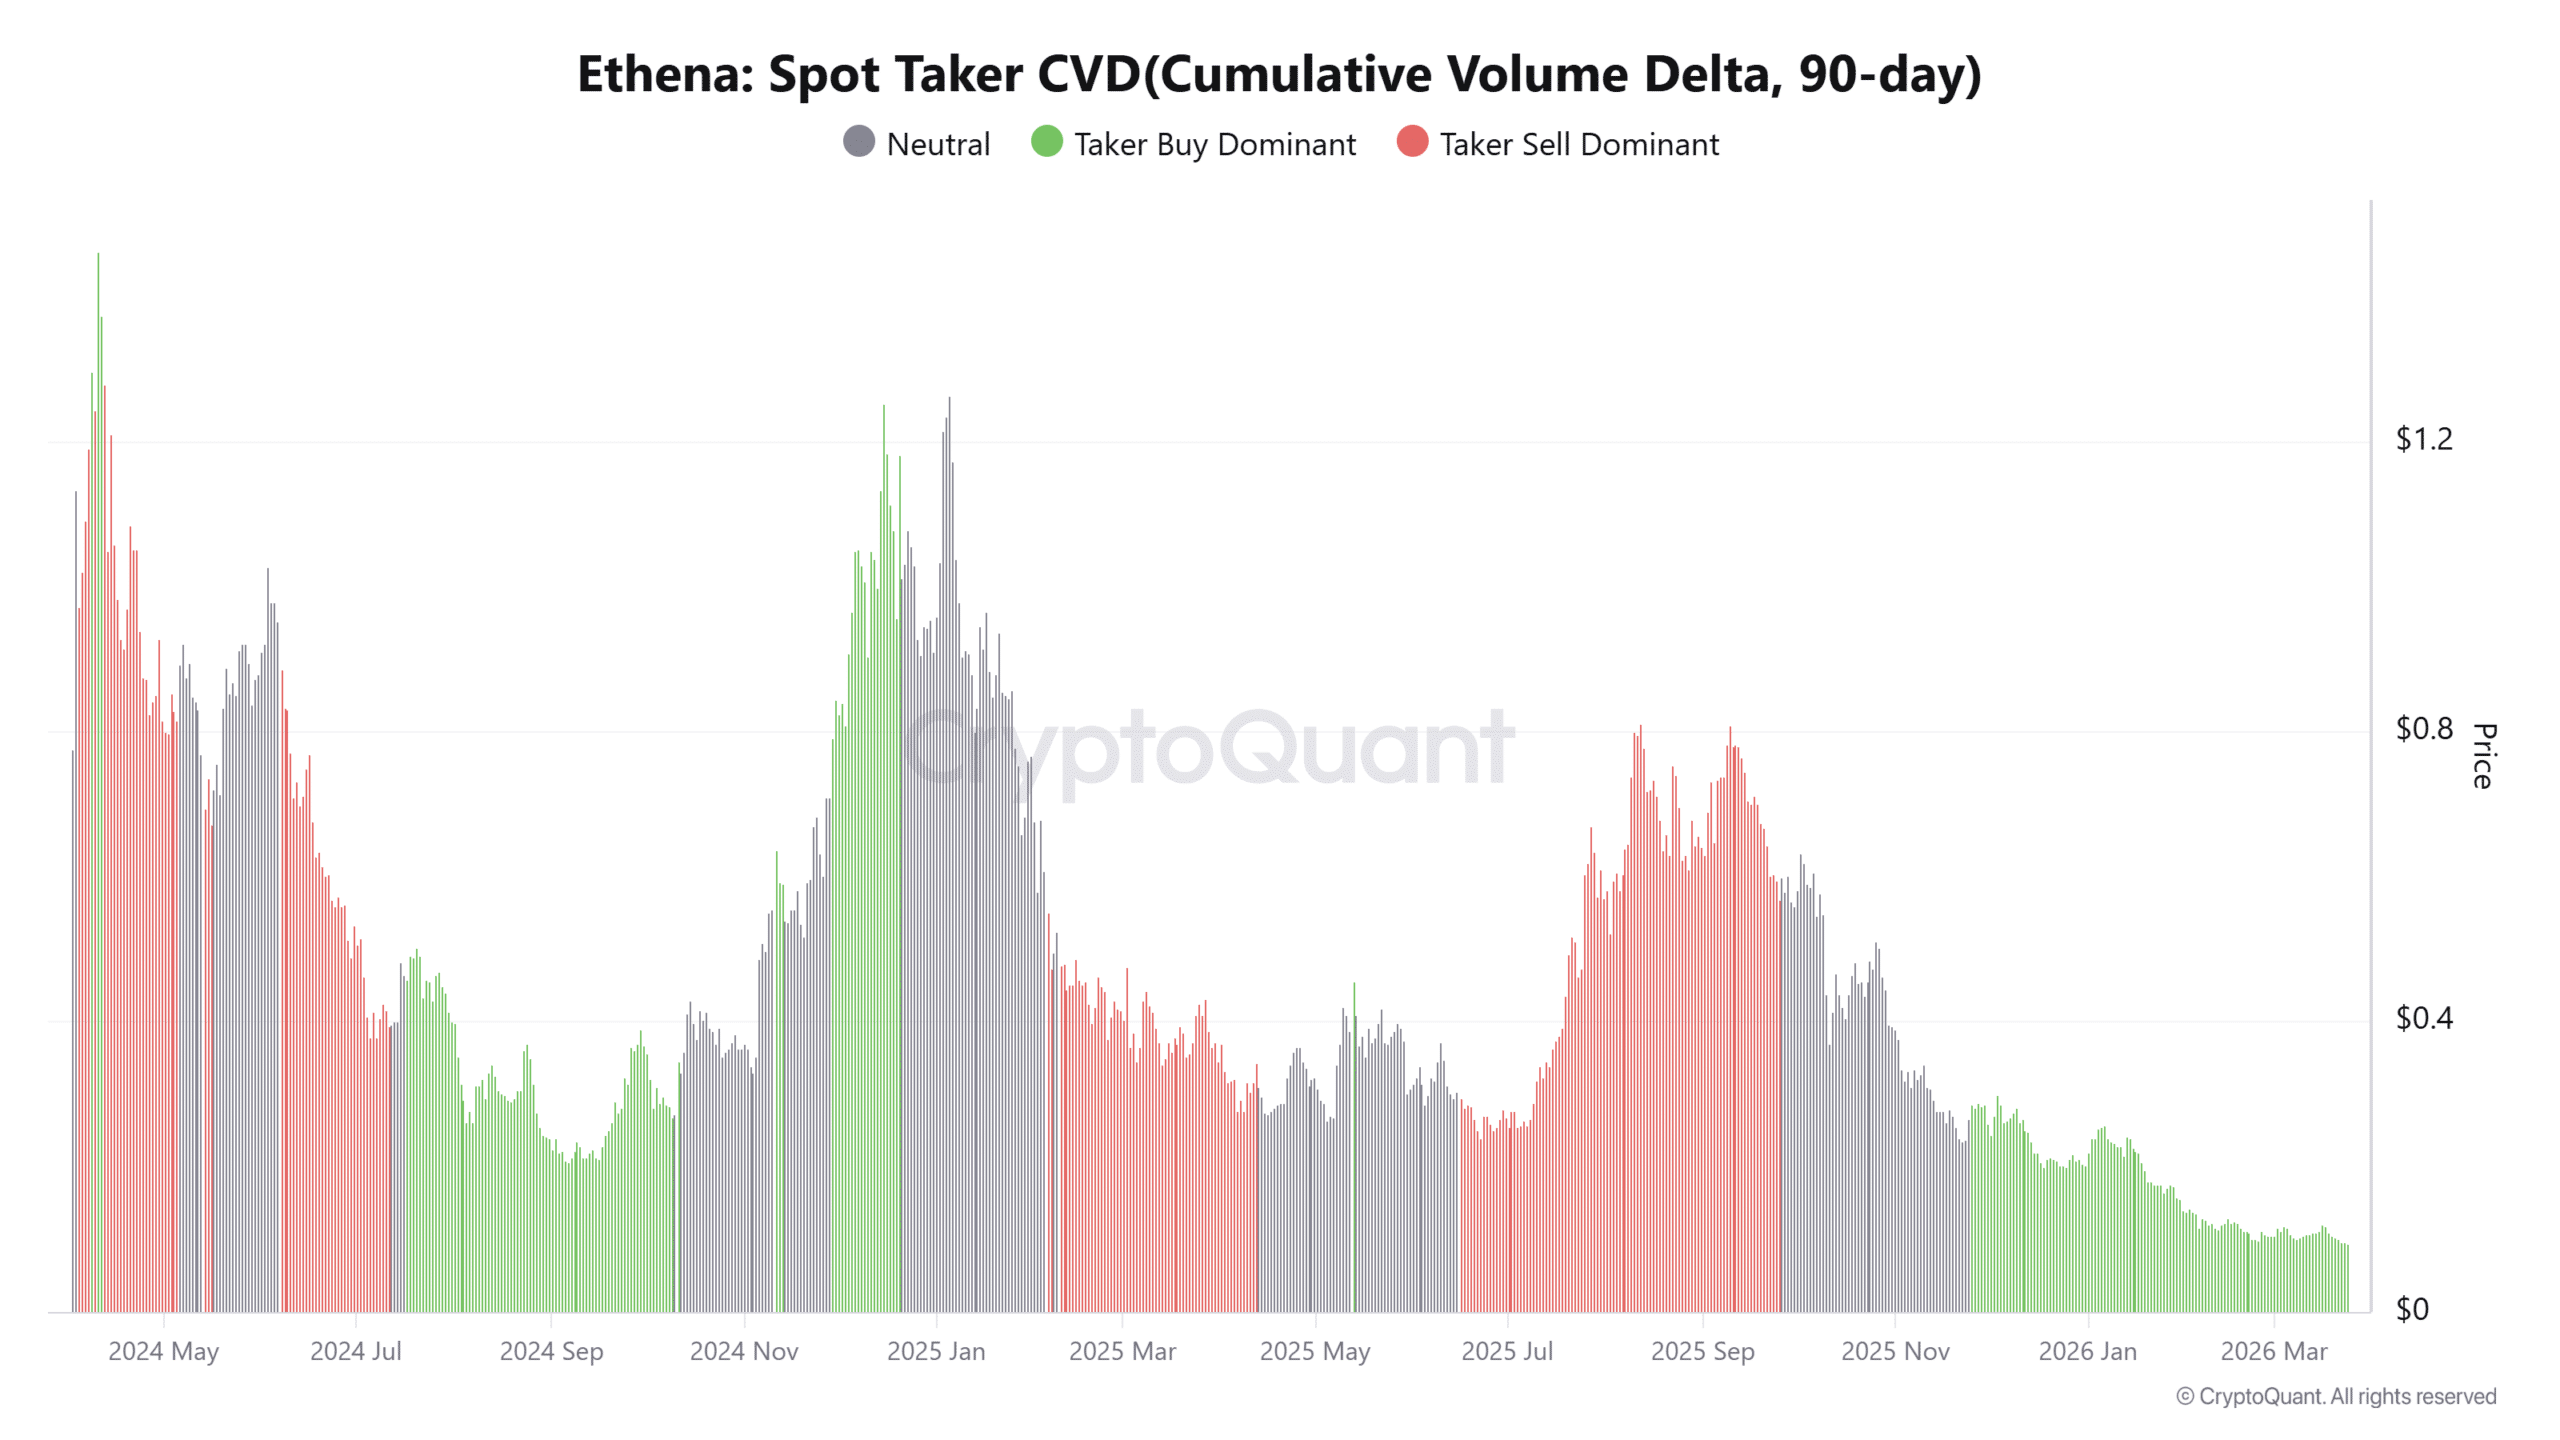
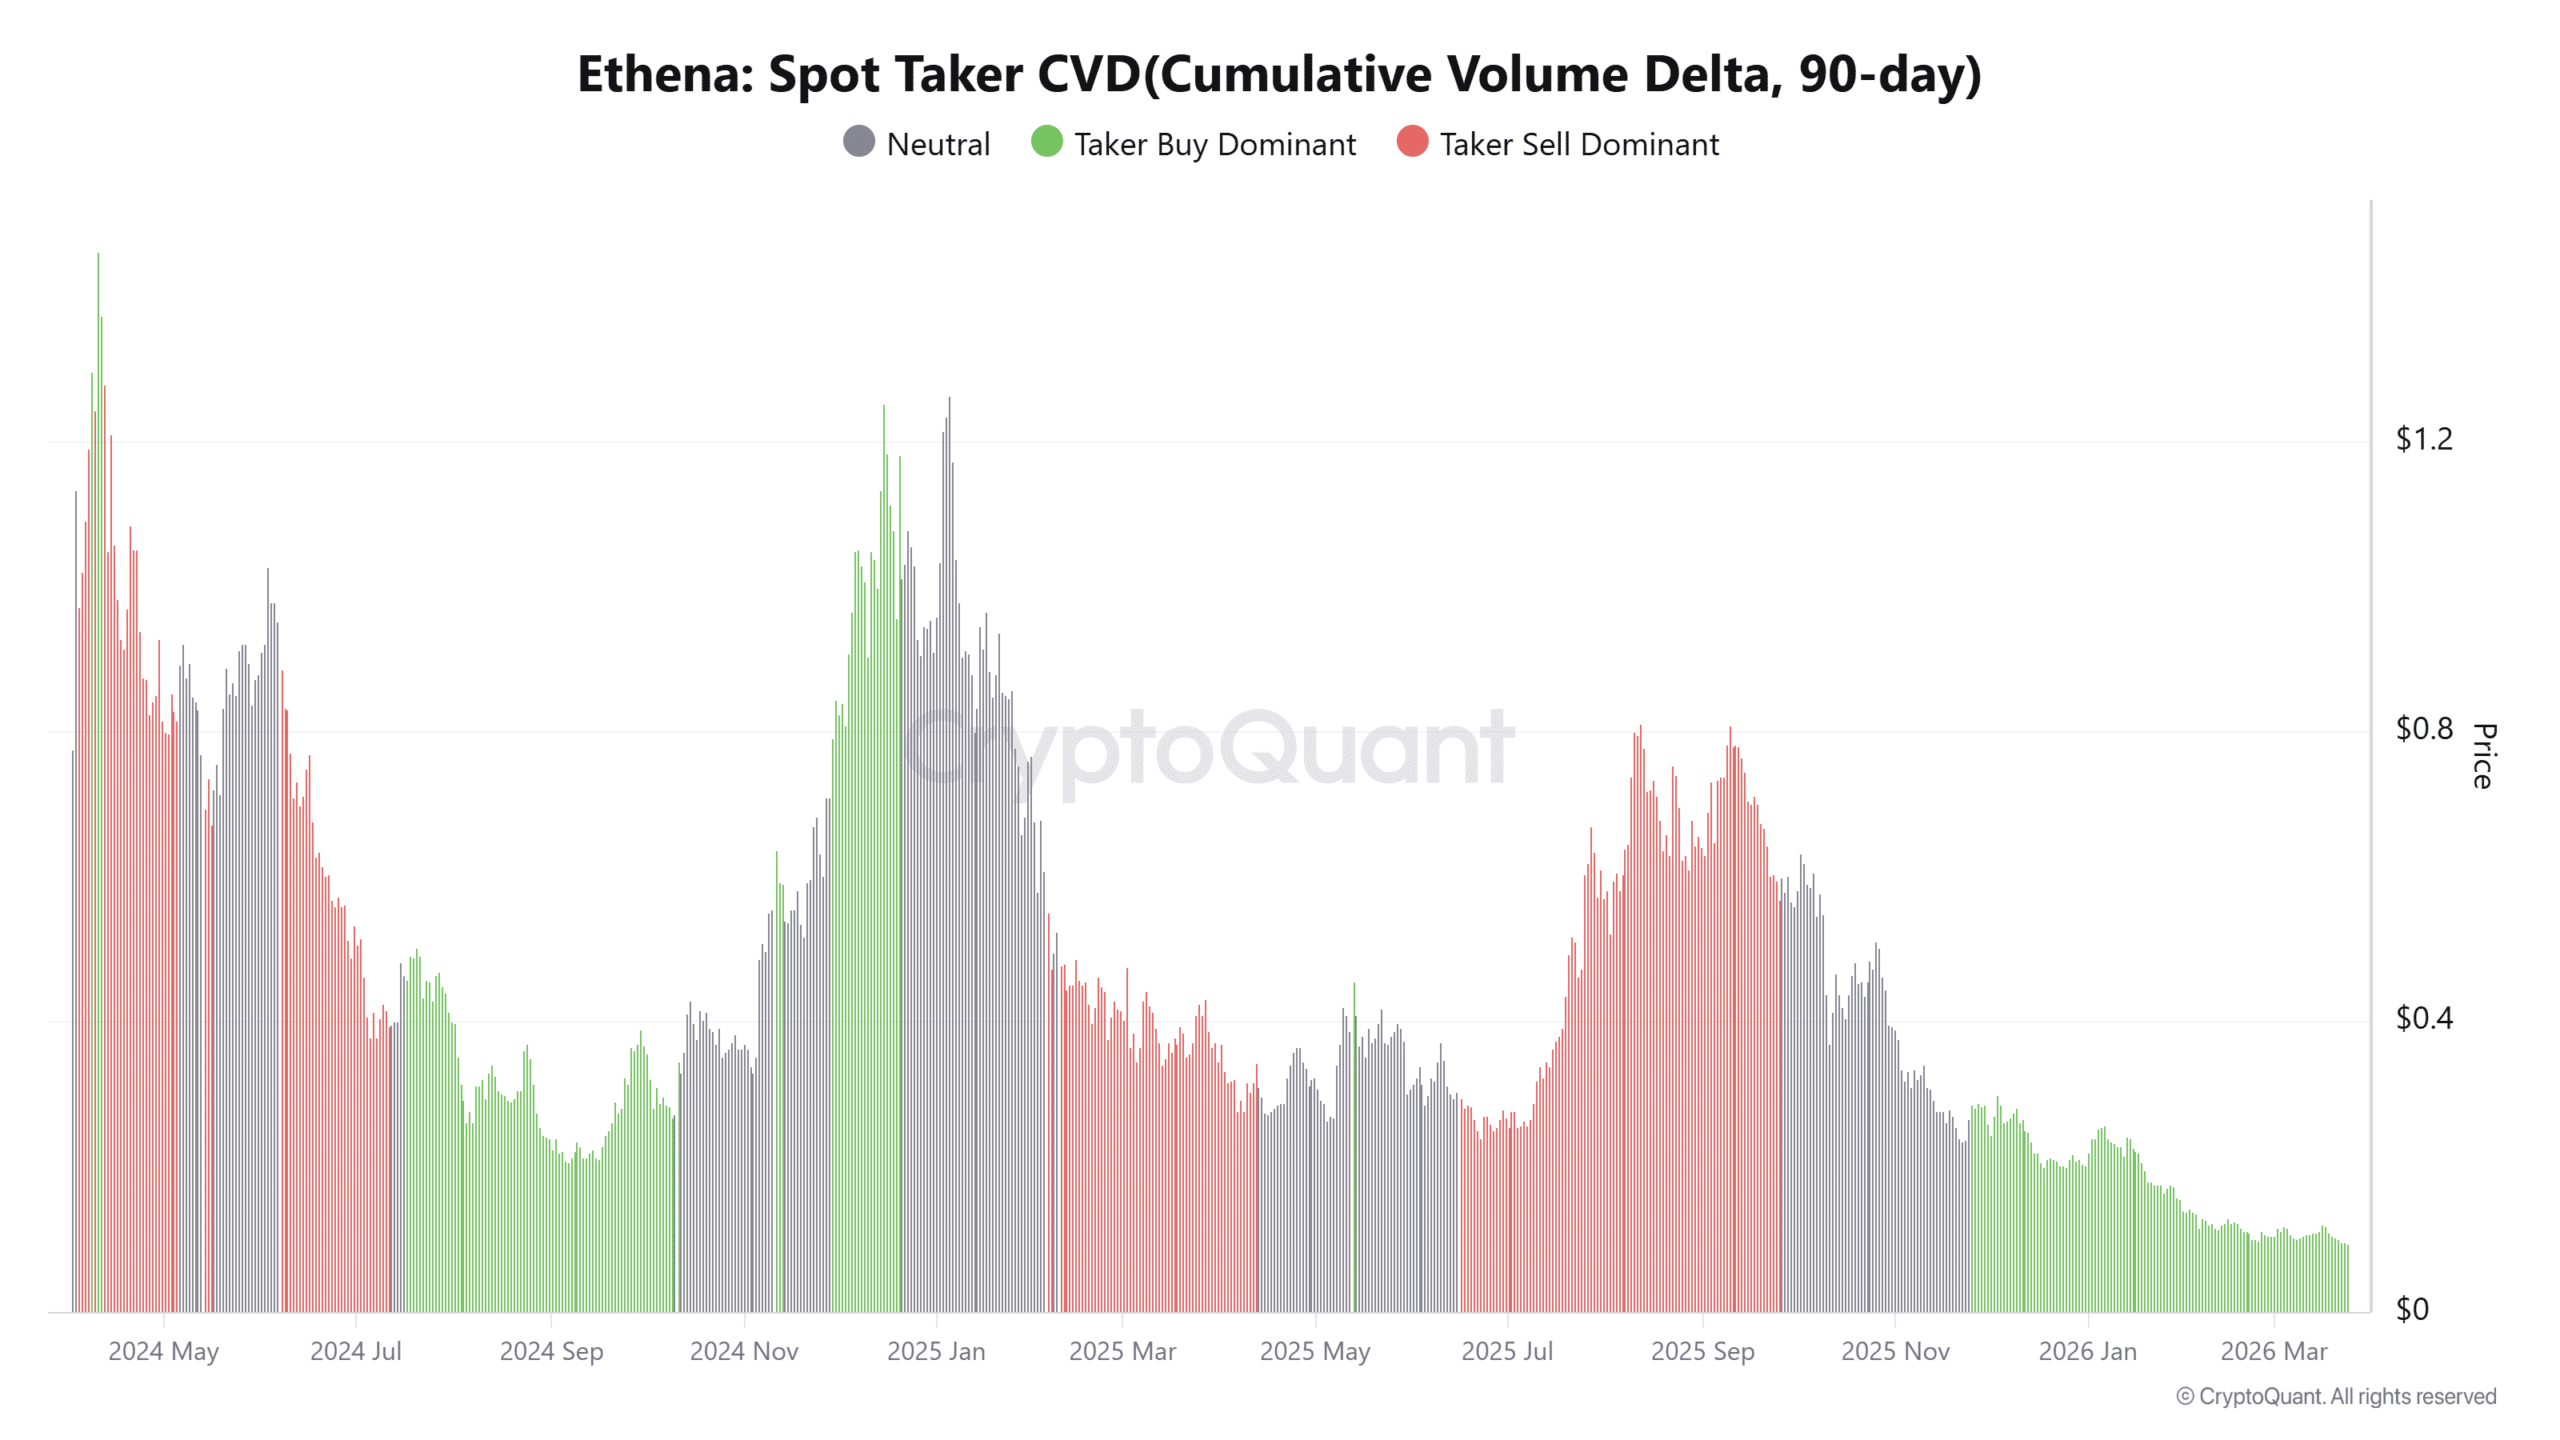
Spot Taker CVD has shifted into buyer dominance, showing that market participants were actively executing buy orders rather than waiting passively.

This behavior becomes more meaningful because it occurs while price trades near lows. Buyers were stepping in despite the weak structure, which signals confidence rather than reaction.

However, price has not yet expanded upward, indicating that sell pressure still absorbs part of this demand.

This creates a clear absorption phase where buyers gradually counterbalance supply. If this trend continues, prices could start responding more visibly.

For now, buyer dominance reflects accumulation behavior, as demand steadily interacts with reduced exchange supply without triggering immediate expansion.
Source: CryptoQuant

Liquidity builds above as shorts face pressure

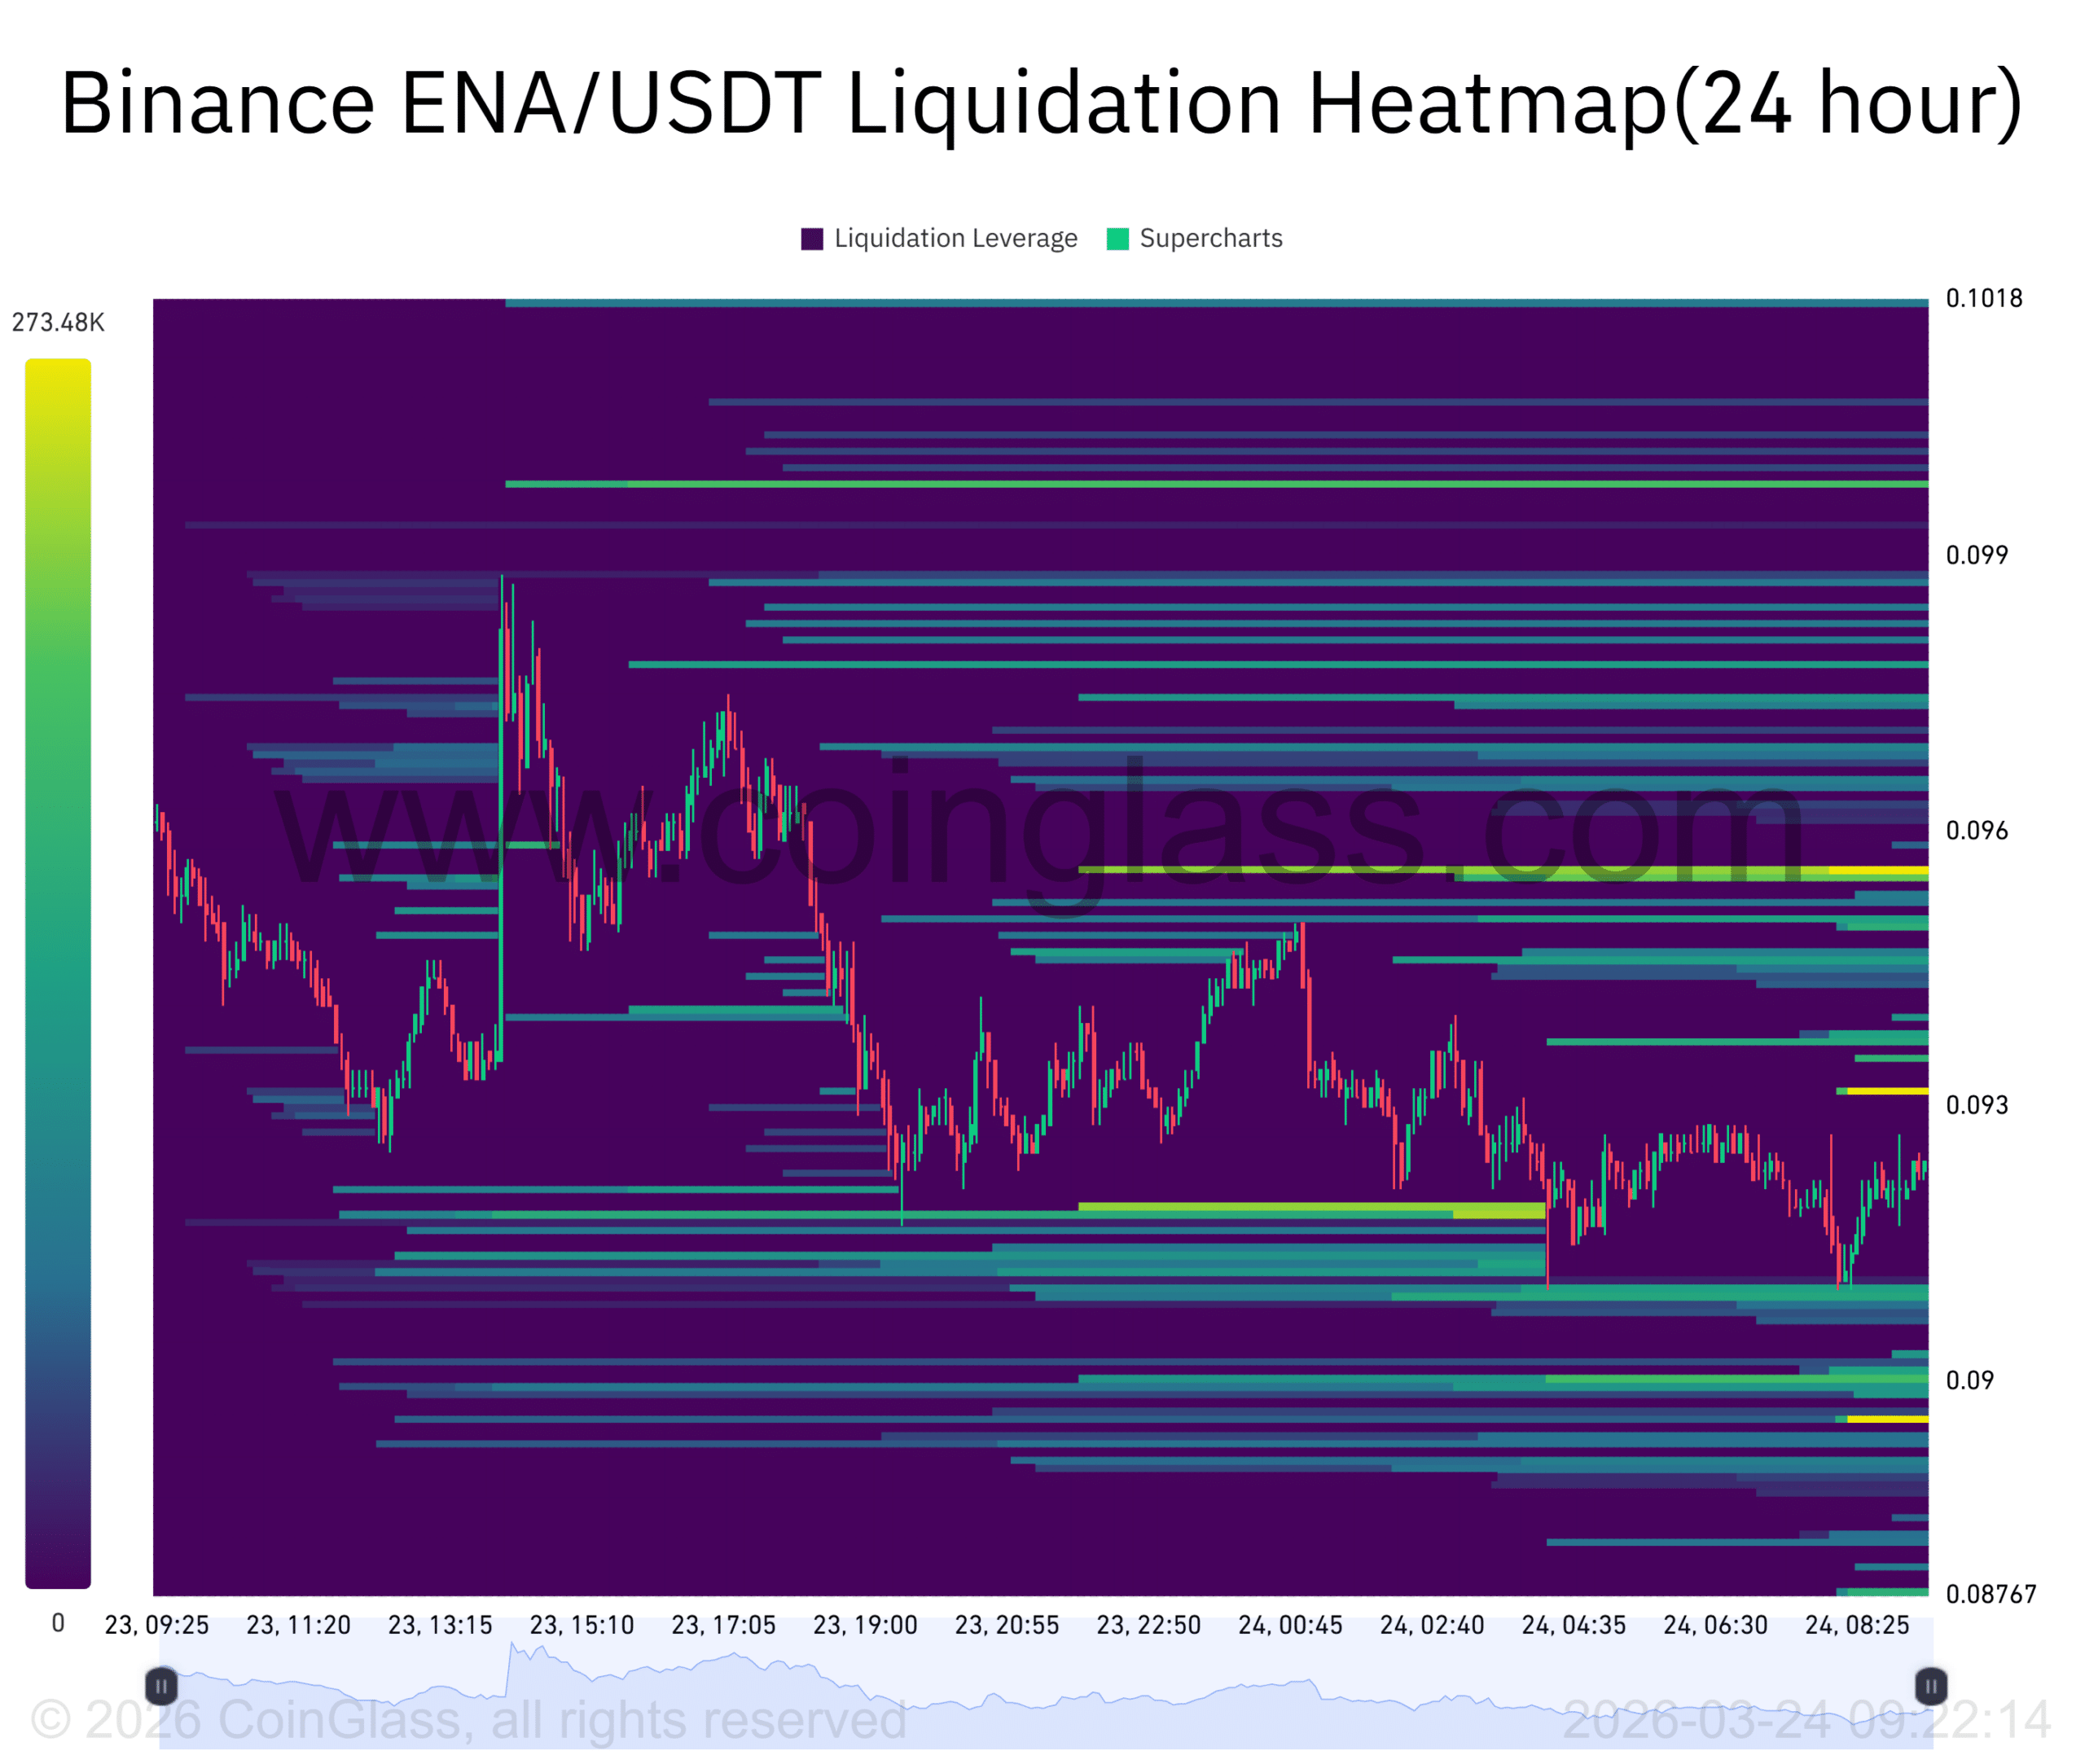
The liquidation heatmap shows dense clusters forming between $0.095 and $0.101, directly above the current price.

These levels contain significant short exposure, which could trigger forced buybacks if the price pushes upward.

As a result, they act as immediate liquidity targets. Meanwhile, ENA continues trading just below this zone, creating tension between price and overhead liquidity.

This setup aligns with rising buyer activity and reduced exchange supply. However, price must first break into this region to activate the cascade effect.

Until then, liquidity remains potential rather than realized. Still, the presence of concentrated short positions above price introduces a clear pathway for upward acceleration if demand sustains pressure.
Source: CoinGlass

To sum up, ENA continues to compress within the $0.089–$0.10 demand zone as exchange outflows and buyer-dominant CVD reflect ongoing accumulation.

This structure suggests supply continues to tighten while demand absorbs available liquidity.

However, a confirmed shift requires reclaiming $0.262, which would begin altering the broader bearish structure.

Until then, ENA remains in a base formation phase, where upside potential builds but depends entirely on sustained demand strength.


Final Summary

  • ENA holds critical demand as supply tightens, positioning price for potential structural recovery if buyers sustain pressure above resistance
  • Reclaiming $0.262 would shift sentiment, allowing price to target higher liquidity zones while weakening the prevailing bearish structure.


Trend Kriptolar

İlgili Sorular

QWhat was the significance of the $4.07M ENA withdrawal from Binance mentioned in the article?

AThe $4.07M ENA withdrawal from Binance coincided with persistent exchange outflows and rising buyer activity, reinforcing a tightening supply structure. It showed that tokens were leaving exchanges instead of preparing for sell pressure, which reduces the available supply on trading platforms.

QAccording to the article, what is the critical demand zone for ENA's price on the weekly chart?

AThe critical demand zone for ENA's price on the weekly chart is between $0.089 and $0.10. This level has absorbed selling pressure and marks a critical base where the price is compressing.

QWhat does the shift in Spot Taker CVD indicate about market participants?

AThe shift in Spot Taker CVD into buyer dominance indicates that market participants were actively executing buy orders rather than waiting passively. This shows buyer confidence and accumulation behavior, despite the price trading near lows.

QWhat potential effect could the dense liquidation clusters between $0.095 and $0.101 have on ENA's price?

AThe dense liquidation clusters between $0.095 and $0.101 contain significant short exposure, which could trigger forced buybacks if the price pushes upward. This could act as immediate liquidity targets and potentially cause an upward acceleration if demand sustains pressure.

QWhat key resistance level does ENA need to reclaim to begin altering its broader bearish structure?

AENA needs to reclaim the $0.262 resistance level to begin altering its broader bearish structure. This would shift sentiment and allow the price to target higher liquidity zones.

İlgili Okumalar

Annual Salary of Millions Competing for Electricians, Meta Rushes to Open Its Own Technical School

The AI boom is facing an unexpected bottleneck: a severe shortage of skilled construction workers and electricians. As tech giants like Meta, OpenAI, and Alphabet race to build massive data centers—such as OpenAI's $16 billion "Stargate" project—they are hitting a critical labor wall. The U.S. needs an estimated 130,000 more electricians, 240,000 construction workers, and 150,000 supervisors by 2030 for AI infrastructure alone, but tens of thousands of electrician jobs go unfilled each year. While AI companies offer high premiums, with electricians earning up to $280,000 annually, worker scarcity still causes massive losses—delays on a single project can cost $14.2 million per month. The complexity of building AI data centers, which require immense power (equivalent to powering hundreds of thousands of homes), sophisticated electrical systems, and advanced liquid cooling solutions, demands highly skilled technicians who are in short supply. To combat this, companies are investing heavily in training. Meta has committed $115 million to a free training school offering tuition, housing, and stipends, targeting 5,000 new workers. OpenAI is partnering with unions to secure skilled labor. These efforts are paying off, with a significant rise in Gen Z interest in trade schools over college. However, the power demands are staggering. AI data centers are driving a rapid surge in electricity consumption, projected to account for up to 12% of U.S. power use by 2028 and raising costs for consumers. Furthermore, the construction boom is project-based, leading to a potential future glut of trained workers once building peaks, which could depress wages industry-wide. The race for AI supremacy now depends as much on skilled hands as on advanced chips.

marsbit30 dk önce

Annual Salary of Millions Competing for Electricians, Meta Rushes to Open Its Own Technical School

marsbit30 dk önce

OpenAI No Longer Sells Its Most Expensive Model for Profit

OpenAI is shifting its business strategy away from promoting its most expensive, flagship models for every task. Recent price cuts—80% for GPT-5.6 Luna and 20% for Terra—signal a deeper change: the company now actively advises users that many tasks don't require the most powerful model. Instead, OpenAI recommends a tiered approach: use the high-end GPT-5.6 Sol for complex planning and analysis, then delegate execution to cheaper models like Luna. This mirrors moves by Anthropic, which recently launched Claude Opus 5 at half the price of its top model, Fable 5. Both companies are de-emphasizing flagship models as primary revenue drivers, using them instead for brand prestige and technological showcases. The industry is entering a "mass-market" phase, similar to automotive, where high-volume, cost-effective models handle daily operations and drive scale. OpenAI's price reductions are partly enabled by AI models themselves optimizing underlying code and infrastructure, creating a self-reinforcing cycle of efficiency gains and cost reduction. Competition is shifting from "who is smartest" to "who offers the best value." The goal is no longer selling individual models but fostering widespread API adoption and ecosystem lock-in. By making AI calls cheap and ubiquitous, companies like OpenAI aim to become the indispensable, utility-like infrastructure powering automated workflows—the "water and electricity" of software, quietly embedded everywhere.

marsbit30 dk önce

OpenAI No Longer Sells Its Most Expensive Model for Profit

marsbit30 dk önce

Will the Fed Definitely Raise Interest Rates in September? How Will Crypto and U.S. Stocks Withstand the Pressure?

The market's expectation for a September Fed rate hike surged dramatically in early August, jumping from under 50% to over 80% within a week. This shift followed a contentious July FOMC meeting, where a 9-3 vote to hold rates revealed growing dissent from hawkish members advocating for an immediate hike to combat persistent inflation. The primary catalyst for this repricing is rising oil prices, driven by renewed geopolitical tensions around the Strait of Hormuz, which threaten global supply. Energy costs directly influence inflation metrics, making the upcoming July CPI report (due August 12th) a critical data point. If it shows inflation reaccelerating, the probability of a September hike will solidify. For Bitcoin and crypto assets, this is typically bearish news. Bitcoin continues to behave as a high-beta, liquidity-sensitive risk asset. A rate hike raises the opportunity cost of holding non-yielding assets and could drive capital toward money markets, pressuring crypto prices in the short term. However, historical patterns suggest that if a hike is perceived as the end of a tightening cycle rather than the start, any negative price impact may be brief. U.S. stocks, particularly crypto-linked equities like Coinbase and growth-oriented tech stocks, are also vulnerable. Higher rates increase discount rates in valuation models, putting pressure on high-multiple companies. This coincides with a pivotal tech earnings season where investor focus has shifted from massive AI capital expenditure to tangible revenue and cash flow generation. Companies with negative cash flow and weak growth narratives could face heightened volatility if borrowing costs rise in September. In summary, a September Fed hike has evolved into a mainstream market scenario. Key factors to watch are oil prices, the July CPI report, and Fed communications, which will determine the final decision and its impact on volatile crypto and equity markets.

marsbit41 dk önce

Will the Fed Definitely Raise Interest Rates in September? How Will Crypto and U.S. Stocks Withstand the Pressure?

marsbit41 dk önce

İşlemler

Spot

Popüler Makaleler

4 Nasıl Satın Alınır

HTX.com’a hoş geldiniz! 4 (4) satın alma işlemlerini basit ve kullanışlı bir hâle getirdik. Adım adım açıkladığımız rehberimizi takip ederek kripto yolculuğunuza başlayın. 1. Adım: HTX Hesabınızı OluşturunHTX'te ücretsiz bir hesap açmak için e-posta adresinizi veya telefon numaranızı kullanın. Sorunsuzca kaydolun ve tüm özelliklerin kilidini açın. Hesabımı Aç2. Adım: Kripto Satın Al Bölümüne Gidin ve Ödeme Yönteminizi SeçinKredi/Banka Kartı: Visa veya Mastercard'ınızı kullanarak anında 4 (4) satın alın.Bakiye: Sorunsuz bir şekilde işlem yapmak için HTX hesap bakiyenizdeki fonları kullanın.Üçüncü Taraflar: Kullanımı kolaylaştırmak için Google Pay ve Apple Pay gibi popüler ödeme yöntemlerini ekledik.P2P: HTX'teki diğer kullanıcılarla doğrudan işlem yapın.Borsa Dışı (OTC): Yatırımcılar için kişiye özel hizmetler ve rekabetçi döviz kurları sunuyoruz.3. Adım: 4 (4) Varlıklarınızı Saklayın4 (4) satın aldıktan sonra HTX hesabınızda saklayın. Alternatif olarak, blok zinciri transferi yoluyla başka bir yere gönderebilir veya diğer kripto para birimlerini takas etmek için kullanabilirsiniz.4. Adım: 4 (4) Varlıklarınızla İşlem YapınHTX'in spot piyasasında 4 (4) ile kolayca işlemler yapın.Hesabınıza erişin, işlem çiftinizi seçin, işlemlerinizi gerçekleştirin ve gerçek zamanlı olarak izleyin. Hem yeni başlayanlar hem de deneyimli yatırımcılar için kullanıcı dostu bir deneyim sunuyoruz.

494 Toplam GörüntülenmeYayınlanma 2025.10.20Güncellenme 2026.06.02

4 Nasıl Satın Alınır

Tartışmalar

HTX Topluluğuna hoş geldiniz. Burada, en son platform gelişmeleri hakkında bilgi sahibi olabilir ve profesyonel piyasa görüşlerine erişebilirsiniz. Kullanıcıların 4 (4) fiyatı hakkındaki görüşleri aşağıda sunulmaktadır.

活动图片