End Of Bitcoin Distribution? Key Data Reveals A Shift In LTH Behavior

bitcoinist2025-12-31 tarihinde yayınlandı2025-12-31 tarihinde güncellendi

Özet

Bitcoin is trading below $90,000 amid deteriorating market sentiment, with analysts warning of a potential bear market. However, on-chain data suggests a shift in long-term holder (LTH) behavior. While social media narratives claim LTHs are distributing Bitcoin at record levels, analysis shows that recent large transfers—including 800,000 BTC moved from Coinbase—skewed the data. After adjusting for this anomaly, LTH supply appears to be stabilizing or even recovering, with a reduction in selling pressure. This shift, combined with short-term holders holding positions, indicates easing sell-side pressure. Bitcoin is currently consolidating around $88K, just above the 200-day moving average—a key support level. A break below could expose the $75K–$80K range, but the current data challenges the dominant bearish narrative and may signal a move toward market balance.

Bitcoin continues to trade below the $90,000 level, struggling to regain bullish momentum as market sentiment deteriorates. A growing number of analysts are now openly calling for a broader bear market, pointing to persistent weakness, failed breakouts, and declining risk appetite across crypto. Despite this gloomy backdrop, not all market participants are convinced that Bitcoin’s next major move will be lower.

Some investors remain focused on 2026, arguing that structural conditions could begin to shift in the coming months. One of the key debates centers on long-term holders (LTHs). While social media narratives increasingly claim that LTHs are distributing Bitcoin at record levels, on-chain data suggests a more nuanced reality.

According to a report by analyst Darkfost, much of the perceived LTH selling has been distorted by large, isolated movements—particularly nearly 800,000 BTC transferred from Coinbase—which skewed traditional LTH metrics.
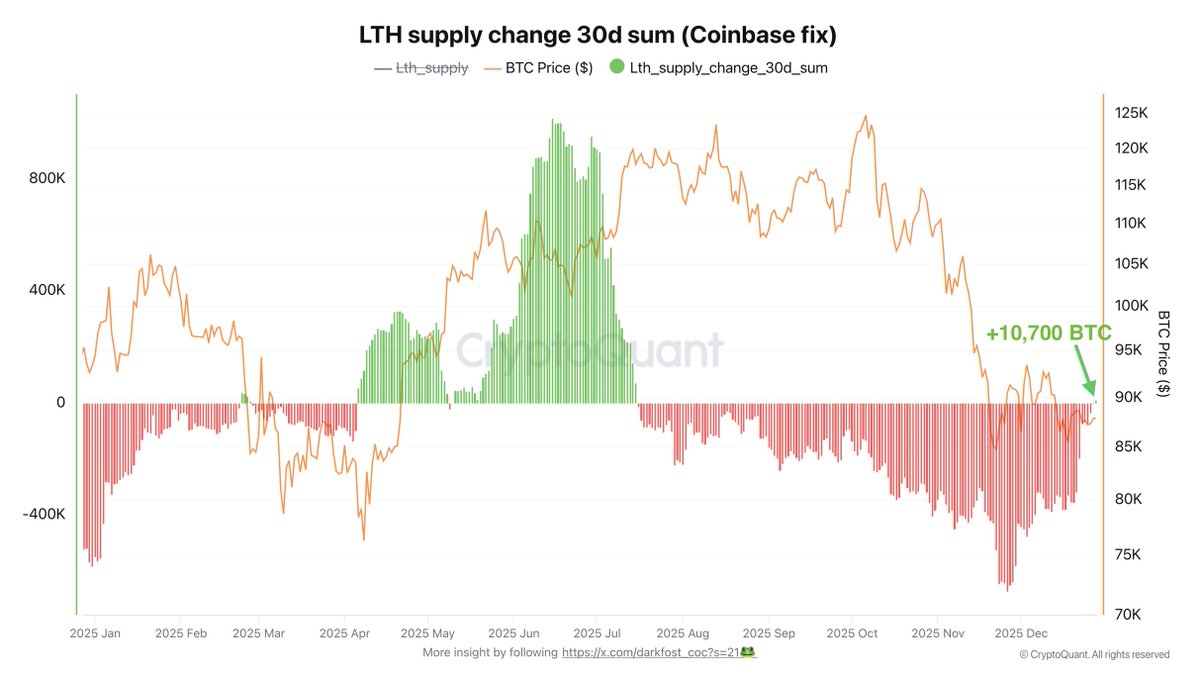
LTH Supply Change 30d sum (Coinbase) | Source: CryptoQuant

After adjusting the data to exclude this anomaly, a clear change in supply dynamics emerges. Rather than accelerating distribution, the adjusted chart shows signs that long-term holder supply is stabilizing, and in some cases beginning to recover. This challenges the dominant bearish narrative and suggests that selling pressure from seasoned holders may be fading.

As Bitcoin consolidates below key resistance, the divergence between price weakness and shifting on-chain behavior sets the stage for a critical inflection point ahead.

Long-Term Holders Reduce Selling Pressure

Darkfost adds important context to the evolving Bitcoin narrative by focusing on long-term holder (LTH) supply dynamics. According to his analysis, the monthly LTH supply change—measured as a 30-day rolling sum—had remained firmly locked in a distribution phase since July 16.

For several months, this metric consistently showed negative readings, confirming that long-term holders were gradually reducing their exposure and releasing supply into the market.

That trend has now shifted. The latest data shows the metric moving back into positive territory, with approximately 10,700 BTC transitioning into long-term held coins. While this figure is still relatively small in absolute terms, it marks a clear inflection from sustained distribution to early re-accumulation.

In practical terms, it suggests that LTHs have slowed their selling activity to the point where their aggregate supply is beginning to grow again.

This shift is particularly notable because it is occurring while short-term holders (STHs) continue to hold their positions rather than aggressively selling. The combination points to a cooling of sell-side pressure from both cohorts, even as price remains under pressure.

Historically, similar transitions in LTH supply behavior have often preceded periods of sideways consolidation or, in more constructive cases, the early stages of bullish recoveries.

While this signal alone does not guarantee an upside move, it does suggest that the market may be moving away from forced distribution and toward a more balanced phase, depending on how broader macro and price trends develop.

Bitcoin Consolidates Above Long-Term Support

Bitcoin’s price action continues to reflect a market caught between structural support and lingering downside pressure. After failing to hold above the $100K–$105K region earlier in the quarter, BTC entered a sharp corrective phase that accelerated into November. That move pushed price decisively below the 50-day and 100-day moving averages, confirming a short-term trend shift from expansion to contraction.
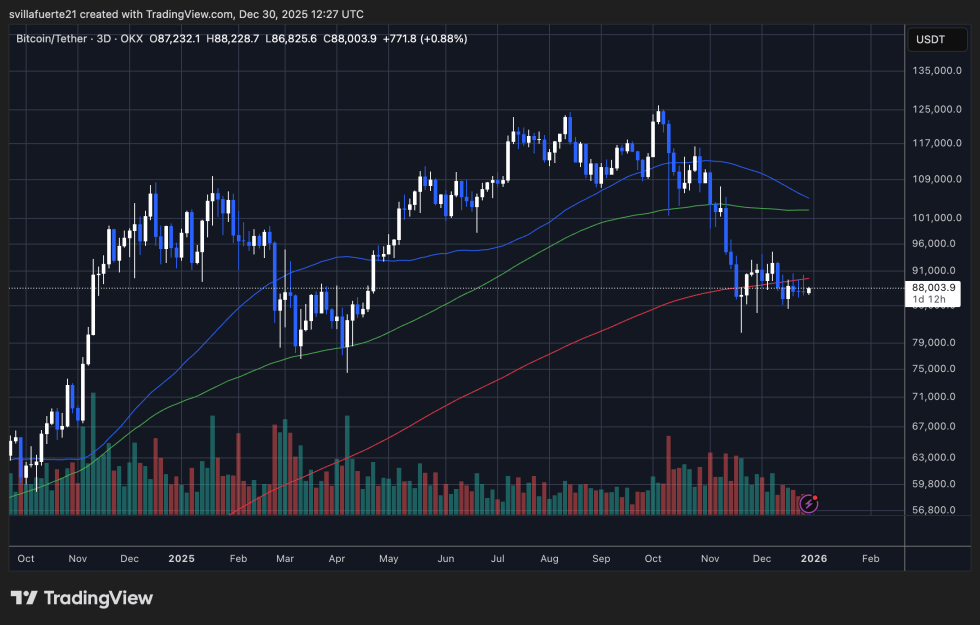
BTC price testing critical level | Source: BTCUSDT chart on TradingView

At present, Bitcoin is consolidating around the $88K zone, hovering just above the rising 200-day moving average, which sits slightly lower and continues to act as a critical long-term support.

This area has become a key battleground: repeated downside wicks suggest buyers are defending the level, but upside follow-through remains limited. The declining slope of the shorter moving averages reinforces the idea that bullish momentum has not yet returned.

Volume dynamics also support a consolidation narrative rather than active accumulation. Selling pressure has eased compared to the November breakdown, but demand has not expanded meaningfully enough to reclaim prior resistance. Structurally, the market appears to be transitioning from a high-volatility selloff into a compression phase.

As long as BTC holds above the 200-day moving average, the broader bullish structure from earlier in the cycle remains technically intact. However, a failure to defend this level would expose the $80K–$75K region as the next major support.

Featured image from ChatGPT, chart from TradingView.com

Trend Kriptolar

İlgili Sorular

QWhat key data suggests a shift in long-term holder (LTH) behavior according to the article?

AThe key data is the monthly LTH supply change (30-day rolling sum), which has moved back into positive territory with approximately 10,700 BTC transitioning into long-term held coins, indicating a shift from sustained selling to early re-accumulation.

QWhat event distorted the traditional LTH metrics and created a perception of record selling?

AThe perception was distorted by a large, isolated movement of nearly 800,000 BTC transferred from Coinbase, which skewed the data.

QWhat is the significance of Bitcoin's current price level in relation to the 200-day moving average?

AThe $88K zone, where Bitcoin is consolidating, is just above the rising 200-day moving average, which acts as a critical long-term support. Holding above it keeps the broader structure intact, while a break below could expose the $80K–$75K region.

QHow does the article describe the current market sentiment and the actions of short-term holders (STHs)?

AThe article describes market sentiment as deteriorating, with many analysts calling for a broader bear market. However, short-term holders (STHs) are described as continuing to hold their positions rather than aggressively selling, contributing to a cooling of sell-side pressure.

QWhat does the shift in LTH behavior historically indicate for Bitcoin's price, according to the article?

AHistorically, similar transitions in LTH supply behavior from distribution to re-accumulation have often preceded periods of sideways consolidation or the early stages of bullish recoveries.

İlgili Okumalar

Interview with Robinhood Executive: Meme + Tokenized US Stocks as "Barbell" Customer Acquisition Strategy, All Business Lines Achieve Hundreds of Millions in Revenue

Interview with Robinhood executive Johann Kerbrat reveals the company's "barbell" customer acquisition strategy for its new Robinhood Chain, combining meme tokens with tokenized stocks. Three weeks after mainnet launch, the chain has seen over $3B in weekly DEX volume and 105M transactions. Kerbrat explains the logic behind the permissionless chain: meme tokens attract DeFi users, while tokenized real-world assets (RWA), currently over 90 US stocks and ETFs accessible in 120+ countries, serve global users. The goal is to bring Robinhood's 27 million funded accounts on-chain by simplifying DeFi with a user-friendly interface, exemplified by features like Robinhood Earn which offers yield without requiring wallet management. Built on Arbitrum's technology stack for its speed, low cost, and Ethereum's security, the chain focuses on financial products like Earn, spot trading, and perpetuals. Kerbrat downplays direct competition with platforms like Base, emphasizing the goal of expanding the overall market for on-chain assets. He details selective partnerships (e.g., Morpho, Lighter) based on compliance, unique UX, and differentiation. While regulatory clarity is pending for US perpetuals, the expansion continues via Bitstamp in Europe. Finally, Kerbrat positions Robinhood as a "super app" integrating stocks, options, crypto, banking, and AI trading, with all major business lines generating hundreds of millions in revenue. For the chain, current priority is driving adoption over maximizing gas fee revenue.

marsbit1 saat önce

Interview with Robinhood Executive: Meme + Tokenized US Stocks as "Barbell" Customer Acquisition Strategy, All Business Lines Achieve Hundreds of Millions in Revenue

marsbit1 saat önce

Fidelity Q3 Report: BTC, ETH, and SOL Continue to Build Bottoms; How Much Further Will This Crypto Bear Market Go?

Fidelity's Q3 Crypto Signal Report analyzes the current bear market, noting Bitcoin (BTC), Ethereum (ETH), and Solana (SOL) are in a prolonged bottoming phase. Key indicators like the weighted Net Unrealized Profit/Loss (NUPL) have turned negative (-0.01), signaling the market is slightly below its aggregate cost basis, with BTC acting as the primary stabilizing asset. BTC's dominance has risen to 68%, indicating a lack of capital rotation to other digital assets. Performance has been weak across the board, with BTC, ETH, and SOL down significantly year-to-date. Market sentiment is depressed, exacerbated by substantial outflows from spot ETPs and a challenging macro environment. The report compares the current ~203-day downtrend to historical ~300-day bottoming cycles, suggesting the process may be two-thirds complete, with late 2026 as a potential timeframe to monitor. For Bitcoin, NUPL at 0.09 indicates cautious sentiment, while momentum signals remain negative. The Yardstick metric points to potential undervaluation relative to network security (hashrate). Ethereum's NUPL is deep in the "capitulation" zone at -0.43, a historically positive signal for future returns, though its momentum and network fee revenue are negative. Solana shows the deepest NUPL at -0.72 but demonstrates relative resilience in on-chain activity and stablecoin transfer volume. The report concludes that while several metrics are near historical capitulation levels, a definitive market bottom has not yet been established. The path forward likely involves continued consolidation, with BTC's relative strength and fundamental on-chain usage for ETH and SOL providing key areas for investor observation.

marsbit1 saat önce

Fidelity Q3 Report: BTC, ETH, and SOL Continue to Build Bottoms; How Much Further Will This Crypto Bear Market Go?

marsbit1 saat önce

İşlemler

Spot

Popüler Makaleler

O Nasıl Satın Alınır

HTX.com’a hoş geldiniz! O1 exchange (O) satın alma işlemlerini basit ve kullanışlı bir hâle getirdik. Adım adım açıkladığımız rehberimizi takip ederek kripto yolculuğunuza başlayın. 1. Adım: HTX Hesabınızı OluşturunHTX'te ücretsiz bir hesap açmak için e-posta adresinizi veya telefon numaranızı kullanın. Sorunsuzca kaydolun ve tüm özelliklerin kilidini açın. Hesabımı Aç2. Adım: Kripto Satın Al Bölümüne Gidin ve Ödeme Yönteminizi SeçinKredi/Banka Kartı: Visa veya Mastercard'ınızı kullanarak anında O1 exchange (O) satın alın.Bakiye: Sorunsuz bir şekilde işlem yapmak için HTX hesap bakiyenizdeki fonları kullanın.Üçüncü Taraflar: Kullanımı kolaylaştırmak için Google Pay ve Apple Pay gibi popüler ödeme yöntemlerini ekledik.P2P: HTX'teki diğer kullanıcılarla doğrudan işlem yapın.Borsa Dışı (OTC): Yatırımcılar için kişiye özel hizmetler ve rekabetçi döviz kurları sunuyoruz.3. Adım: O1 exchange (O) Varlıklarınızı SaklayınO1 exchange (O) satın aldıktan sonra HTX hesabınızda saklayın. Alternatif olarak, blok zinciri transferi yoluyla başka bir yere gönderebilir veya diğer kripto para birimlerini takas etmek için kullanabilirsiniz.4. Adım: O1 exchange (O) Varlıklarınızla İşlem YapınHTX'in spot piyasasında O1 exchange (O) ile kolayca işlemler yapın.Hesabınıza erişin, işlem çiftinizi seçin, işlemlerinizi gerçekleştirin ve gerçek zamanlı olarak izleyin. Hem yeni başlayanlar hem de deneyimli yatırımcılar için kullanıcı dostu bir deneyim sunuyoruz.

388 Toplam GörüntülenmeYayınlanma 2026.06.19Güncellenme 2026.06.29

O Nasıl Satın Alınır

PROS Nasıl Satın Alınır

HTX.com’a hoş geldiniz! Pharos (PROS) satın alma işlemlerini basit ve kullanışlı bir hâle getirdik. Adım adım açıkladığımız rehberimizi takip ederek kripto yolculuğunuza başlayın. 1. Adım: HTX Hesabınızı OluşturunHTX'te ücretsiz bir hesap açmak için e-posta adresinizi veya telefon numaranızı kullanın. Sorunsuzca kaydolun ve tüm özelliklerin kilidini açın. Hesabımı Aç2. Adım: Kripto Satın Al Bölümüne Gidin ve Ödeme Yönteminizi SeçinKredi/Banka Kartı: Visa veya Mastercard'ınızı kullanarak anında Pharos (PROS) satın alın.Bakiye: Sorunsuz bir şekilde işlem yapmak için HTX hesap bakiyenizdeki fonları kullanın.Üçüncü Taraflar: Kullanımı kolaylaştırmak için Google Pay ve Apple Pay gibi popüler ödeme yöntemlerini ekledik.P2P: HTX'teki diğer kullanıcılarla doğrudan işlem yapın.Borsa Dışı (OTC): Yatırımcılar için kişiye özel hizmetler ve rekabetçi döviz kurları sunuyoruz.3. Adım: Pharos (PROS) Varlıklarınızı SaklayınPharos (PROS) satın aldıktan sonra HTX hesabınızda saklayın. Alternatif olarak, blok zinciri transferi yoluyla başka bir yere gönderebilir veya diğer kripto para birimlerini takas etmek için kullanabilirsiniz.4. Adım: Pharos (PROS) Varlıklarınızla İşlem YapınHTX'in spot piyasasında Pharos (PROS) ile kolayca işlemler yapın.Hesabınıza erişin, işlem çiftinizi seçin, işlemlerinizi gerçekleştirin ve gerçek zamanlı olarak izleyin. Hem yeni başlayanlar hem de deneyimli yatırımcılar için kullanıcı dostu bir deneyim sunuyoruz.

361 Toplam GörüntülenmeYayınlanma 2026.06.22Güncellenme 2026.06.29

PROS Nasıl Satın Alınır

VERONA Nedir

I. Proje Tanıtımı VERONA, zincir soyutlaması aracılığıyla herkes için, her yerde inşa edilmiş bir blok zinciridir. Genel Soyutlama katmanını kullanarak, VERONA, hesaplar, imzalar ve birlikte çalışabilirlik gibi karmaşık blok zinciri işlevlerini doğrudan protokol seviyesinde entegre ederek kendini ayırt eder. Bu yaklaşım, temel teknolojileri anlamaya gerek kalmadan blok zinciri uygulamalarıyla etkileşimde bulunmayı sağlar.1) Temel Bilgiler İsim: VERONA (VERONA)III. İlgili Bağlantılar Resmi web sitesi bağlantısı: https://xion.burnt.com/ Whitepaper: https://xion.burnt.com/whitepaper.pdf Keşif Araçları: https://explorer.burnt.com/ Sosyal Medya: https://x.com/burnt_xion Not: Proje tanıtımı, resmi proje ekibi tarafından yayımlanan veya sağlanan materyallerden alınmıştır, yalnızca referans içindir ve yatırım tavsiyesi teşkil etmez. HTX, ortaya çıkan doğrudan veya dolaylı kayıplardan sorumluluk kabul etmez.

337 Toplam GörüntülenmeYayınlanma 2026.06.22Güncellenme 2026.06.22

VERONA Nedir

Tartışmalar

HTX Topluluğuna hoş geldiniz. Burada, en son platform gelişmeleri hakkında bilgi sahibi olabilir ve profesyonel piyasa görüşlerine erişebilirsiniz. Kullanıcıların A (A) fiyatı hakkındaki görüşleri aşağıda sunulmaktadır.

活动图片