Don't Just Focus on Trading Volume: How to Understand the 'True vs. False Prosperity' of Perpetual Contracts

marsbit2026-02-20 tarihinde yayınlandı2026-02-20 tarihinde güncellendi

Özet

While financial markets evolve, the explosive growth of perpetual futures (Perps) markets stands out. Perps allow leveraged, 24/7 speculation on assets without expiration dates, leading to a surge in trading volume. However, volume alone can be misleading, as it may reflect high-frequency, recursive activity rather than meaningful capital inflow. A more nuanced view emerges when combining volume with Open Interest (OI), which measures the total value of active, unsettled positions. While cumulative perpetual volume doubled to $14 trillion in the past six months (exceeding the previous four years' total), OI growth tells a deeper story. The OI-to-volume ratio, a measure of capital efficiency, has increased from 0.33x to 0.49x over the past year, indicating that more "patient capital" is being deployed and held as open risk. Analysis of top protocols reveals differences in efficiency. Hyperliquid leads with an OI/volume ratio over 45% and a high fee capture rate, demonstrating its ability to convert trading activity into sticky capital and revenue. In contrast, others prioritize different strategies, such as capital retention over fee maximization. Ultimately, the true measure of a perpetual market's strength lies not in volume alone but in its ability to foster trading conviction and sustainable monetization.

Just when you think finance is becoming dull and tedious, it always manages to surprise. Recently, it seems everyone is reshaping the financial system in ways few foresaw, including those from the entertainment and media industries.

Take Jimmy Donaldson (known as "MrBeast" on YouTube) as an example. He not only has a snack empire but recently also acquired a banking app aimed at promoting financial literacy and money management among teenagers and young adults. Why? Perhaps nothing is more straightforward than monetizing a subscriber base of 466 million users with financial products.

This summer, the world's largest derivatives exchange, CME Group, will launch single-stock futures, allowing users to trade futures on over 50 top U.S. stocks, including Alphabet, NVIDIA, Tesla, and Meta.

These restructurings show us how people's ways of engaging with finance are changing. And nothing illustrates this better than the explosion of the Perpetual Markets over the past few years.

Perpetual futures (or Perps) are a type of financial derivative contract that allows market participants to speculate on asset prices without an expiration date. Perps also enable people to express views on assets quickly and cheaply. They are more captivating than traditional markets because they offer instant access and leverage. Unlike traditional markets, they don't require broker onboarding processes, jurisdictional paperwork, or adherence to "traditional" market hours.

Furthermore, on-chain perpetual markets allow any asset (whether traditional or crypto) to be traded in a permissionless, highly leveraged manner. This makes speculation fun, especially when humans can't resist gambling on the trajectory of volatile assets outside traditional trading hours. This enables risk to be priced in real-time.

Consider what happened two weeks ago. When traditional and crypto markets crashed simultaneously, traders flocked to Hyperliquid, driving perpetual gold and silver trading into a frenzy. On January 31st, Hyperliquid alone accounted for 2% of the global daily trading volume in its silver (Silver) perpetual contract market, which had been live for less than a month.

This explains why dashboards of perpetual contract trading volume are increasingly dominating crypto communities and forums. Trading volume is an absolute value. It looks large, refreshes every few minutes, and is perfect for leaderboards. But it misses a key nuance: volume may reflect movement that lacks meaning. A market with high volume might have depth, but it could also be due to rewards and incentives encouraging higher-frequency activity. This activity is often recursive and not very meaningful.

This week, I delved into other metrics of the perpetual trading market. When used in conjunction with trading volume, these metrics add more dimensions and tell a completely different story from volume alone.

Let's begin.

A Few Data Points

The user-friendly interface of perpetual markets makes them a low-barrier, default platform for expressing views across various markets and global assets. The wide selection of highly leveraged derivative trading on both traditional and crypto assets on a single platform has led to perpetual contract volume surpassing spot trading volume on decentralized exchanges. From 44% in February 2025, the share of perpetual contract volume has soared to about 75% today (relative to spot volume).

This growth has been particularly significant in the past few months:

· The cumulative total perpetual trading volume across all platforms over the four years ending July 31, 2025, was $6.91 trillion.

· In just the past six months, this volume has doubled, reaching $14 trillion.
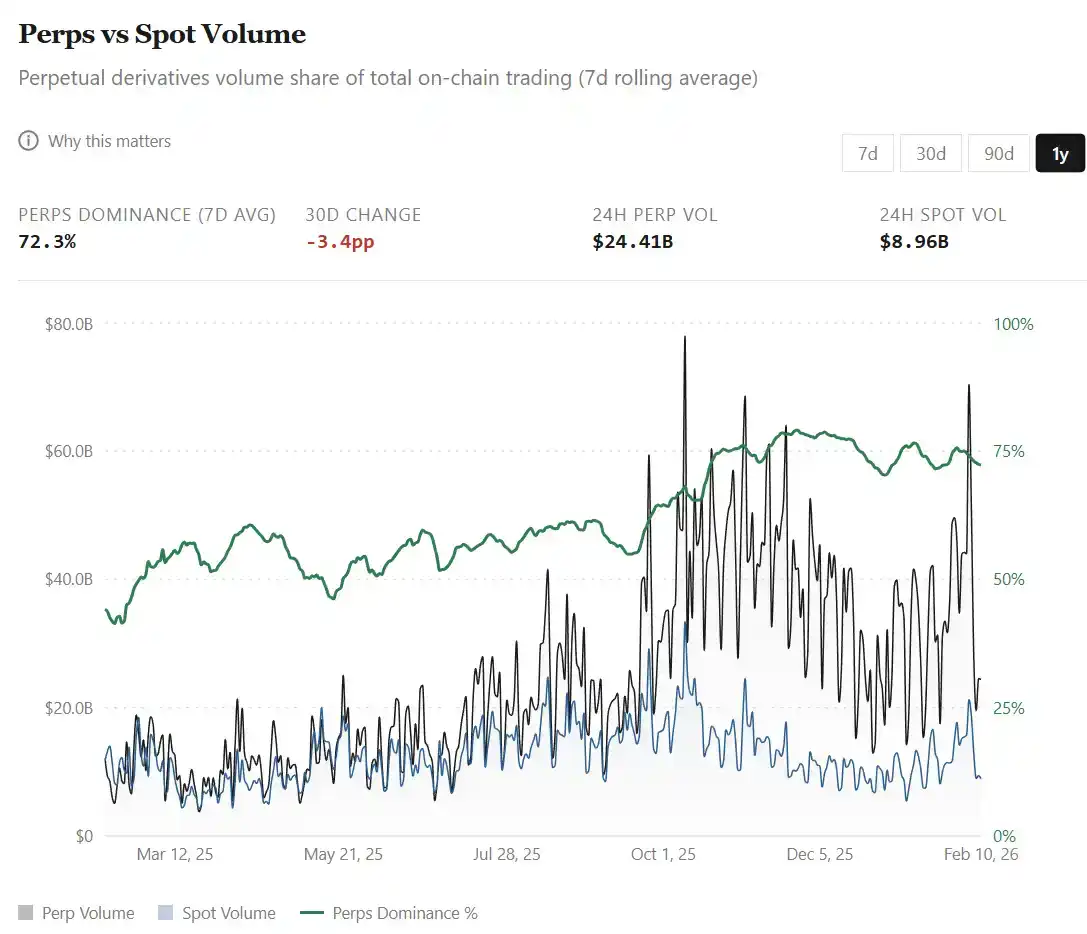
All this growth occurred against the backdrop of the total crypto market capitalization shrinking by nearly 40% between August 1, 2025, and February 9, 2026. This activity indicates that traders are increasingly leaning towards derivative trading, hedging, and short-term positioning, especially when spot markets become highly volatile and bearish.
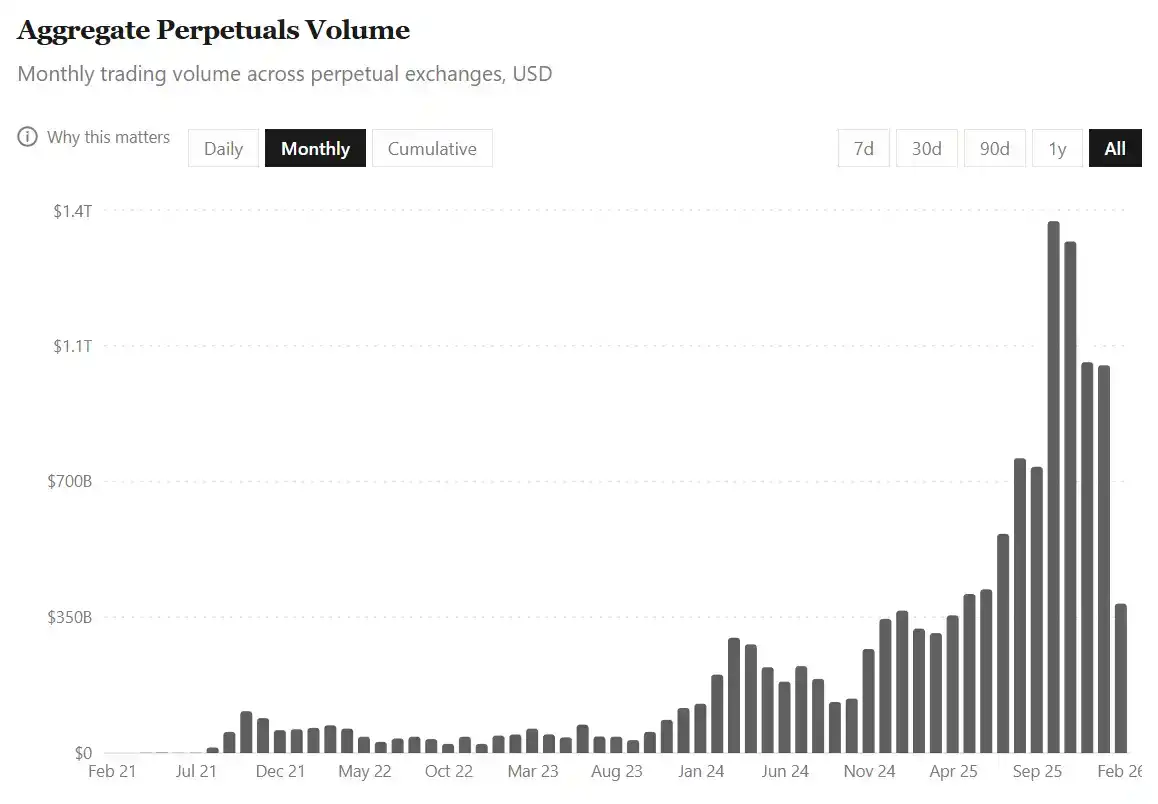
But there's a catch. With such massive activity, it's easy to misread volume metrics. Especially because perpetual trading isn't just about buying assets and holding them long-term; it also involves repeatedly adjusting bet sizes using leverage within shorter time frames.

Therefore, when market turnover accelerates rapidly, a question inevitably arises: Do record-breaking volumes reflect more capital inflows, or the same capital cycling faster?

This is where observing Open Interest (OI) becomes meaningful. If volume reflects capital flow, then OI measures outstanding risk exposure. On perpetual exchanges, OI refers to the total dollar value of active, unsettled long and short contracts held by traders.
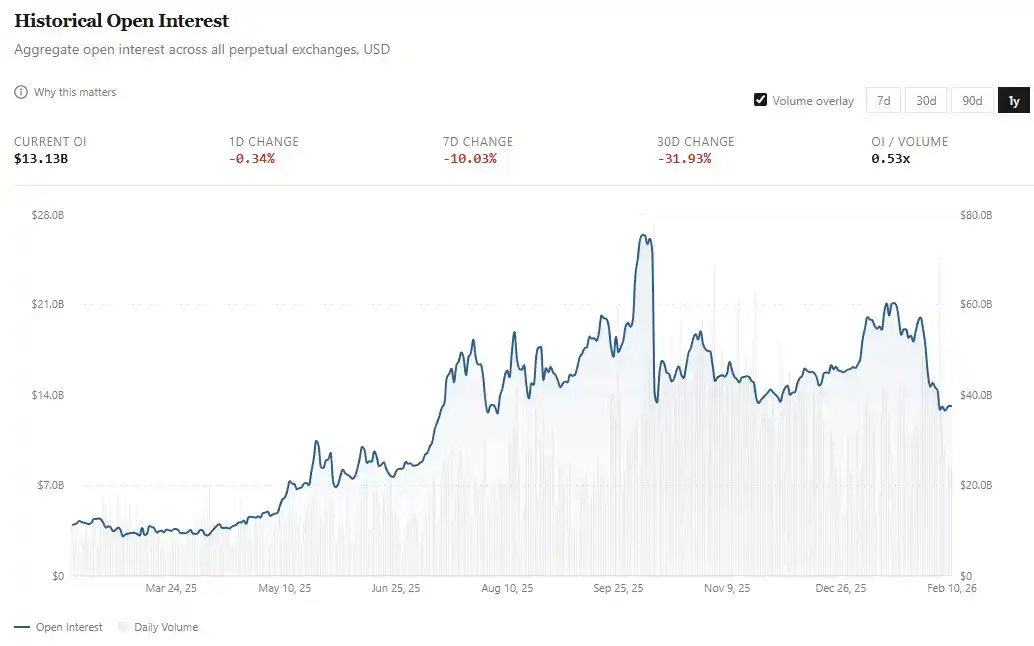
If perpetual trading is being adopted by the mass market, we would hope to see not only larger capital flows but also proportionally growing open interest.

· Last February, OI averaged around $4 billion;

· Now, that number has more than tripled to approximately $13 billion. In fact, the average for the entire January reached about $18 billion before dropping by about 30% in the first week of February.

While perpetual trading volume doubled over the past five months, OI grew by about 50% (from $13 billion to ~$18 billion, then back to $13 billion). To better understand this, I looked at the capital efficiency (i.e., OI as a percentage of daily volume) over the past year.
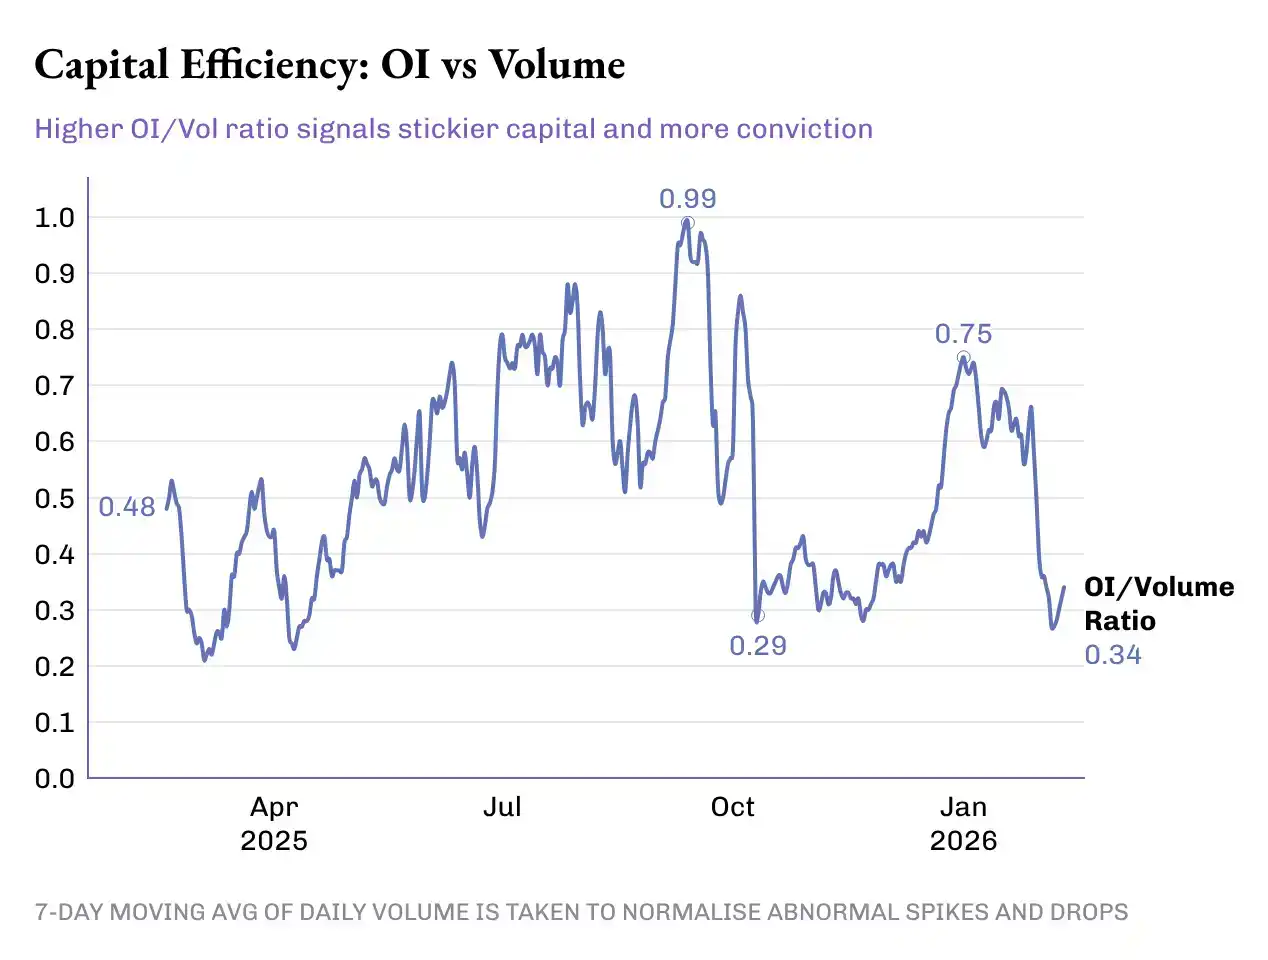
The OI/Volume ratio jumped 50% from last year's 0.33x to 0.49x today. But this progress wasn't smooth; the 50-basis-point increase in the ratio went through multiple peaks and troughs:

· Phase 1 (Feb - May 2025): The Dormant Period. The OI/Volume ratio averaged ~0.46x, with average OI of ~$4.8 billion and average daily volume of ~$11.5 billion.

· Phase 2 (June - Mid-Oct): The Leap. The ratio averaged ~0.72x. During this period, average OI rose to $14.8 billion, and average daily volume was $23 billion. This marked not only record-high volumes but also increased risk exposure and greater capital commitment to these derivatives.

· Phase 3: Market Reversal. This phase began with the massive liquidation on October 10th, which wiped out over $19 billion in leveraged positions within 24 hours. From mid-October to late December, the OI/Volume ratio fell to ~0.38x, driven primarily by volume growth while open interest largely stagnated. October, November, and December saw the three highest monthly volumes in 2025, averaging over $1.2 trillion per month. During the same period, OI averaged around $15 billion, slightly below the average of the previous three months.

Protocol Level

Here, I want to add more dimensions at the protocol level for perpetual markets. This helps us understand how efficiently perpetual exchanges convert trading activity into "sticky capital" and revenue.
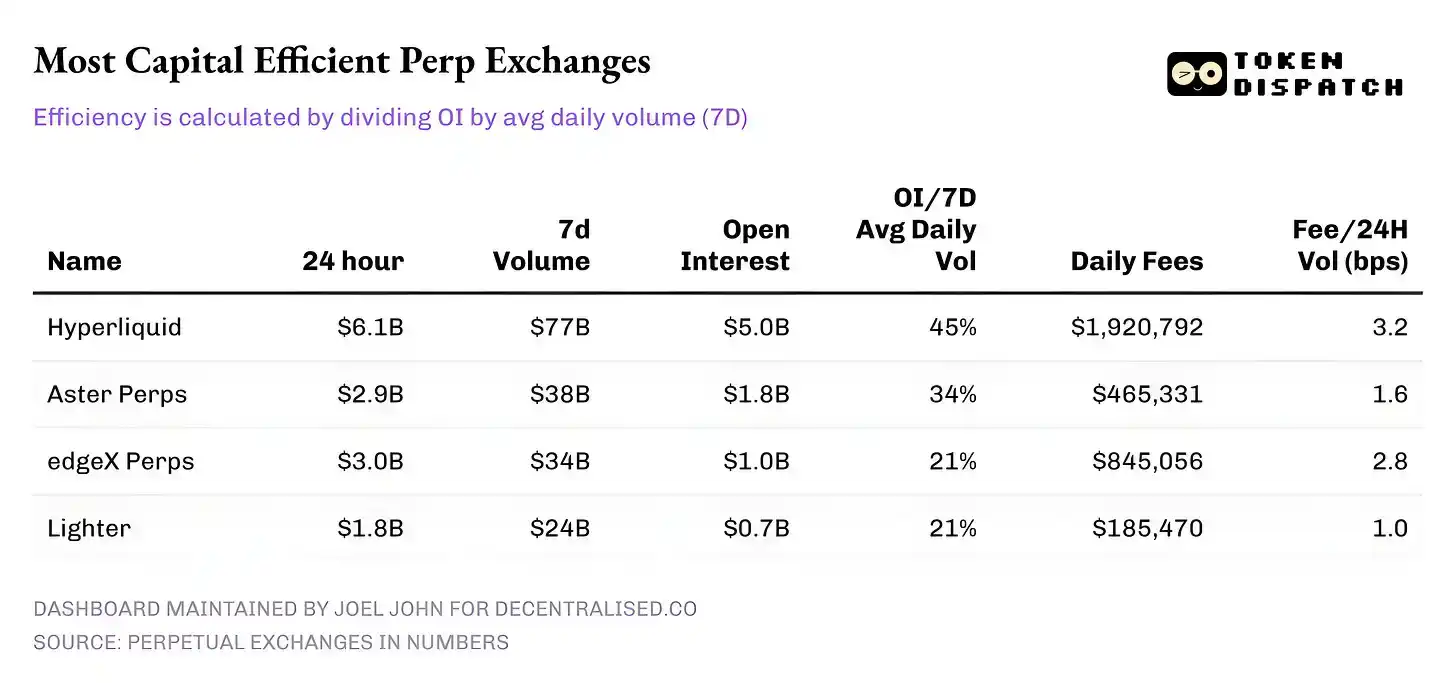
As of February 10th, here's how the top five perpetual exchanges by 24-hour volume performed:

· Hyperliquid: Its ratio of OI to 7-day average daily volume is over 45%, able to convert a large share of volume into lasting positions. This suggests that for every $10 traded on the platform, $4.50 is invested in active positions. This is important because a high OI ratio leads to tighter spreads, deeper liquidity, and confidence in scaling trades without slippage.

· Hyperliquid's fee revenue reinforces this story. Its take rate is about 3.2 basis points, converting the largest share of 24-hour volume into fee income.

· Aster: Currently ranked second, it maintains a decent capital efficiency (OI/Vol) of 34%, despite having almost half the volume of Hyperliquid. However, its monetization is noteworthy – with a lower take rate (~1.6 bps), Aster clearly prioritizes capital retention on its platform over fee maximization.
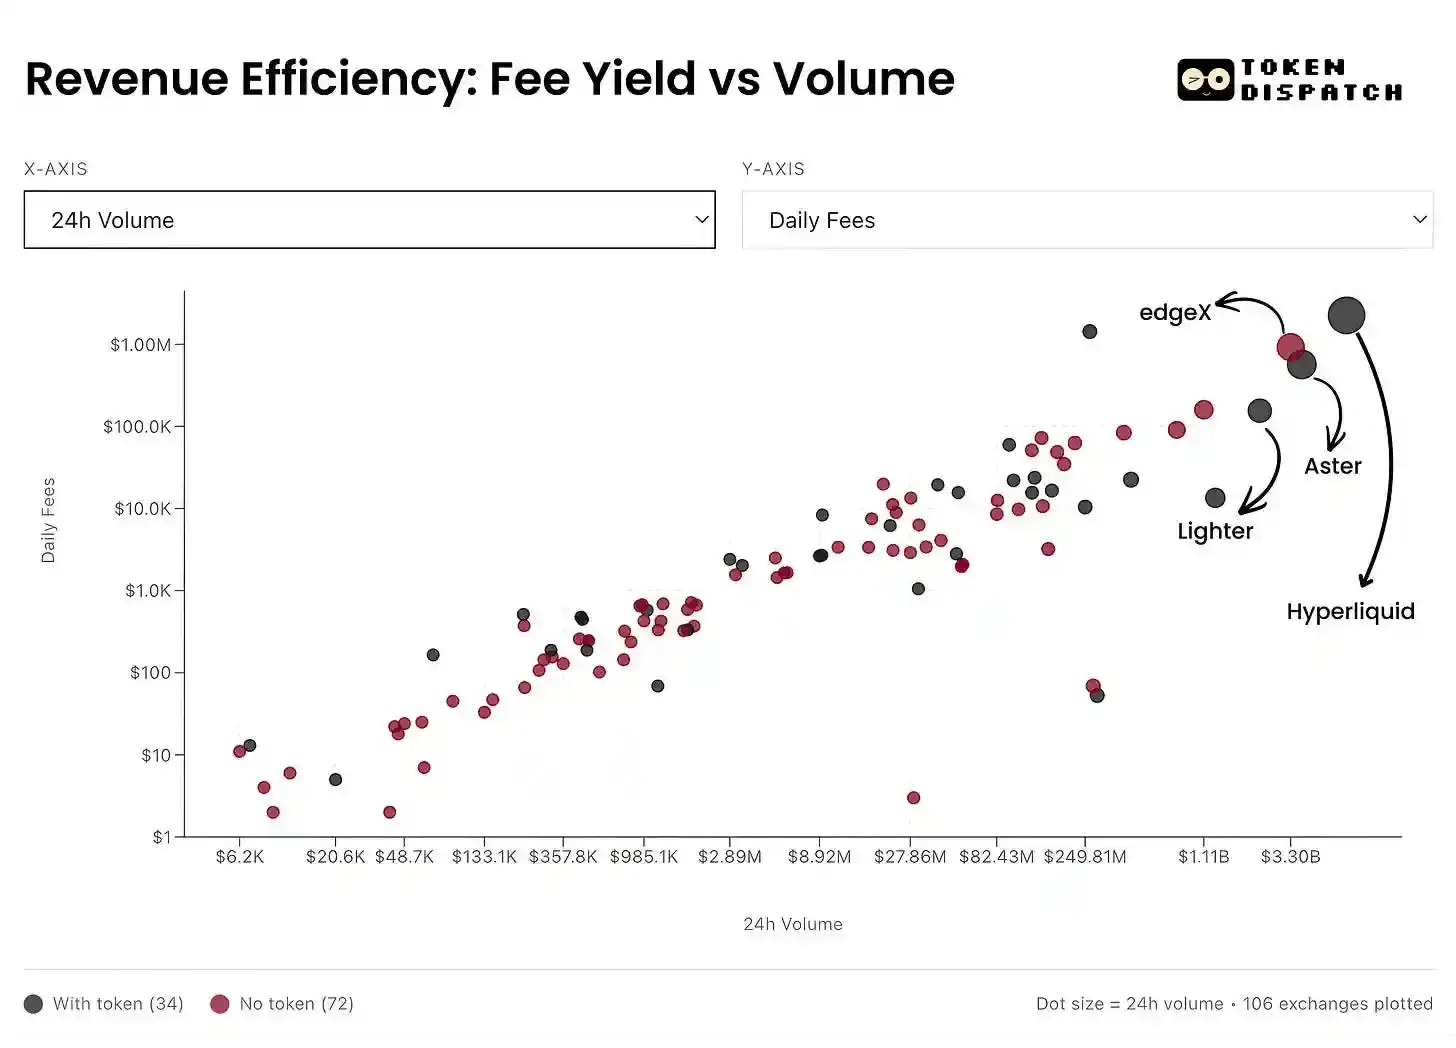
· edgeX and Lighter: Both perform similarly on the capital efficiency ladder, with an OI/Vol of 21% each. However, edgeX's fee monetization is comparable to Hyperliquid's, at 2.8 bps.

Summary

It's remarkable that today's perpetual contract market is no longer a simple growth story; it requires a nuanced reading of multiple metrics. At the macro level, volume is exploding: the growth in cumulative trading volume over six months exceeded the total of the previous four years. But the picture only becomes clear when OI and volume are read together.

A clearer victory lies in the growth of the OI/Volume ratio. This is a direct signal that "patient capital" is willing to trust and bet on the various products and markets emerging in perpetual exchanges.

What's more worth watching in the future is how individual players will evolve from here and what they choose to optimize. Over time, platforms that can optimize "trading conviction" and achieve sustainable monetization will be far more important than those that merely rely on rewards and incentives to dominate volume leaderboards.


İlgili Sorular

QWhat are Perpetual Futures (Perps) and how do they differ from traditional futures contracts?

APerpetual Futures (Perps) are a type of financial derivative contract that allows market participants to speculate on the price of an asset without an expiration date. They differ from traditional futures by providing instant access, leverage, and the absence of broker onboarding processes, jurisdictional paperwork, or adherence to traditional market hours.

QAccording to the article, what key metric should be analyzed alongside trading volume to understand the true health of a perpetual market?

AThe key metric that should be analyzed alongside trading volume is Open Interest (OI). While volume reflects the flow of capital, OI measures the amount of outstanding risk exposure, indicating the total dollar value of active, unsettled long and short contracts held by traders.

QWhat does the OI/Trading Volume ratio measure, and why is its increase considered a positive signal?

AThe OI/Trading Volume ratio measures capital efficiency. An increase in this ratio is a positive signal because it indicates that a larger share of the volume is being converted into lasting, 'patient capital' and open positions, which suggests greater trader confidence, deeper liquidity, and narrower spreads.

QWhich perpetual trading protocol was highlighted for having the highest capital efficiency (OI/Volume ratio) and a strong take rate?

AHyperliquid was highlighted for having the highest capital efficiency, with an OI/7-day average daily volume ratio of over 45%, and a strong take rate of approximately 3.2 basis points, converting the largest share of its volume into fee revenue.

QWhat major market event in October is cited as the start of a phase where the OI/Volume ratio declined significantly?

AThe phase where the OI/Volume ratio declined significantly began with a massive liquidation event on October 10th, which wiped out over $19 billion in leveraged positions within 24 hours.

İlgili Okumalar

Analyzing the Impact of AI on Economic Growth and Productivity

**Title: Analyzing AI's Impact on Economic Growth and Productivity** This article examines three contrasting views on AI's influence on economic growth and productivity. **The Optimistic View** posits that AI, especially through automating R&D ("recursive self-improvement"), could dramatically accelerate growth, even triggering a technological "singularity" with explosive, potentially infinite, economic expansion. **The Moderate/Mainstream View** acknowledges AI's productivity benefits but emphasizes significant real-world constraints that could limit its impact. These include: limited cost savings per task, structural ceilings on which jobs and industries are "exposed" to AI, adoption bottlenecks (e.g., compute, energy, regulatory hurdles), and the "weak link" effect where non-automatable tasks cap overall gains. Consequently, the realized AI dividend may be far lower than optimistic projections, with estimates typically ranging from 0.1% to 1.3% annual productivity growth. **The Pessimistic View** stems from two strands. The first aligns with the moderate view but applies extremely conservative assumptions about task exposure and efficiency gains, yielding minimal projected impact. The second introduces a demand-side critique: if AI primarily replaces rather than augments labor, it could depress labor's share of income, weaken consumer demand, and create a "demand trap" that ultimately stifles growth, unless offset by redistribution policies. **The authors' assessment** is nuanced: * **Short-term (1-2 years):** AI will support growth primarily through investment spending, not significant productivity gains. * **Medium-term (3-5 years):** Three potential paths emerge based on AI demand and bottleneck severity: 1. **"Optimistic Path":** High demand, few bottlenecks. Rapid productivity gains but risk of major job displacement and social conflict without redistribution. 2. **"Moderate Path" (most likely):** High demand but significant, surmountable bottlenecks. Leads to moderate productivity gains, financial market volatility (K-shaped returns), and sectoral job losses. 3. **"Pessimistic Path":** Low demand or severe bottlenecks. Minimal productivity and growth impact, triggering financial market corrections but allowing a smoother societal transition with less labor disruption. * **Long-term:** AI holds potential for a major productivity revolution and prosperity. The conclusion stresses that no path is smooth. Technologically "optimistic" outcomes could be socially detrimental, while "pessimistic" technological diffusion might be more socially stable. Policymakers must monitor developments and prepare balanced responses to manage economic, financial, and social sustainability.

marsbit7 dk önce

Analyzing the Impact of AI on Economic Growth and Productivity

marsbit7 dk önce

The New Cold War is a Tech Stock War

The New Cold War is a Tech Stock War The article argues that the contemporary geopolitical and economic rivalry between the US and China represents a "New Cold War," but one fundamentally fought through technology and financial markets, not physical barriers or conventional trade. Historically, US dominance was secured through financial systems. The Soviet Union, reliant on the rigid "Transferable Ruble," was ultimately undermined by its dependency on the US dollar for oil trade. Later, Japan's semiconductor challenge was countered not just by tariffs (e.g., Plaza Accord, 301 investigations) but by binding it to US Treasury bonds. China presents a more complex, "embedded" challenger. While it holds vast dollar reserves and US debt like Japan, its industrial base is stronger and more diversified than the Soviet Union's. Surviving the initial 2018 trade war phase, the conflict has evolved into a "tech-financial war." The core battlefield is now the stock market. US tech stocks (AI, semiconductors) are treated as sovereign assets, buoyed by bipartisan national will. China is pushing to strengthen its own financial markets to convert industrial strength into financial power and fund its tech ambitions. Companies like ChangXin (semiconductors), Moonshot AI, and DJI compete not just for market share but as financial proxies for their respective systems. The new paradigm is moving from globally efficient monopolies (Apple, Google) towards companies that achieve monopolistic profits within their respective geopolitical spheres. This competition over "pricing power" and financial valuation in segmented markets defines the current era, making the stock market the primary arena for this tech-centric struggle.

marsbit16 dk önce

The New Cold War is a Tech Stock War

marsbit16 dk önce

RWA Weekly: Ten European Financial Institutions Establish Tokenized Asset Cooperative; Ondo Launches New Execution Network Ondo Network

RWA Weekly: European Banks Form Tokenized Asset Cooperative; Ondo Launches New Execution Network Ondo Network Covering July 24-31, 2026, the RWA sector saw a steady on-chain total value locked (TVL) of $36.8 billion, with holder count hitting a record high. However, stablecoin transfer volumes fell sharply (~30%), indicating low on-chain settlement demand. Key regulatory moves include South Korea advancing stablecoin legislation and a push to scrap crypto taxes, Kenya lowering capital requirements for stablecoin issuers, and Zimbabwe approving seven projects for its crypto sandbox. In project developments, BIS-led Project Agorá successfully tested cross-border payments with tokenized funds across six currencies. Ten major European financial institutions formed the RL1 blockchain cooperative to build tokenized asset infrastructure. Other notable updates: Aviva launched a tokenized dollar liquidity fund on XRPL, POSCO International tokenized commercial invoices on Injective, and a Brazilian farmer used tokenized cattle as collateral for a loan. Additional progress includes BNY Mellon migrating its core transfer agent operations to blockchain, Securitize gaining SEC investment advisor registration, and Tether’s compliant stablecoin USA₮ launching on Celo. Ondo Finance introduced Ondo Network, a new execution layer focused on speed and privacy, moving away from its initial chain plans. An analysis highlights that despite the growing scale of on-chain RWAs (~$32B), approximately 90% remain underutilized in DeFi, pointing to a critical challenge in unlocking liquidity and fostering real-world application beyond mere issuance.

marsbit16 dk önce

RWA Weekly: Ten European Financial Institutions Establish Tokenized Asset Cooperative; Ondo Launches New Execution Network Ondo Network

marsbit16 dk önce

South Korean Stock Market Sees Sharp Rebound After Forceful De-leveraging, SK Hynix Rises 30%

On July 31, South Korean stocks staged a historic rebound. The benchmark KOSPI index surged 18.27%, with chipmaker SK Hynix hitting a 30% gain limit. This followed a brutal, near-40% decline in the KOSPI over the previous month, driven largely by a deleveraging spiral involving leveraged ETFs. Analysts attributed the sharp sell-off to structural liquidity issues rather than deteriorating corporate fundamentals. The rally was triggered by a confluence of positive catalysts. Firstly, strong earnings from U.S. cloud giants Microsoft and Amazon alleviated fears of an "AI bubble burst," boosting global tech sentiment. Secondly, SK Group Chairman Chey Tae-won made a rare personal purchase of SK Hynix shares, seen as a strong vote of confidence. Thirdly, the South Korean government announced a 20 trillion won ($139 billion) AI investment fund. In response to the market turmoil, South Korean regulators are tightening controls on leveraged ETFs, admitting oversight shortcomings. Measures include raising minimum cash保证金 requirements for散户 investors and suspending new product launches. While the rebound signals eased liquidity pressure, analysts note deep structural issues remain. The market's future stability is seen as dependent on global tech capital expenditure trends and memory chip price cycles, with some viewing the surge as a technical correction rather than a definitive trend reversal.

marsbit37 dk önce

South Korean Stock Market Sees Sharp Rebound After Forceful De-leveraging, SK Hynix Rises 30%

marsbit37 dk önce

İşlemler

Spot
活动图片