Don’t Celebrate Bitcoin Yet: The Trend Is Still Bearish, And This Is Why

bitcoinist2026-03-21 tarihinde yayınlandı2026-03-21 tarihinde güncellendi

Özet

Based on technical analysis, Bitcoin's recent rally above $75,000 is insufficient to confirm a bullish reversal, as the overall structure remains bearish. The daily chart shows BTC is consolidating within a rising channel, identified as a bear flag pattern, following a prior downtrend. This pattern previously led to a breakdown to $60,000 in early February 2026. A key resistance zone exists around $76,000, where BTC faced rejection. Currently trading near $70,000, a weekly close below this level could trigger a further decline toward $65,000. Analysis of the weekly timeframe using the Gaussian Channel indicator, which has accurately signaled major cycle bottoms in the past, suggests that the February low may not be the final market bottom. The indicator turned bearish after that low, a deviation from historical patterns where the transition preceded the bottom. Consequently, the trend remains cautiously bearish despite short-term rallies.

Bitcoin’s brief rally above $75,000 this week led to bullish optimism in some corners of the crypto market, but technical analysis shows the trend might still be bearish. A close look at BTC’s daily and weekly charts tells a more sobering story, one that shows that the crypto king might continue on a lower correction move in the coming days.

Bitcoin Is Still Trapped Inside A Bear Flag

Bitcoin’s price recovery into the mid-$70,000s this week is not enough on its own to confirm that Bitcoin is out of danger. According to crypto analyst CrypFlow, the bigger trend is starting to look constructive on higher timeframes, but the daily chart still shows a bearish structure that has not been invalidated. Until that changes, the latest bounce may be nothing.

The daily candlestick timeframe chart shows that BTC has spent the past several weeks since early February consolidating within a rising channel structure. This is a pattern that, in the context of a prior downtrend, is technically classified as a bear flag.

Source: Chart from CrypFlow on X

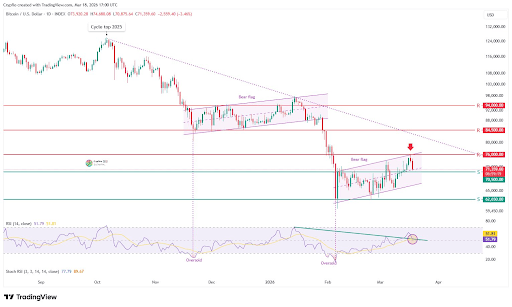
The chart shows Bitcoin rallying into the upper boundary of the flag near the $76,000 area before getting rejected. That same region also lines up with a major resistance band marked on the chart, reinforcing the idea that bulls have not yet done enough to flip the structure. The BTC price has since fallen back toward the middle of the channel, leaving the leading cryptocurrency at a short-term decision point.

As seen in the chart below, a similar bear flag was formed from mid-November 2025 to late January 2026, and this eventually led to the breakdown to $60,000 in early February 2026.

The $70,000 To $76,000 Zone Now Matters More Than Ever

The current battle is taking place between the midline of the flag and the recent rejection zone is at $76,000. At the time of writing, Bitcoin is trading at $70,610, which places it close to support around $70,000. If BTC closes the week below $70,000, then the bear flag projects the price on the path to at least $65,000.

In a separate analysis, CrypFlow turned attention to the weekly timeframe and raised a more macro-level concern using Bitcoin’s Gaussian Channel indicator. This model looks at how Bitcoin has behaved across full market cycles.

According to the analyst, Bitcoin has never formed its cycle bottom before the Gaussian Channel flips from green to red. Each major bottom has come after that transition has already taken place. This pattern played out consistently in 2015, 2018, and again in 2022, where the final lows only arrived once the channel had fully turned bearish.

Interestingly, the Gaussian Channel transitioned from green to red after Bitcoin’s low in early February, not before. Although the Bitcoin price is still holding above $60,000 for now, the implication is that this level may not be the final bottom.

BTC trading at $70,379 on the 1D chart | Source: BTCUSDT on Tradingview.com

İlgili Sorular

QAccording to the technical analysis, why is Bitcoin's trend still considered bearish despite its recent rally above $75,000?

ABecause the daily chart shows a bear flag pattern that has not been invalidated, and the price was rejected at a major resistance near $76,000, indicating the bullish structure is not yet confirmed.

QWhat is the significance of the $70,000 to $76,000 price zone for Bitcoin's near-term movement?

AThis zone represents a critical battle between support and resistance. A weekly close below $70,000 could project a price drop to at least $65,000, according to the bear flag pattern.

QWhat does the Gaussian Channel indicator suggest about whether Bitcoin has reached its cycle bottom?

AThe Gaussian Channel transitioned from green to red after February's low, not before. Historically, major bottoms have only occurred after this transition, suggesting the $60,000 level may not be the final cycle bottom.

QWhat pattern from late 2025 to early 2026 does the current price action resemble, and what was its outcome?

AIt resembles a bear flag pattern that formed from mid-November 2025 to late January 2026, which eventually led to a breakdown to $60,000 in early February 2026.

QWhat key level must Bitcoin break to invalidate the current bearish structure on the daily chart?

ABitcoin must break and hold above the major resistance zone near $76,000 to invalidate the bear flag structure and signal a potential trend reversal.

İlgili Okumalar

İşlemler

Spot
Futures

Popüler Makaleler

T Nasıl Satın Alınır

HTX.com’a hoş geldiniz! Threshold Network Token (T) satın alma işlemlerini basit ve kullanışlı bir hâle getirdik. Adım adım açıkladığımız rehberimizi takip ederek kripto yolculuğunuza başlayın. 1. Adım: HTX Hesabınızı OluşturunHTX'te ücretsiz bir hesap açmak için e-posta adresinizi veya telefon numaranızı kullanın. Sorunsuzca kaydolun ve tüm özelliklerin kilidini açın. Hesabımı Aç2. Adım: Kripto Satın Al Bölümüne Gidin ve Ödeme Yönteminizi SeçinKredi/Banka Kartı: Visa veya Mastercard'ınızı kullanarak anında Threshold Network Token (T) satın alın.Bakiye: Sorunsuz bir şekilde işlem yapmak için HTX hesap bakiyenizdeki fonları kullanın.Üçüncü Taraflar: Kullanımı kolaylaştırmak için Google Pay ve Apple Pay gibi popüler ödeme yöntemlerini ekledik.P2P: HTX'teki diğer kullanıcılarla doğrudan işlem yapın.Borsa Dışı (OTC): Yatırımcılar için kişiye özel hizmetler ve rekabetçi döviz kurları sunuyoruz.3. Adım: Threshold Network Token (T) Varlıklarınızı SaklayınThreshold Network Token (T) satın aldıktan sonra HTX hesabınızda saklayın. Alternatif olarak, blok zinciri transferi yoluyla başka bir yere gönderebilir veya diğer kripto para birimlerini takas etmek için kullanabilirsiniz.4. Adım: Threshold Network Token (T) Varlıklarınızla İşlem YapınHTX'in spot piyasasında Threshold Network Token (T) ile kolayca işlemler yapın.Hesabınıza erişin, işlem çiftinizi seçin, işlemlerinizi gerçekleştirin ve gerçek zamanlı olarak izleyin. Hem yeni başlayanlar hem de deneyimli yatırımcılar için kullanıcı dostu bir deneyim sunuyoruz.

369 Toplam GörüntülenmeYayınlanma 2024.12.10Güncellenme 2025.03.21

T Nasıl Satın Alınır

Tartışmalar

HTX Topluluğuna hoş geldiniz. Burada, en son platform gelişmeleri hakkında bilgi sahibi olabilir ve profesyonel piyasa görüşlerine erişebilirsiniz. Kullanıcıların T (T) fiyatı hakkındaki görüşleri aşağıda sunulmaktadır.

活动图片