Dogecoin Price Just Entered A Critical Level, But Analyst Says It’s Not Time To Buy

bitcoinist2026-06-04 tarihinde yayınlandı2026-06-04 tarihinde güncellendi

Özet

Dogecoin has returned to a major long-term level on its monthly chart, entering what analyst Trader Tardigrade identifies as a critical resistance zone. Historically, this zone within a massive descending broadening channel has seen only two visits in the past decade—in 2017 and 2020—each followed by a strong rejection and deep correction. The coin has already dropped 8% after testing this area. Crucially, the analyst's chart is inverted; the "resistance" line is actually a bullish support line on a normal price chart. Past rejections from this line preceded major rallies. Therefore, the current price action near $0.0937 is viewed as a return to support, with potential for an upward bounce. A move above $0.10 could signal improving sentiment, while a break above $0.25 would confirm a bounce from support. The inverted chart structure even suggests room for significant upside toward double-digit targets.

Dogecoin has returned to a major long-term level on the monthly chart, setting up another important test for the meme coin after months of weak price action.

The setup was initially noted by crypto analyst Trader Tardigrade on X, who argued that DOGE is now sitting at a critical resistance zone where previous rallies have failed. Dogecoin has visited this price zone only twice in the past decade, and each visit ended the same way.

The Pattern That Has Defined DOGE Since 2015

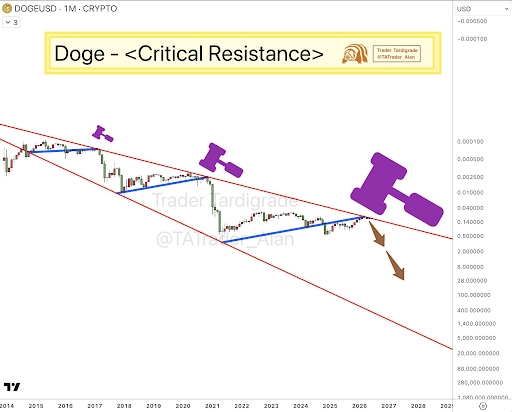
Trader Tardigrade’s long-term Dogecoin chart shows DOGE trading inside a massive descending broadening channel that has shaped price action for years. This channel has shaped Dogecoin’s price action for over a decade now, with two clearly defined red trendlines that widen progressively as time passes.

As shown in the chart below, Dogecoin previously rallied into the upper resistance of this channel in 2017 and in 2020, and both moves ended with strong rejections followed by deep corrections. Now, in 2026, Dogecoin has returned to that same overhead structure for a third time and looks like it is about to reject again. As noted by Trader Tardigrade, this is where we dump Dogecoin.
Source: Chart from Trader Tardigrade on X

Dogecoin has already dropped by 8% over the last three days, a decline that came shortly after DOGE tested that major resistance area, making the pattern a strong warning.

Real Message Behind The Inverted Chart

Trader Tardigrade’s chart presents DOGE/USD on the monthly timeframe, but the price scale is flipped. This means the lower the chart moves, the higher Dogecoin is actually moving in normal market price. Therefore, the red descending line labeled as critical resistance is not a bearish ceiling in the conventional sense, but a bullish line on an inverted chart, and a rejection from it sends the price directly into an upward movement in real terms.

In each of the two previous cases, the 2017 cycle and the 2021 cycle, a rejection from that inverted resistance was followed by a large move downward on the inverted chart, meaning a large rally upward on the normal DOGE chart.

Therefore, the current price action should be looked at as a return to support instead, and the analyst is expecting a bounce to higher price levels. Dogecoin is currently trading at $0.0937, which places it squarely within a support range between $0.09 and $0.10.

A move above $0.10 and into the $0.15 to $0.18 range would be the first indication that sentiment around DOGE is beginning to improve. However, the stronger signal would come from a break above $0.25, as that would make it clearer that DOGE is bouncing from the support structure.

Interestingly, the inverted chart’s structure leaves room for a move into double-digit price targets before Dogecoin reaches the next major trendline.

DOGE trading at $0.09 on the 1D chart | Source: DOGEUSDT on Tradingview.com

İlgili Sorular

QWhat is the critical level that Dogecoin price has just entered, and how significant is it according to the article?

ADogecoin has returned to a major long-term resistance level on the monthly chart, which is a critical price zone it has only visited twice in the past decade. Both previous visits resulted in strong rejections followed by deep corrections, making this level highly significant and a crucial test for DOGE's current price action.

QWho is the analyst mentioned in the article, and what is their key observation about Dogecoin's current chart pattern?

AThe analyst mentioned is Trader Tardigrade on X. Their key observation is that Dogecoin is trading inside a massive descending broadening channel that has shaped its price action for years. DOGE is now testing the upper resistance of this channel for the third time, a zone where previous rallies in 2017 and 2021 failed.

QWhat is unusual about the chart presented by Trader Tardigrade, and how does it change the interpretation of the 'resistance' level?

AThe chart presents DOGE/USD on a monthly timeframe with an inverted price scale. This means the 'descending resistance' line is actually a bullish line on the inverted chart. A rejection from this line on the inverted chart signals a large upward movement for DOGE's actual price. Therefore, the critical level should be viewed as a support zone for a potential price bounce.

QBased on the inverted chart analysis, what price movement is expected for Dogecoin from its current level?

ABased on the inverted chart analysis, a rejection from the 'resistance' (which acts as support on the inverted chart) is expected to lead to a bounce to higher price levels. The analyst anticipates a move upward, with key levels to watch being a break above $0.10, then the $0.15 to $0.18 range, and a stronger signal coming from a break above $0.25.

QWhat is Dogecoin's current price and the key support range mentioned in the article?

ADogecoin is currently trading at $0.0937. The key support range mentioned is between $0.09 and $0.10.

İlgili Okumalar

The Verdict in Choi Tae-won's Divorce Case: Revealing the Inheritance Undercurrent Behind SK Hynix's Trillion-Won Empire

SK Group Chairman Chey Tae-won's high-profile divorce case, involving a record 1.38 trillion won settlement, has drawn attention to the succession plans for Korea's second-largest conglomerate, especially its crown jewel, SK hynix. Unlike traditional chaebol scripts centered on the eldest son, Chey's three children from his marriage to former President Roh Tae-woo's daughter, Roh Soh-yeong, are carving distinct, non-traditional paths. Eldest daughter Chey Yun-jung (b. 1989) is seen as the most evident successor. With a scientific and consulting background, she holds executive roles at SK bioscience and SK Inc.'s growth support department, focusing on future strategy and biopharma. Her marriage is to an AI infrastructure entrepreneur, not a traditional business alliance. Second daughter Chey Min-jung (b. 1991) took a unique route, voluntarily serving as a South Korean naval officer, including an anti-piracy deployment. She later worked on policy and strategy for SK hynix in Washington D.C. before co-founding an AI-driven healthcare startup. She married a former U.S. Marine Corps officer, connecting her to U.S. defense and policy circles—networks crucial for a global semiconductor giant. The only son, Chey In-geun (b. 1995), who studied physics like his father, worked briefly at SK E&S before joining McKinsey. Despite fitting the traditional "heir" profile as the eldest son, he remains silent and holds no public position or shares in SK, suggesting the old succession playbook is obsolete. As SK hynix's valuation soars, becoming a geopolitical asset in the AI era, the heirs' legitimacy is no longer automatic. They must prove themselves in fields like AI biotech, global policy, and strategic consulting. Their marriages also reflect new elite networks in tech and defense, not old political alliances. Their inheritance is the complex challenge of navigating a globalized, tech-driven world, not just a corporate throne.

marsbit2 saat önce

The Verdict in Choi Tae-won's Divorce Case: Revealing the Inheritance Undercurrent Behind SK Hynix's Trillion-Won Empire

marsbit2 saat önce

From OpenSea to OpenRouter: Is Alex Atallah Repeating His 'Exit at the Peak' Playbook?

From OpenSea to OpenRouter: Is Alex Atallah Repeating His "Exit at the Peak" Playbook? According to the Wall Street Journal, payments giant Stripe is in talks to acquire the AI model aggregation platform OpenRouter in a potential deal valuing the company near $100 billion. This would mark founder Alex Atallah's second creation of a company reaching a $100 billion valuation, following his co-founding of NFT marketplace OpenSea. OpenRouter, founded just over three years ago, has grown rapidly by acting as a unified gateway for developers to access over 400 AI models. It currently has about 10 million users and processes over 200 trillion tokens monthly. While the platform's annualized revenue is around $50 million, its valuation has skyrocketed from $1.3 billion in March 2026. The potential acquisition by Stripe, a company OpenRouter's founder once likened it to, represents a major expansion into AI infrastructure for the payments leader. This move echoes Atallah's previous timing with OpenSea, where he departed before the NFT market's significant downturn. For OpenRouter, selling now may be strategic. Despite its scale, its business model—charging a 5-5.5% fee on AI inference calls—faces pressure from competition, open-source models, and potential price wars among model providers, limiting its profitability narrative for an IPO. A key asset for potential acquirers like Stripe is OpenRouter's vast repository of real-world AI usage data, which offers unique insights into model performance and developer preferences that are difficult to replicate. Whether this potential deal signifies a new valuation benchmark for AI infrastructure or another market peak signal remains to be seen.

链捕手3 saat önce

From OpenSea to OpenRouter: Is Alex Atallah Repeating His 'Exit at the Peak' Playbook?

链捕手3 saat önce

İşlemler

Spot
活动图片