Written by: Artemis Analytics
Compiled by: Web3 Xiaolv
We are often misled by the exaggerated stablecoin transaction volumes in article headlines, immersed in the excitement of surpassing V/M transaction volumes, and dreaming of "canceling plans, preparing to win the championship" and replacing SWIFT. When we compare stablecoin transaction volumes to Visa/Mastercard, it's like comparing the volume of securities settlement to Visa/Mastercard—they are not on the same level.
Although blockchain data shows massive stablecoin transaction volumes, most of it is not real-world payments.
Currently, most stablecoin transaction volume comes from: 1) Capital balancing by exchanges and custodians; 2) Trading, arbitrage, and liquidity cycling; 3) Smart contract mechanisms; 4) Financial adjustments.
Blockchain only shows the transfer of value, not why they are transferred. Therefore, we need to clarify the actual payment flow behind stablecoins and the statistical logic. To this end, we have compiled the article 'Stablecoins in payments: What the raw transaction numbers miss, McKinsey & Artemis Analytics,' aiming to help us dispel the fog of stablecoin payments and see the reality clearly.
https://www.linkedin.com/pulse/stablecoins-payments-what-raw-transaction-numbers-4qjke/?trackingId=tjIPCCnHTE6N72YmfMWHVA%3D%3D
According to Artemis Analytics' analysis results: The actual scale of stablecoin payments in 2025 is approximately $390 billion, doubling from 2024.
It is important to clarify that actual stablecoin payments are far lower than conventional estimates, but this does not diminish the long-term potential of stablecoins as a payment channel. On the contrary, it provides a clearer benchmark for assessing the current state of the market and the conditions needed for the scaled development of stablecoins. At the same time, we can clearly see: Stablecoins in the payment field are real, growing, and in the early stages. The opportunity is huge, but these numbers need to be measured correctly.
I. The Overall Transaction Volume of Stablecoins
Stablecoins are increasingly gaining attention as a faster, cheaper, and programmable payment solution. According to reports from Artemis Analytics, Allium, RWA.xyz, and Dune Analytics, their annual transaction volume is as high as $35 trillion.
ARK Invest's 2026 Big Ideas data shows: In December 2025, the 30-day moving average of adjusted stablecoin transaction volume was $3.5 trillion, 2.3 times the combined total of Visa, PayPal, and remittance businesses.
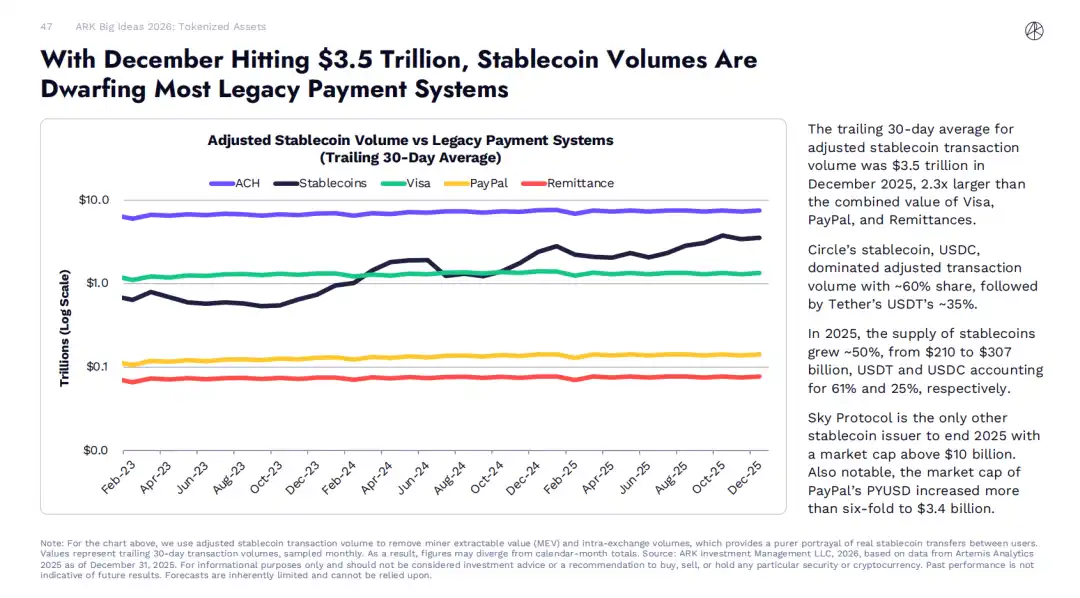
However, most of this transaction activity is not genuine end-user payments, such as paying suppliers or sending remittances. It mainly includes trading, internal fund transfers, and automated blockchain activities.
To filter out interference factors and more accurately assess stablecoin payment volume, McKinsey collaborated with leading blockchain analytics provider Artemis Analytics. The analysis results indicate:
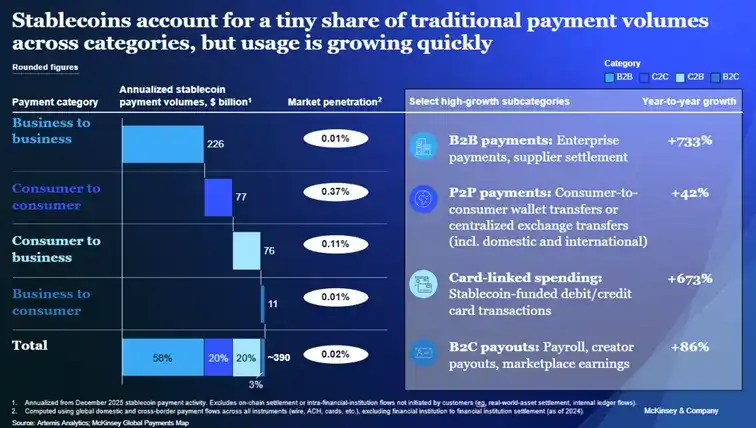
Calculated at the current transaction rate (annualized figures based on stablecoin payment activity in December 2025), the actual annual stablecoin payment volume is approximately $390 billion, accounting for about 0.02% of global payment volume.
This highlights the necessity for a more nuanced interpretation of the data recorded on the blockchain and the need for financial institutions to make application-scenario-oriented strategic investments to realize the long-term potential of stablecoins.
II. Strong Growth Outlook for Stablecoins
The stablecoin market has expanded rapidly in recent years, with its circulating supply exceeding $300 billion, a figure that was less than $30 billion in 2020 (DeFillma data).
Public market predictions all indicate strong expectations for the continued growth of the stablecoin market. On November 12 last year, U.S. Treasury Secretary Scott Bessent stated in a speech at a Treasury market conference that the stablecoin supply could reach $3 trillion by 2030.
Leading financial institutions have made similar predictions, estimating the stablecoin supply to be in the range of $2 trillion to $4 trillion for the same period. This growth expectation has significantly increased the attention financial institutions pay to stablecoins, with many exploring stablecoin applications around various payment and settlement scenarios.
When you filter for payment-like activities, a completely different picture emerges. Adoption is uneven, with typical scenarios as follows:
- Global Payroll & Cross-Border Remittances: Stablecoins offer an attractive alternative to traditional remittance channels, enabling near-instant cross-border fund transfers at very low costs. According to estimates based on McKinsey's Global Payments Map data, the annualized payment scale of stablecoins in global payroll and cross-border remittances is approximately $900 billion. Based on the overall transaction size of $1.2 trillion in this sector from McKinsey's Global Payments Map, stablecoins account for less than 1%.
- B2B Enterprise Payments: Cross-border payments and international trade have long suffered from inefficiencies such as high fees and long settlement cycles, which stablecoins can address. Pioneering companies are using stablecoins to optimize supply chain payment processes and improve liquidity management, with SMEs benefiting significantly. Similarly, based on McKinsey's Global Payments Map data, the annualized scale of B2B enterprise payments using stablecoins is approximately $2.26 trillion, while the global B2B payment volume is about $1.6 quadrillion, with stablecoins accounting for only about 0.01%.
- Capital Markets: Stablecoins are reshaping capital market settlement processes by reducing counterparty risk and shortening settlement cycles. Some asset management institutions have issued tokenized funds that automatically distribute dividends to investors via stablecoins or directly reinvest dividends into the fund, bypassing banks for fund transfers. This early application scenario fully demonstrates that on-chain cash flow can effectively simplify fund operations. Data shows that the annualized settlement transaction volume of stablecoins in capital markets is approximately $80 billion, while the global capital market settlement volume is $200 trillion, with stablecoins accounting for less than 0.01%.
Currently, the evidence cited to support the rapid adoption of stablecoins is mostly public stablecoin transaction volume data, and it is often assumed that this data reflects actual payment activity. But to determine whether these transactions are related to payment behavior, a deeper analysis of the actual content of on-chain transactions is needed.
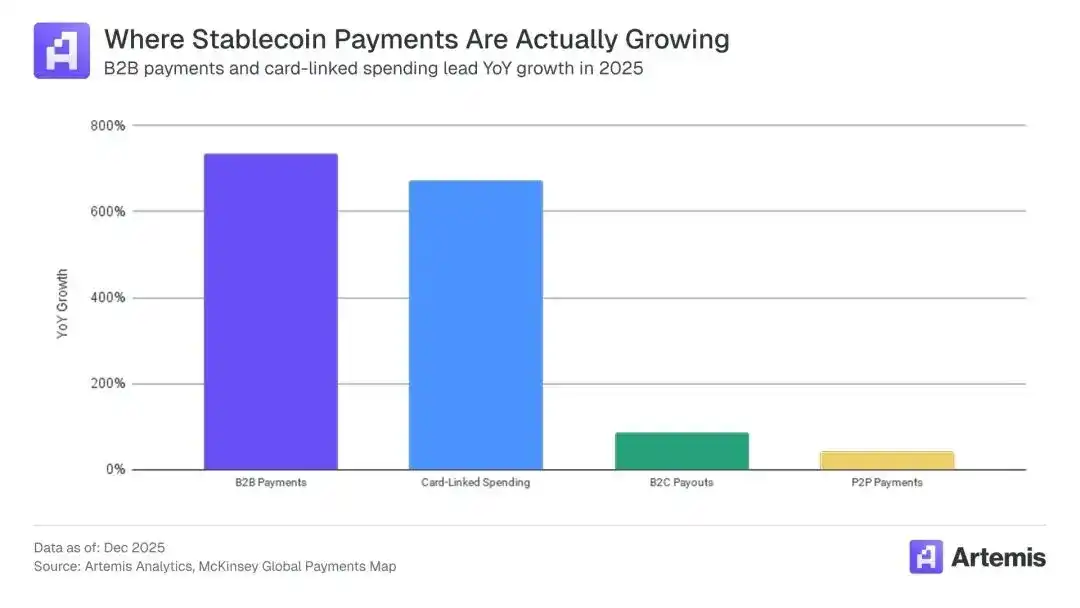
(https://x.com/artemis/status/2014742549236482078)
Currently, most real stablecoin payment transaction volume is highly concentrated in Asia, with Singapore, Hong Kong, Japan, and other regions being at least one transaction channel. Global saturation has not yet been achieved.
Although the aforementioned market predictions and early application scenarios confirm the huge development potential of stablecoins, they also reveal a reality: there is still a significant gap between market expectations and the actual situation that can be deduced merely from surface transaction data.
McKinsey & Company, Global Payments Map
https://www.mckinsey.com/industries/financial-services/how-we-help-clients/gci-analytics/our-offerings/global-payments-map
III. Interpreting Stablecoin Transaction Volume Cautiously
Public blockchains provide unprecedented transparency for transaction activity: every fund transfer is recorded on a shared ledger, allowing people to track fund flows between wallets and various applications almost in real-time.
In theory, compared to traditional payment systems, this feature of blockchain makes assessing the adoption rate of stablecoins more convenient—transaction data in traditional payment systems is scattered across various private networks, only aggregate data is disclosed, and some transactions are not disclosed at all.
But in practice, the total transaction volume of stablecoins cannot be directly equated with actual payment volume.
Transaction data on public blockchains only reflects the amount of fund transfers, not the economic purpose behind them. Therefore, the raw stablecoin transaction volume on the blockchain actually includes various types of transaction behaviors, specifically:
- Cryptocurrency exchanges and custodians hold large stablecoin reserves and transfer funds between their own wallets;
- Automatic interactions of smart contracts, causing the same funds to be transferred repeatedly;
- Liquidity management, arbitrage, and trading-related fund flows;
- Technical mechanisms at the protocol layer that break down a single operation into multiple on-chain operations, thereby generating multiple blockchain transactions and inflating the total transaction volume.
These behaviors are an important part of the on-chain ecosystem and are likely to grow further as stablecoins become more widely adopted. But by traditional definition, most of these behaviors do not fall into the payment category. If they are aggregated and counted without adjustment, they obscure the true scale of actual stablecoin payment activity.
The implication for financial institutions assessing stablecoins is clear:
Public raw transaction volume data can only serve as a starting point for analysis; it cannot be equated with the adoption rate of stablecoin payments, nor can it be seen as the actual revenue potential of stablecoin business.
IV. The Picture of the Actual Scale of Stablecoin Payments
In the analysis with Artemis Analytics, a detailed breakdown analysis of stablecoin transaction data was conducted. The research focused on identifying transaction patterns characteristic of payments, including commercial fund transfers, settlements, payroll, cross-border remittances, etc., while excluding data dominated by trading, internal institutional fund rebalancing, and automated smart contract cycling transfers.
The analysis results show: The actual scale of stablecoin payments in 2025 is approximately $390 billion, doubling from 2024. Although the share of stablecoin transaction volume in overall on-chain transactions and global total payment volume remains relatively low, this data is enough to confirm that stablecoins have formed real and growing application demand in specific scenarios (see chart).
(Stablecoins in payments: What the raw transaction numbers miss)
Our analysis yielded three prominent observations:
- Clear Value Proposition. Stablecoins are becoming increasingly popular because they offer distinct advantages over existing payment channels, such as faster settlement speeds, better liquidity management, and lower user experience friction. For example, we estimate that by 2026, spending linked to stablecoin cards will grow to $4.5 billion, a 673% increase from 2024.
- B2B Leads Growth. B2B payments dominate, amounting to approximately $226 billion, accounting for about 60% of global stablecoin payment volume. B2B payments grew 733% year-over-year,预示着 rapid growth in 2026.
- Most Active Transaction Activity in Asia. Transaction activity is uneven across regions and cross-border payment corridors, indicating that transaction volume will depend on local market structures and constraints. Stablecoin payments originating from Asia are the largest source, with transaction value of approximately $245 billion, accounting for 60% of the total. North America follows with $95 billion, and Europe ranks third with $50 billion. Latin America and Africa each have less than $1 billion in transaction value. Currently, transaction activity is almost entirely driven by payments from Singapore, Hong Kong, and Japan.
Combining the above trends, it is evident that the practical application of stablecoins is gradually taking root in a few validated scenarios, and whether they can achieve broader scaling depends on whether the models of these mature scenarios can be successfully promoted and replicated in other regions.
Stablecoins possess the substantive potential to reshape the payment system, and the release of this potential relies on the continuous advancement of technology development, regulatory improvement, and market implementation. Their scaled application requires clearer data analysis, more rational investment layouts, and the ability to discern effective signals from public transaction data while filtering out noise. For financial institutions, only by harboring development ambitions while objectively recognizing the current state of stablecoin transaction volume, and steadily planning for future development opportunities, can they seize the initiative and lead industry development in the next phase of stablecoin application.