December 17: BTC, ETH, SOL, PTB, IR Market Analysis

金色财经2025-12-17 tarihinde yayınlandı2025-12-17 tarihinde güncellendi

Özet

On December 17, the market analysis covers BTC, ETH, SOL, PTB, and IR amid mixed economic signals. Non-farm data showed both positive and negative impacts, with Wall Street focused on January data for potential rate cuts. BTC remains weak on the 4-hour chart with no clear support. It broke below the trendline with a bearish MACD cross, suggesting further downside. Key support levels are identified at 77,250–78,800 for initial entry, and 74,600–75,000 if 77,000 is breached. ETH is in a correction phase, with MACD nearing zero and potential for accelerated decline. Key supports are at 2,228 and 2,112, with 2,752–2,680 as a possible short-term rebound zone. SOL is trading between Bollinger Bands with supports at 114–102. A break below 100 could lead to a drop toward 86–85. PTB is considered highly risky due to extreme volatility and low trading reliability, often resulting in significant losses. IR has a total supply of 1 billion tokens with initial circulation of 20.5% at a price of $0.1. While it has strong backing and previous protocol revenue, current metrics show decline. Tokenomics are unclear, and cautious approach is advised. Overall, the market suggests waiting for clearer signals post-BoJ decision on the 19th, with strategic entries at key support levels.

Last night, one piece of non-farm payroll data was positive while another was negative, effectively canceling each other out. Wall Street is currently focused on January's data, as it relates to whether there will be a rate cut in January. After the non-farm data was released last night, the prediction market saw a slight increase in expectations for a January rate cut, but the magnitude was not significant.

Bitcoin has continued to weaken and adjust over the past 4 hours, with no clear signals of a halt in the decline or support being found. We will wait until the 19th, after the Bank of Japan's rate hike, to see the market's reaction.
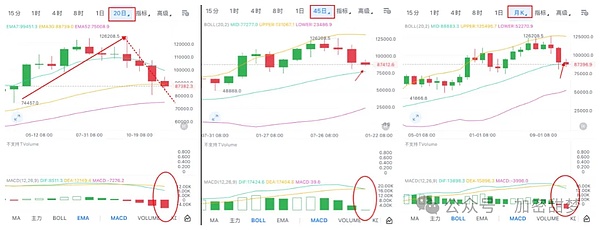
BTC

From a daily chart perspective, BTC has broken below the trend line, and the MACD has formed a death cross, indicating potential for further decline. The daily chart still shows a bearish pattern, so it is advisable to go short at resistance levels.

The monthly Bollinger Band mid-line at 88,800 was breached this week and has now turned into resistance. Therefore, we are now looking at the 45-day Bollinger Band mid-line, which corresponds to 77,250. This month, consider entering a small long position in the range of 78,800–77,250.

The 20-day chart shows a rounding top formation, with downward momentum strengthening. Its support points are the Bollinger lower band at 80,250 and the EMA52 (around 75,000). If the price breaks below 77,000, the key accumulation range for this decline will be 75,000–74,600.
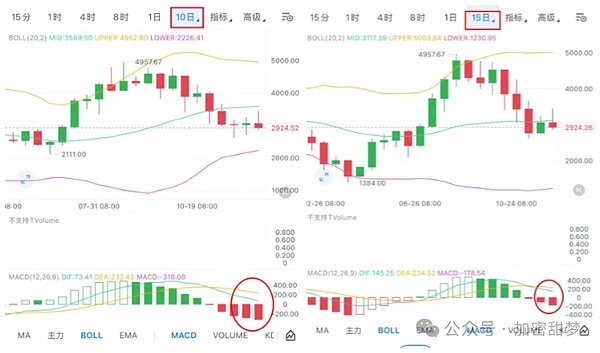
ETH

Currently in a 10–15 day correction phase within a monthly adjustment cycle. The 10-day correction is not yet over, and the MACD fast line is about to hit zero, which could accelerate the decline when it reaches the zero axis. The EMA7/30/52 have all been broken, with only the Bollinger lower band at 2,228 providing short-term support.

The 20-day chart has formed a death cross and is now on a 5-day losing streak, with the price slightly below the mid-band and far from the lower band. The primary support is the EMA52 (2,752). If this breaks, the low could test the June low of 2,112 (indicating a proportional correction and the end of the right-side adjustment). The monthly mid-band has been broken, but the lower band at 1,620 is too far to be effective. The effective support is the EMA52 (2,508).

The阶段性 bottom range for this phase: 2,222–2,112. The range of 2,752–2,680 offers some support and could serve as a short-term accumulation zone if there are no major negative catalysts causing an extreme drop.

SOL

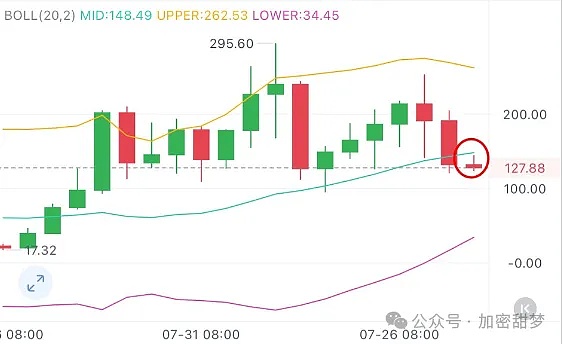
Currently trading between the 10, 15, 20-day and monthly Bollinger mid and lower bands. Their lower bands are all in the range of 114–102, which can serve as one reference for accumulation.

All the 10, 15, 20-day EMA7-30 have been broken, offering no support.

The monthly EMA52 is at 109.5. Therefore, the accumulation range before the 100 level is broken is 114–102.

Considering extreme scenarios where a sharp spike might briefly break below 100, the levels after a false break of 100 would be 96.25–95.65. A break below 95 would be considered a real break, and the price could then fall to around 86.25–84.85.
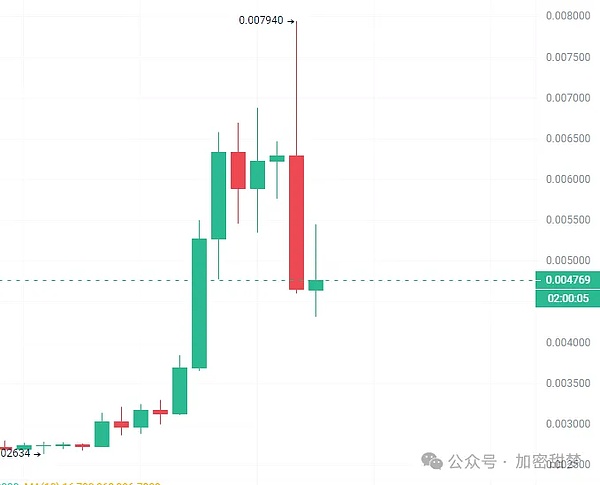
PTB

PTB is a token I wouldn't dare touch. It's like a single-player coin—going long or short is risky, and the risk-reward ratio is very low. You might get a quick profit if you're fast, but if you're slow, you'll get hit. In short, greed will eventually lead to losses. It can pump quickly and then drop over 40% in a single spike.
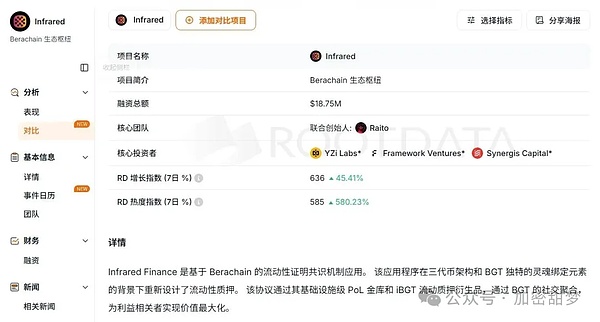
IR

Total supply: 1 billion, initial circulating supply: 20.5%, pool price: 0.1

Pros: 1. Strong funding background—invested by Yzi Lab, co-founder of Bera. 2. Protocol revenue this year exceeded $8 million, TVL is still 210M. 3. Pool price is not expensive at 0.1, 100M. 4. Airdrop is on CEX, and participants say the airdrop is small.

Cons: 1. Protocol revenue has been declining due to the bear market—it peaked but didn't launch a token then, and is doing so now. Peak monthly revenue was $2.81 million in March, but this month it's only around $10,000 so far. 2. Tokenomics haven't been announced, and there's little community discussion.

The project's only chance is to accumulate筹码 during the sell-off, then counter-screw the community to achieve control, fully secure contract positions, and make a profit through contracts. Otherwise, there's basically no opportunity. Not planning to buy at open, will wait for the sell-off to stabilize. With the赚钱效应 of previous projects, market attention is returning to ALPHA, and recent projects have started harvesting. Better to be cautious.

If you find our content helpful, please share our public account with your friends! Welcome to follow and stay tuned for the latest updates in the crypto space! Every sharp decline is followed by vast opportunities. If you're feeling lost about planning for the next market phase, follow Tianmeng. Contact WeChat: RFGH8689

İlgili Sorular

QWhat is the current technical outlook for Bitcoin (BTC) according to the daily chart analysis?

AThe daily chart shows BTC has broken below the trend line with a MACD death cross, indicating a bearish outlook and potential for further decline. The analysis suggests selling at resistance levels.

QWhat are the identified support levels for Ethereum (ETH) in its current correction phase?

AKey support levels for ETH include the 20-day Bollinger lower band at 2228, the EMA52 on the 20-day chart at 2752, and the June low of 2112. The EMA52 on the monthly chart at 2508 is also noted as effective support.

QWhat is the suggested buying range for Solana (SOL) before the $100 level is broken?

AThe suggested buying range for SOL before the $100 level is broken is between 114 and 102, which corresponds to the lower Bollinger bands on the 10, 15, and 20-day charts.

QWhy does the analysis advise caution with the PTB token?

AThe analysis advises extreme caution with PTB because it behaves like a single-coin token, where both long and short positions are risky. It is prone to sharp, sudden drops of over 40%, making it a low性价比 (cost-performance) asset.

QWhat are the main bullish and bearish factors mentioned for the IR token launch?

ABullish factors: Strong funding background from Yzi Lab and Bera's co-founder, $8M+ protocol revenue this year, $210M TVL, and a low pool price of $0.1. Bearish factors: Declining protocol revenue (from $2.81M peak in March to just over $10K currently), no published tokenomics, and low community discussion.

İlgili Okumalar

İşlemler

Spot
Futures

Popüler Makaleler

IR Nasıl Satın Alınır

HTX.com’a hoş geldiniz! Infrared Finance (IR) satın alma işlemlerini basit ve kullanışlı bir hâle getirdik. Adım adım açıkladığımız rehberimizi takip ederek kripto yolculuğunuza başlayın. 1. Adım: HTX Hesabınızı OluşturunHTX'te ücretsiz bir hesap açmak için e-posta adresinizi veya telefon numaranızı kullanın. Sorunsuzca kaydolun ve tüm özelliklerin kilidini açın. Hesabımı Aç2. Adım: Kripto Satın Al Bölümüne Gidin ve Ödeme Yönteminizi SeçinKredi/Banka Kartı: Visa veya Mastercard'ınızı kullanarak anında Infrared Finance (IR) satın alın.Bakiye: Sorunsuz bir şekilde işlem yapmak için HTX hesap bakiyenizdeki fonları kullanın.Üçüncü Taraflar: Kullanımı kolaylaştırmak için Google Pay ve Apple Pay gibi popüler ödeme yöntemlerini ekledik.P2P: HTX'teki diğer kullanıcılarla doğrudan işlem yapın.Borsa Dışı (OTC): Yatırımcılar için kişiye özel hizmetler ve rekabetçi döviz kurları sunuyoruz.3. Adım: Infrared Finance (IR) Varlıklarınızı SaklayınInfrared Finance (IR) satın aldıktan sonra HTX hesabınızda saklayın. Alternatif olarak, blok zinciri transferi yoluyla başka bir yere gönderebilir veya diğer kripto para birimlerini takas etmek için kullanabilirsiniz.4. Adım: Infrared Finance (IR) Varlıklarınızla İşlem YapınHTX'in spot piyasasında Infrared Finance (IR) ile kolayca işlemler yapın.Hesabınıza erişin, işlem çiftinizi seçin, işlemlerinizi gerçekleştirin ve gerçek zamanlı olarak izleyin. Hem yeni başlayanlar hem de deneyimli yatırımcılar için kullanıcı dostu bir deneyim sunuyoruz.

260 Toplam GörüntülenmeYayınlanma 2025.12.17Güncellenme 2025.12.17

IR Nasıl Satın Alınır

Tartışmalar

HTX Topluluğuna hoş geldiniz. Burada, en son platform gelişmeleri hakkında bilgi sahibi olabilir ve profesyonel piyasa görüşlerine erişebilirsiniz. Kullanıcıların IR (IR) fiyatı hakkındaki görüşleri aşağıda sunulmaktadır.

活动图片